
Radiological Habits Survey
Rosyth 2015
Public Report
Report Date: October 2016

1
Radiological Habits Survey: Rosyth 2015
Authors and Contributors:
A. Tyler, A. Watterson, I. Dale, L. Evans, A. Varley, V. Peredo-Alverez, D. Copplestone, S.
Bradley, B. Shaw, P. Smith, M. Clarke, P. Bartie and P. Hunter
Occupational and Environmental Health
Environmental Radioactivity Laboratory
&
1
Contents
Summary .............................................................................................................................. 5
List of abbreviations.............................................................................................................. 9
Units ..................................................................................................................................... 9
1 Introduction.................................................................................................................. 10
1.1 Regulatory Context ............................................................................................... 10
1.2 Definition of the Representative Person................................................................ 10
1.3 Dose Limits and Constraints ................................................................................. 11
1.4 Survey Aim ........................................................................................................... 11
2 Rosyth Survey Area..................................................................................................... 13
2.1 Rosyth Site Location and History.......................................................................... 13
2.1.1 Current Activity .............................................................................................. 13
2.1.2 Changes since 2010...................................................................................... 15
2.2 Estimated Activity Concentrations from Licensed Discharges from Rosyth........... 16
2.3 Survey Area.......................................................................................................... 17
2.4 Land Cover Data................................................................................................... 19
2.5 Soil Data............................................................................................................... 20
2.6 Crop Production.................................................................................................... 20
3 Methods....................................................................................................................... 23
3.1 Introduction........................................................................................................... 23
3.2 Postal Survey........................................................................................................ 23
3.3 Radiometric Surveys............................................................................................. 26
3.3.1 In Situ Dosimetry ........................................................................................... 26
3.3.2 Beta Dosimetry.............................................................................................. 27
3.3.3 Sampling........................................................................................................ 27
3.3 GPS Tracking ....................................................................................................... 27
3.4 Conduct of the Survey .......................................................................................... 27
3.5 Meetings, Informal Contacts and Focus Groups ................................................... 28
3.6 Data Conversion................................................................................................... 29
3.7 Data Rounding and Grouping ............................................................................... 29
3.8 Qualitative and Quantitative Observation.............................................................. 31
3.9 Dose Assessment Tool......................................................................................... 31
4 Survey Site Introduction............................................................................................... 33
4.1 Introduction........................................................................................................... 33
4.2 Survey Area Descriptions...................................................................................... 33
4.3 Site Descriptions for the Firth of Forth Northern Shore.......................................... 33
2
4.3.1 Kincardine...................................................................................................... 33
4.3.2 Culross .......................................................................................................... 34
4.3.3 Preston Island, Torry Bay and Crombie Point ................................................ 35
4.3.4 Charlestown................................................................................................... 37
4.3.5 Limekilns........................................................................................................ 38
4.3.6 Rosyth ........................................................................................................... 39
4.3.7 North Queensferry ......................................................................................... 40
4.3.8 Inverkeithing .................................................................................................. 41
4.3.9 St David’s Harbour and Dalgety Bay.............................................................. 42
4.3.10 Aberdour........................................................................................................ 44
4.3.11 Silversands.................................................................................................... 45
4.3.12 Burntisland..................................................................................................... 46
4.3.13 Kinghorn Harbour Beach and Pettycur........................................................... 48
4.4 Site Descriptions for the Firth of Forth Southern Shore......................................... 50
4.4.1 Bo’ness.......................................................................................................... 50
4.4.2 Carriden......................................................................................................... 51
4.4.3 Blackness ...................................................................................................... 52
4.4.4 Society Point.................................................................................................. 53
4.4.5 Port Edgar and South Queensferry................................................................ 54
4.4.6 Hound Point................................................................................................... 55
4.4.7 Cramond........................................................................................................ 56
4.4.8 Granton.......................................................................................................... 57
4.4.9 Newhaven...................................................................................................... 58
5 Aquatic Radiation Pathways ........................................................................................ 59
5.1 Introduction........................................................................................................... 59
5.2 Postal Survey Results........................................................................................... 59
5.2.1 Internal exposure........................................................................................... 61
5.2.2 External Exposure ......................................................................................... 62
5.3 Commercial fisheries ............................................................................................ 63
5.4 Seafood operations............................................................................................... 63
5.5 Fishing and Angling .............................................................................................. 64
5.6 Wildfowling ........................................................................................................... 64
5.7 Pleasure Craft using the Firth of Forth .................................................................. 65
5.8 Other Pathways .................................................................................................... 66
5.8.1 Wild Swimmers.............................................................................................. 66
5.8.2 Rowing........................................................................................................... 67
5.8.3 Professional Dog Walkers.............................................................................. 67
3
5.8.4 Ramblers ....................................................................................................... 67
5.8.5 Animals Grazing ............................................................................................ 67
5.8.6 Bridge Building............................................................................................... 68
5.9 Internal Exposure.................................................................................................. 68
5.9.1 Adults’ Consumption Rates............................................................................ 68
5.9.2 Children and Infant Consumption Rates......................................................... 70
5.10 External Exposure................................................................................................. 71
6 Terrestrial Radiation Pathways .................................................................................... 74
6.1 Introduction........................................................................................................... 74
6.2 Postal Survey Results........................................................................................... 74
6.2.1 Internal Exposure.......................................................................................... 74
6.2.2 Outdoor Activities........................................................................................... 77
6.3 GPS Survey Results ............................................................................................. 77
6.4 Private Food Production........................................................................................ 77
6.4.1 Allotments and Community Gardens.............................................................. 77
6.4.2 Use of Seaweed as a soil conditioner ............................................................ 79
6.5 Other Pathways .................................................................................................... 80
6.5.1 Production of Honey ...................................................................................... 80
6.6 Internal Exposure.................................................................................................. 81
6.6.1 Internal Exposure Adult Consumption Rate ................................................... 81
6.6.2 Children and Infant’s Consumption Rates...................................................... 83
7 Direct Radiation Exposure ........................................................................................... 84
7.1 Introduction........................................................................................................... 84
7.2 Mobile Gamma Spectrometry Survey.................................................................... 84
7.2.1 Survey Area................................................................................................... 84
7.3 In-Situ Gamma Dosimetry..................................................................................... 85
7.3.1 Terrestrial Areas ............................................................................................ 85
7.3.2 Intertidal areas............................................................................................... 87
7.4 In-Situ Beta Dosimetry.......................................................................................... 89
7.5 Sample Analyses.................................................................................................. 89
7.6 Occupancy levels.................................................................................................. 90
7.6.1 Occupancy data for the survey area .............................................................. 90
7.6.2 Occupancy rates within 1km of BRS (inside/outside work or home)............... 91
8 Doses to the Representative Person............................................................................ 93
8.1 Introduction........................................................................................................... 93
8.2 Aquatic Radiation Pathways ................................................................................. 93
8.2.1 Internal exposure ................................................................................................ 93
4
8.2.2 External exposure.......................................................................................... 93
8.3 Terrestrial radiation pathways............................................................................... 94
8.3.1 Internal exposure........................................................................................... 94
8.3.2 External exposure.......................................................................................... 94
8.4 Overall combined radiation exposure......................................................................... 95
8.4.1 Total exposure (excluding direction shine on site).......................................... 95
8.4.2 With direct shine including from onsite sources.............................................. 95
9 Comparisons with the previous survey......................................................................... 97
9.1 Introduction........................................................................................................... 97
9.2 Aquatic Survey...................................................................................................... 97
9.2.1 Postal Survey: Internal Exposure................................................................... 97
9.2.2 Postal Survey: External Exposure.................................................................. 97
9.2.3 Face-to-Face: Adult Consumption Rates - Internal Exposure......................... 97
9.2.4 Face-to-Face: Children and Infants’ Consumption Rates - Internal Exposure 98
9.2.5 Face-to-Face: Adults Intertidal Occupancy - External Exposure .................... 99
9.2.6 Face-to-face: Children and Infants Intertidal Occupancy - External Exposure
100
9.3 Terrestrial Survey................................................................................................ 101
9.3.1 Postal Survey: Internal Exposure................................................................. 101
9.3.2 Postal Survey: External Exposure................................................................ 101
9.3.3 Face-to-Face: Adult Consumption Rates - Internal Exposure....................... 101
9.3.4 Face-to-Face: Children and Infants Consumption Rates - Internal Exposure102
9.4 Direct Radiation Survey........................................................................................... 103
10 Recommendations and Suggestions for Monitoring Programme Changes................... 104
10.1 Introduction ..................................................................................................... 104
10.2 Conclusions and Recommendations ............................................................... 104
References ....................................................................................................................... 106
5
Summary
This report presents the results of the 2015 survey to determine the habits and consumption
patterns of people living and undertaking recreational activities in the vicinity of the Babcock
Rosyth Site (BRS). The site is authorised to discharge gaseous radioactive waste in addition
to the discharge of liquid radioactive waste through an outfall into the Firth of Forth. Sources
of direct radiation are also found at this site.
The survey targeted three areas that were likely to be affected by discharges from the site,
defined as;
The aquatic survey area; covering the Firth of Forth from Kincardine Bridge in the
west to Kinghorn in the east
The terrestrial survey area; extending 5 km from the centre of the Active Waste
Accumulation Facility
The direct radiation survey area; extending 1 km from the centre of the Active Waste
Accumulation Facility
During the survey, a number of potential exposure pathways were investigated through
postal and face-to-face surveys; the consumption of foods produced within the terrestrial
survey area; occupancy of terrestrial areas and within the direct radiation survey area;
consumption of aquatic food from within the aquatic survey area; occupancy of aquatic and
intertidal areas; handling of equipment used within the aquatic survey area.
Interviews with members of the public were carried out over a period of 14 days and data for
528 individuals are presented and discussed. Those high-rate individuals are identified using
established methods comprising a ‘cut-off’ to define the high-rate group and 97.5
th
percentiles for dose assessment analysis.
The aquatic survey area
Two commercial fishing boats within the survey area fished for brown and velvet crabs and
also lobster.
Fish, crustaceans, molluscs and wildfowl were all consumed by adults. The mean
consumption rates for adult high-rate groups for each of these food groups were:
109 kg y
-1
for fish (bass, cod, mackerel, salmon)
31 kg y
-1
for crustaceans (common lobster)
16 kg y
-1
for molluscs (mussel)
26 kg y
-1
for wildfowl (sourced out with survey area)
6
One child was found to consume 1 kg y
-1
of fish and one infant was found to consume 7.8 kg
y
-1
of fish and 15.6 kg y
-1
of molluscs.
No consumption of marine plants or algae was identified.
Aquatic activities included sea angling, freshwater angling, boat maintenance, being on a
dive boat, canoeing, commercial fishing, commute via boat, diving, jet skiing, paddling,
rowing, safety boat duties, sailing, sports fishing, sub-aqua diving, swimming, power boating,
water skiing, and working on a boat and the Forth Road Bridge.
Intertidal activities included bait digging, beachcombing, boat maintenance, collecting
mussels, razor clams, seaweed or winkles, crabbing, handling creels, dog walking, fixing
moorings, horse riding, paddling, playing, research/educational purposes, rock pooling and
wildfowling. The activities found for adults involving the handling or maintenance of
equipment included boats and boating equipment, clothes and overalls, diving gear, fishing
gear, swimming gear.
The mean rates for the adult high-rate group for occupancy within the aquatic survey area
were:
2664 h y
-1
for intertidal activities
106 h y
-1
for activities in the water
2969 h y
-1
activities on the water
1460 h y
-1
handling equipment
A total of 37 in-situ gamma dose rate measurements were made over intertidal surfaces.
Also, beta dosimetry of skin dose was measured over objects and clothing immersed within
the Firth of Forth.
The terrestrial survey area
The mean consumption rates for the high-rate groups for terrestrial foods were:
68.3 kg y
-1
green vegetables
38.7 kg y
-1
root vegetables
46 kg y
-1
potatoes
38.7 kg y
-1
domestic fruit
20.8 kg y
-1
beef
10.6 kg y
-1
poultry
7
No consumption of locally produced milk, eggs, game, sheep meat, wild fruit or honey was
identified. A total of 46 gamma dose rate measurements were taken in terrestrial
environments.
The direct radiation survey area
The highest occupancy rates in the direct radiation area were as follows:
5110 h y
-1
for the total occupancy rate (for a resident)
3650 h y
-1
for the indoor occupancy rate (for a resident)
1460 h y
-1
for the outdoor occupancy rate (for a resident)
A significant portion of the direct radiation survey area was surveyed by car-borne gamma
spectrometry.
Comparisons with previous surveys
The results of the 2015 Rosyth habits survey were compared with the last habits survey
carried out at Rosyth in 2010.
In the aquatic survey area, the overall mean consumption rate for the adult high-rate group
for fish, crustaceans, molluscs and wildfowl increased in 2015 compared to 2010. The main
species of fish consumed by adults were mackerel and cod in 2010 compared with
mackerel, salmon and cod in 2015. The main crustaceans consumed by adults in 2010 were
brown crab and common lobster, this remained the same in 2015. In 2010 the only molluscs
consumed by adults were winkles compared with mussels in 2015.
The only fish species consumed by children was mackerel (self-caught in the Forth) in 2015
and fish consumed by infants were cod and salmon. The same infant also consumed
mussels in 2015.
The handling of aquatic equipment was found to be lower in 2015 compared to 2010 and
activities included boat maintenance, handling clothes and overalls, diving gear, fishing gear
and outdoor swimming gear.
Consumption rates increased in the 2015 survey in the vegetables (green) food group in
comparison to the 2010 survey. Consumption rates decreased in the 2015 survey in the
following food groups: vegetables (root), vegetables (potatoes), fruit (domestic), meat (beef)
and meat (poultry) in comparison to the 2010 survey. Eggs, rabbit/hare and wild fungi were
not identified in 2010 or 2015. Locally produced milk, pig meat or fresh water fish were not
identified as being consumed in 2010 compared to one person identified in 2015 who
consumed fresh water brown trout from within the survey area.
8
In 2015 the total occupancy, highest indoor occupancy and highest outdoor occupancy
decreased from 2010.
Suggestions for changes to the monitoring programme
The following suggestions for changes to the current environmental monitoring programme
are provided for consideration;
Gamma dose rates should be reported as terrestrial gamma dose rates.
Include mussels within routine monitoring especially from North Queensferry
Harbour.

9
List of abbreviations
AWAF- Active Waste Accumulation Facility
BRS - Babcock Rosyth Site
BSS - Basic Safety Standards
CEFAS – Centre for Environment, Fisheries and Aquaculture
DCC - Dose conversion coefficient
FCYC - Forth Corinthians Yacht Club
GPS - Global positioning system
HP laundry – Health Physics Laundry
HSE - Health and Safety Executive
ICRP - International Commission on Radiological Protection
ILW – Intermediate Level Waste
MoD - Ministry of Defence
NDAWG – National Dose Assessment Working Group
ONR - Office for Nuclear Regulation
QE - Queen Elizabeth
RIFE - Radioactivity in Food and the Environment
RSA - Radioactive Substances Act 1993
SCAPE - Scottish Coastal Archaeology and the Problem of Erosion
SEPA - Scottish Environment Protection Agency
SMoGSS – Mobile Gamma Spectrometry System
Units
Bq - becquerel g - gram
Gy - gray h
-1
- per hour
kg
-1
- per kilogram l
-1
- per litre
µSv - microsievert mSv - millisievert
y
-1
- per year MBq - mega becquerel
10
1 Introduction
1.1 Regulatory Context
The Babcock Rosyth Site (BRS) holds an extant authorisation under the Radioactive
Substances Act 1993 (RSA ’93) to dispose of radioactive waste. The impact of these
disposals needs to be monitored under the requirements of Article 35 of the Basic Safety
Standards (BSS) 96/29 Euratom and to ensure that the doses to the representative person
are within the 1 mSv whole body dose limit and 50 mSv skin dose limit. There are three
primary pathways that may result in the exposure of the public: discharges to the aquatic
environment; discharges to the atmosphere; and direct exposure from the site. Thus,
members of the public may be exposed directly from radiation shine from the licensed site or
through inhalation, and/or indirectly due to exposure to contaminated materials, primarily
foodstuffs (Smith and Jones, 2003). It is also recognised that enhanced doses from external
exposure due to regulated discharges and the consumption of locally sourced foods may
occur as a result of contemporary and historical discharges being concentrated through
natural processes leading to environments with elevated concentrations of anthropogenic
and technological enhanced radioactivity (Dale et al., 2008; Tyler et al., 2013; Tyler et al.,
2009; Tyler et al., 2006). It is the responsibility of the Scottish Environment Protection
Agency (SEPA) to regulate the discharges from site ensuring the public is appropriately
protected. Exposure to direct shine from nuclear, radiation or waste facilities from the
nuclear licensed site at Rosyth is the responsibility of the Office for Nuclear Regulation
(ONR) and the Health and Safety Executive (HSE) where any direct exposure impacts on
facility workers.
1.2 Definition of the Representative Person
The optimal approach for assessing doses to the public is through a combination of site
specific habit data (to determine occupancy and local food consumption rates) and an
environmental monitoring programme (to determine ambient dose rates and concentrations
in foodstuffs). The actual dose received by an individual is dependent upon age, size, sex
and metabolism in addition to the various interactions they may have with sources of
exposure. Thus, the accepted approach is to identify and consider these sources of
variability in appropriate groups. The concept of the representative person was introduced
by ICRP (2006) and recommended to replace the previously used concept of the critical
group in 2007 (ICRP, 2007). The representative person is the individual that represents the
more highly exposed members of the public and is typically defined by a cut-off, for example
the top 97.5 % of the dose distribution within one or more routes of exposure. Within this
11
concept, if the dose received by the representative person(s) can be demonstrated to be
within the accepted dose limits and constraints, then the general public are considered to be
protected.
1.3 Dose Limits and Constraints
The system of dose limitation recommended by the International Commission on
Radiological Protection (ICRP, 2007) and subsequently by the Radioactive Substances
Basic Safety Standards (BSS) requires that dose equivalents received by individuals shall
not exceed the limits set out in Article 13 of the Council Directive 96/29/Euratom (CEC,
1996).
The retrospective maximum permissible dose limits are set out as 1 mSv y
-1
. For
prospective assessments, the maximum permissible doses or constraints used by SEPA
are:
(i) 0.3 mSv y
-1
for any single source of radioactivity, and
(ii) 0.5 mSv y
-1
for a single site from which radioactive discharges are made.
It is also accepted by the UK Government that it should be possible to operate existing
nuclear facilities without exceeding the 0.3 mSv y
-1
constraint (Hunt et al., 1982; Leonard et
al., 1982; Sherlock et al., 2006). It is therefore incumbent upon SEPA to ensure that these
dose limits are not exceeded for all authorised discharges of ionising radiation to the
environment.
1.4 Survey Aim
The aim of the survey is to collect data to allow a bespoke assessment to be made,
identifying the representative individual(s) in combination with data from SEPA’s routine
environmental monitoring programme. The survey may identify any habits which the routine
programme does not currently adequately cover and may also recommend removal of
monitoring that is no longer required. The survey does this by:
(i) Collecting data on a range of habits/activities by the general public across Rosyth
and surrounding areas that might lead to exposure to radioactivity or radiation from
any combination of licensed liquid or gaseous discharges, or direct radiation from on-
site activities at Rosyth.
12
(ii) Collecting information on consumption of food grown or produced (including wild &
free foods) in the survey area and determining an annual rate of consumption for
each individual surveyed and household members of all ages.
(iii) Identify the amounts of radioactivity, radiation and subsequent doses to individual
members of the general public as a result of the disposals or operations of the
nuclear site.
This report presents the findings for the 2015 habits survey of the BRS on the Firth of Forth.
The previous survey was undertaken during the period 26
th
July and 3
rd
August 2010
(Romney et al., 2013) and comparisons are made in Chapter 9.
As SEPA is bound by the Data Protection Act, information which may allow the identification
of specific individuals is not presented in this report.
13
2 Rosyth Survey Area
2.1 Rosyth Site Location and History
The BRS is located on the north bank of the River Forth in Fife, 3 km west of the Forth Road
Bridge and some 50 km from the mouth of the Firth of Forth. It is sited on reclaimed land,
with reclamation completed in 1916. From 1916 the Site was known as HM Dockyard Rosyth
and activities conducted there included refitting and maintaining warships.
The Royal Dockyard and HM Naval Base Rosyth were co-located until 1996 when the Naval
Base closed and operational ships were withdrawn.
In February 1997, MoD sold the Rosyth Dockyard Site to Babcock International Group plc.
The BRS, a wholly owned subsidiary of Babcock International Group Marine Division, holds
a Nuclear Site Licence from ONR and a RSA 93 Authorisation from SEPA to dispose of
Radioactive Waste from the Authorised Premises. The BRS was set up in 1997 to be
responsible for the decommissioning of the Authorised Premises and the management of
radioactive waste that has arisen from the re-fitting and the dismantling of nuclear
submarines berthed on the Authorised premises.
Historically, refitting or de-equipping nuclear submarines has been the prime nuclear
activities carried out at the BRS. However, these activities ended in 2003.
2.1.1 Current Activity
Since 2003, until now, the prime nuclear activities being carried out have been the safe
management of legacy radioactive wastes from submarine refitting operations such as
radioactively contaminated ion exchange resins, and the management of radioactive wastes
from site decommissioning works. The MoD contracts the BRS to carry out these activities
with the Ministry of Defence as the radioactive waste owner performing an assurance
function.
The Queen Elizabeth (QE) Class aircraft carriers are currently being assembled at the BRS.
The site also includes the Rosyth Business Park with a range of buildings used by
commercial companies and educational organisations.
Radioactive waste at Rosyth primarily takes the form of solid waste with an associated liquid
waste discharge. Some parts of the Authorised Premises are also licensed by ONR under
the Nuclear Installations Act 1965 (as amended). Currently, this includes Dry Dock Number
14
2 and Dry Dock Number 3 and the Active Waste Accumulation Facility (AWAF). The ONR is
currently assessing an application from the BRS to delicense the Dock 3 area of the site.
Disposal of radioactive waste from the AWAF is regulated by SEPA under the current BRS
RSA93 Authorisation. Other parts of the site are not subject to licensing under the Nuclear
Installations Act 1965, but disposals of radioactive waste from those parts of the site are
regulated by SEPA under the current RSA 93 Authorisation granted to the BRS.
The BRS is authorised by SEPA under RSA 93 to dispose of solid, aqueous and gaseous
radioactive wastes arising from site decommissioning operations and the management of
legacy radioactive wastes from former submarine refitting operations at the BRS. The BRS
was the first nuclear site operator to have a SEPA multi-media authorisation which was first
granted in 2004 and the conditions and limitations were substantially amended in the notice
of variation, VN01, issued by SEPA to the BRS in 2008. The site is authorised to discharge
cobalt-60 (
60
Co), tritium (
3
H) liquid radioactive waste and other beta-emitting radionuclides
(at an annual limit of 300 MBq) through an outfall into the Firth of Forth. Carbon-14 (
14
C) and
3
H gaseous radioactive waste, and beta associated with particulate (with an annual limit of
0.1 MBq), are authorised to discharge to the atmosphere. Whilst there is a potential for
atmospheric discharge, none has been detected and filters are installed to prevent
particulate atmospheric discharges. Radiographic material testing is undertaken on site
which can lead to locally elevated direct radiation exposure during the duration of a test,
however the effect on the public from the use of such sources within the site and the
resultant shine outwith the site is controlled by the ONR and the Health and Safety Executive
(HSE).
The main facilities which deal with the radioactivity and radioactive waste at Rosyth are:
(i) The AWAF with resin catch tank storage, ventilation plant, ILW Storage pits, Drum
store, compaction and shredding and non-compactable low level waste storage
area. This facility currently stores the radium-226 (
226
Ra) particles from Dalgety
Bay.
(ii) The Radiochemistry Laboratory that produces solid waste, in the form of soft
waste (papers, gloves) and smaller amounts of non-compactable waste such as
glassware, and liquid waste that is treated and discharged into the River Forth
from the Low Active Effluent Discharge Line at high tide.
(iii) The effluent from the Health Physics (HP) laundry flows into an underground
detention tank located outside the HP laundry. The contents are mixed and
15
sampled and analysed for radioactive content prior to discharge via the Low Active
Effluent Discharge Line.
(iv) The High Intensity Calibration Centre.
On site, the dockyard has approximately 2,300 core employees, supplemented with around
4,000 additional agency/subcontract workers. Core employees are deployed across a variety
of projects covering Marine, Nuclear, Oil & Gas and Renewables. The additional workers
predominantly support the construction of the two new Aircraft Carriers – HMS Queen
Elizabeth and HMS Prince of Wales.
There is a cycle to work scheme at the BRS but little evidence for cycling identified. The site
is also served by bus, which travels through the site and there is also a bus scheme,
associated with a Park and Ride from the M90 Motorway.
New housing developments have taken place in the area along Admiralty Road.
Rosyth port has a waterfront and land adjacent to it capable of accommodating a diverse
range of energy, renewables, tourism and financial and business services. Since the last
survey in 2010, the Lexmark factory on Admiralty Road has closed and has recently re-
opened as a fish factory (Meridian Salmon Group). The Fife Coastal Path was extended to
start in Kincardine in 2011 and runs along the coast of the survey area. This is a change
from the previous survey in 2010 with a possible increase of people walking the full length.
2.1.2 Changes since 2010
In 2014, the Office for Nuclear Regulation granted its consent for a project to decommission
and dismantle seven out-of-service nuclear submarines, following an application by the
licensee, the BRS. The application was made under the Nuclear Reactors (Environmental
Impact for Decommissioning Regulations 1999). Submarine dismantling is not planned to
commence until at least 2016 but before starting, the BRS will need a new RSA 93
Authorisation granted by SEPA to allow disposals of low-level radioactive waste arising from
submarine dismantling operations. SEPA is currently determining an application from the
BRS for such a new RSA 93 Authorisation.
A staged approach will be applied to submarine dismantling until MoD announces its
decision where to locate an interim store for the Intermediate Level Waste (ILW) produced
from submarine dismantling operations at the BRS. During Stage 1 dismantling (Initial
Dismantling), only Low Level Waste will be removed from the submarines at the BRS, after
which they will return to storage afloat. When planning permission for the interim ILW store is
16
granted, Stage 2 dismantling will commence, (expected to begin 2020) during which ILW
and any remaining radioactive waste will be removed. The interim ILW store will be used to
store items such as the reactor pressure vessels removed from the submarines.
During decommissioning of the submarines these pressure vessels will be temporarily stored
in the AWAF. Final disposal is likely to be by deep geological disposal at an undetermined
site.
In October 2014, Fife Council produced a development plan which included a proposal for a
biomass plant together with a bypass for Rosyth. The plan identified the wider area around
Rosyth, Inverkeithing and Dalgety Bay up to the Forth Bridgehead as attractive for business,
tourism and residential investment. The plan identified Rosyth port as a strategic
employment and economic activity location and the preferred location for additional freight
capacity and noted possibilities for further development in Rosyth Europark 1, 2 and 3.
In 2015, the Forth (Rail) Bridge was awarded World Heritage site status and a large visitor
centre is now proposed in North Queensferry to cater for those wishing to visit the World
Heritage site.
2.2 Estimated Activity Concentrations from Licensed Discharges from
Rosyth.
Actual licensed discharges of
3
H (5.91E+07 Bq y
-1
) and
60
Co (1.48E+06 Bq y
-1
) from the BRS
reported in 2013 were used to calculate aquatic activity concentrations in water using the
DORIS model within PC CREAM (Public Health England, 2008). Assuming a continuous
release, activity concentrations were modelled in unfiltered seawater, fish, seaweed,
crustaceans and molluscs, with outputs at 1, 5, 50, 500, 10,000 and 100,000,000 years. For
all element dependent parameters (sediment distribution coefficients, KD and deep water),
local compartment details (depth, coastline length, volumetric exchange rate, suspended
sediment load, sedimentation rate, sediment density and diffusion rate) and regional model
information (volume, depth, suspended sediment load, sedimentation rate, sediment density,
diffusion rate) the default values of Rosyth on PC CREAM were used.
Activity concentration values reported at 50 years for aquatic activities were 1.5E-8 Bq l
-1
for
3
H and 4.2E-7 Bq l
-1
for
60
Co. Activity concentrations in fish (
60
Co 1.28E-04 Bq kg
-1
and
3
H
1.49E-08 Bq kg
-1
), crustaceans (
3
H 1.49E-08 Bq kg
-1
and
60
Co 1.40E-03 Bq kg
-1
) and
molluscs (
3
H 1.49E-04 Bq kg
-1
and
60
Co 6.97E-04 Bq kg
-1
).
17
Atmospheric activity concentrations were also modelled using the Plume model in PC
CREAM. As no actual discharges occurred, the authorised limits in 2014 for the BRS were
modelled with PC CREAM. These included
14
C (5.00E+8 Bq y
-1
) and
3
H (2.00E+08 Bq y
-1
).
DORIS was set to calculate activity concentrations released at three different stack heights
(10, 15 and 20 metres) and at a distance of 500, 1,000, 2,000, 3,000 and 5,000 metres. As
the default deposition velocity settings for
14
C and
3
H in PC CREAM have a value of zero, no
activity concentration was reported by our model. PC CREAM was exclusively used to model
activity concentrations and not to calculate doses.
Where present, the modelled activity concentrations were used in the dose assessment tool
to calculate doses through internal pathways such as ingestion of water, fish, crustaceans
and molluscs, and external pathways for aquatic and intertidal activities. These are reported
in Section 3.9. However, it should be noted that in reality if
3
H discharge did occur some
washout would occur resulting in deposition
2.3 Survey Area
Despite the very low radionuclide concentrations modelled by PC CREAM (Public Health
England, 2008) within the Firth of Forth, to remain consistent with previous Rosyth Habits
surveys, the 2015 survey area was defined by three main factors:
Figure 2.1
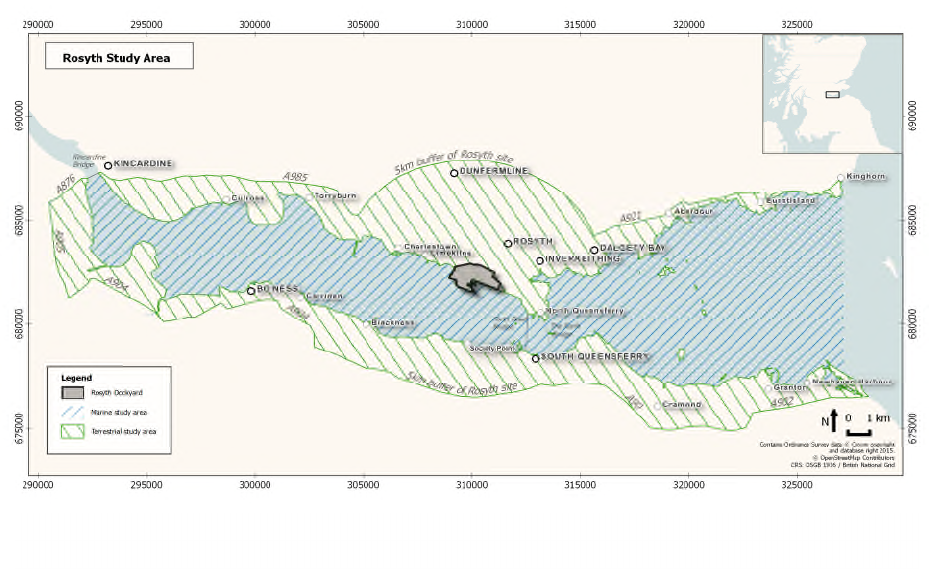
The Rosyth survey area covering the Firth of Forth from Kincardine to
Kinghorn on the northern shore and from Bo’ness to Newhaven on the southern shore.
18
(i) to cover all potential pathways of exposure,
(ii) to extend beyond the 2010 survey area to reflect the survey areas covered by
Babcock International and encompass more of the locally caught fish,
(iii) to cover the same areas used in previous habits surveys conducted in the Rosyth
area for direct comparison and identify any changes since the last survey.
Since there are no current gaseous releases from the site (RIFE 20), the main pathway of
public exposure from the BRS is the aquatic pathway from discharges of
60
Co and
3
H into
the Firth of Forth. The survey area for the marine pathway covered the Firth of Forth and its
intertidal areas from Kincardine Bridge in the west to Kinghorn in the east on the northern
shore of the estuary, and from Bo’ness in the west to Newhaven in the east on the south
shore (Figure 2.1).
To address potential atmospheric discharges of
14
C and
3
H the survey area was defined as a
5km radius from the Active Waste Accumulation Facility (AWAF). Any possible atmospheric
releases are likely to have minimal impact on the terrestrial survey area. The direct radiation
survey area was represented by the immediate public areas around the AWAF inside the
BRS and up to 1 km around its boundaries. Outside the 5 km area used to model
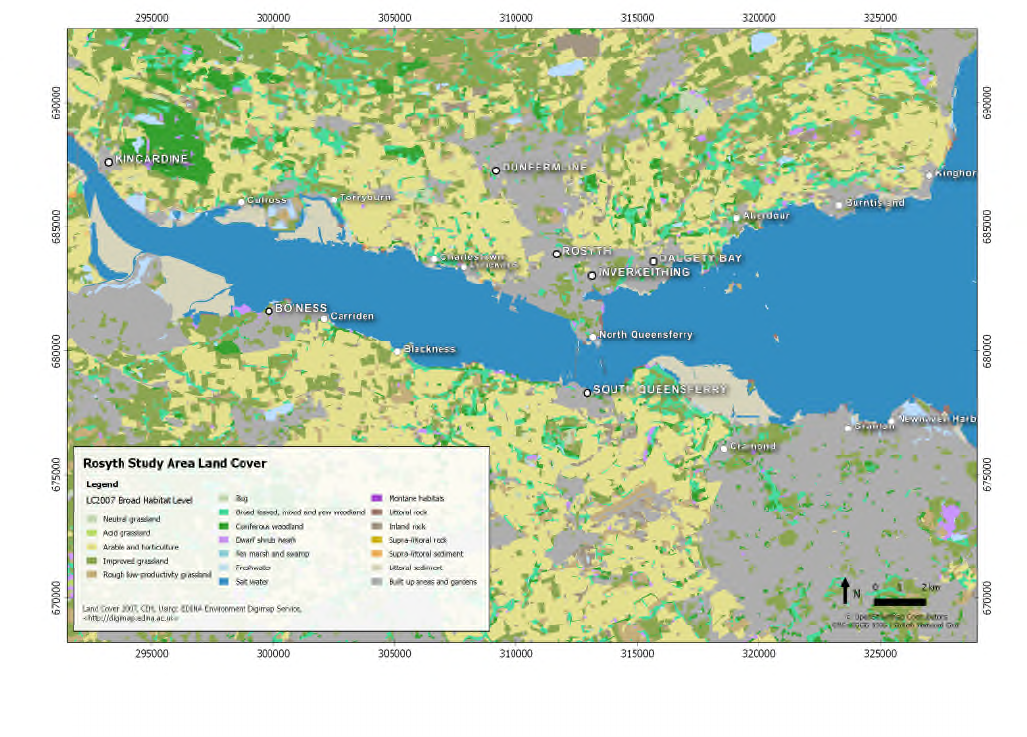
Figure 2.2 Land cover data for the Rosyth, Firth of Forth area (EDINA online 2007).

19
atmospheric discharges, the terrestrial survey area was bounded by the coastal roads on the
northern and southern shorelines (Figure 2.1).
2.4 Land Cover Data
The land cover data for the survey area is shown in Figure 2.2 (EDINA online 2007) and
shows that the area is dominated by built up areas and gardens and arable and horticultural
land capable of producing moderate to good crop yields and moderate grassland is the third
most dominant land cover type outside the aquatic environment. This is summarised in
Table 2.1, which provides a summary of the land cover types within the 1 km, 3 km and 5 km
areas surrounding the BRS.
Table 2.1 shows the increasing importance of arable and horticultural land within increasing
buffer size around the site increasing from 14% in the 1 km zone to 25.5 % in the 5 km zone,
largely at the expense of built up areas and gardens.
Table 2.1 Area of land cover in hectare with buffer zones surrounding the BRS
Land Cover 2007 Broad Habitats
Within
1 km
(hectares)
Within
3 km
(hectares)
Within
5 km
(hectares)
Arable and Horticulture 164 84 2,827
Broad Leaved, Mixed and Yew Woodland 14.8 160 509
Built up Areas and Gardens 335 1,058 2,218
Coniferous Woodland 4.38 73.3 278
Dwarf Shrub Heath 0.00 26.1 48.7
Freshwater 0.00 10.7 20.4
Improved Grassland 81.8 318 756
Inland Rock 12.67 21.6 96.9
Littoral Rock 0.00 13.3 20.6
Littoral Sediment 16.4 47.6 95.7
Neutral Grassland 0.00 2.14 66.1
Rough Low-Productivity Grassland 0.83 43.5 175
Salt Water 518 2,254 3,986
Supra-littoral Sediment 2.81 2.81 5.29
Grand Total 1,151 4,871 11102
20
2.5 Soil Data
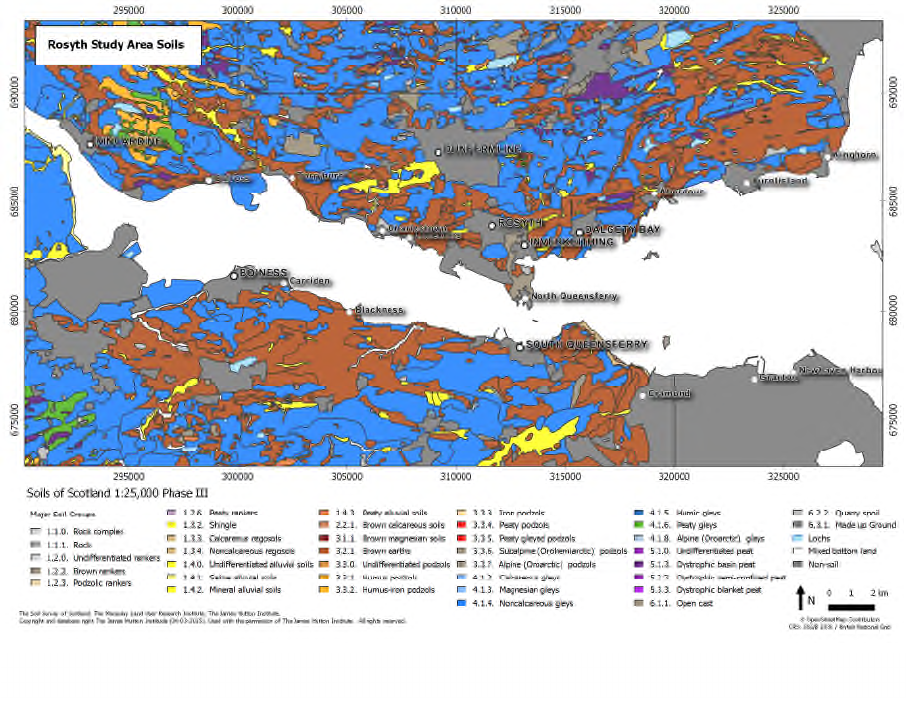
The soil data for the study area surrounding the BRS is presented in Figure 2.3 and
reproduced from data provided by the Macaulay Land Use Research Institute. The soils are
dominated by brown earths and non-calcareous gleys with minor amounts of alluvial soils
and peaty gleys and podsols towards the west of the study area.
2.6 Crop Production
Figure 2.3
Soil types surrounding the BRS (Macaulay Land Use Research Institute)

21
Whilst Rosyth itself is largely urban, the survey area either side of the Firth of Forth has a
significant amount of agriculture land. The Scottish Agricultural Census data for the parishes
(defined by postcodes as used by the Scottish Government) surrounding the BRS has been
summarised in Table 2.2. The data were kindly supplied by the Environment and Forestry
Directorate of the Scottish Government, including Dalgety, Dunfermline, Inverkeithing on the
north side of the Firth of Forth, and Abercorn and Dalmeny to the south. A total of 13,489
hectares of land are available for production in these parishes. Cereal production is
dominated by wheat and barley production for crops, and Table 2.2 summarises the number
of holdings, the area under production for crops and the estimated yield.
In addition, potatoes, peas, beans and other vegetables are produced in these parishes. Soft
fruit and orchard fruit are also grown. Table 2.3 summarises the remaining use of the
agricultural land usage in the parishes surrounding Rosyth.
Table 2.2 Summary of commercial crop production in the Rosyth area (2014),
summarised from the Scottish Agricultural Census
Crops and Fallow
Land
Number of
Holdings
Area
(hectares)
Estimated
Yield (tonnes)
Wheat 24 1,175 11,363
Winter Barley 16 680 5,648
Spring Barley 23 904 5,566
Total Barley 27 1,584 10,327
Oats, Triticale and
Mixed Grain
10 156 1,090
Rape for Oilseed and
Linseed
12 597 2,519
All Other Crops 14 48
Fallow Land < 5
Years
26 242
Fallow Land > 5
Years
9 23
Total Crops, Fallow
and Set-side
43 3,980

22
Table 2.3 Summary of other agricultural land in the Rosyth area (2014), summarised from
the Scottish Agricultural Census
Grazing and other Holdings Hectares
Grass under 5 years old 34 356
Grass 5 years and older 104 2,758
Rough grazing 41 2,969
Total grass and rough grazing 129 6,083
Utilised agricultural area
(crops, grass and grazing land)
139 10,062
Woodland 41 2,898
Other land 60 479
Total 152 13,439
23
3 Methods
3.1 Introduction
To provide consistency and traceability to previous Habit surveys, the methods employed
and described in this chapter are largely based on the approach outlined in Leonard et al.
(1982), Green et al. (2001) and National Dose Assessment Working Group (NDAWG)
(2013). The previous habit survey in 2010 provided a useful frame of reference for
undertaking this survey of the BRS site. Chapter 2 described the desktop study undertaken
to characterise and define the Habits Survey, including:
(i) a review of site activities
(ii) the modelling of the atmospheric and marine discharges from the site to define the
survey area boundary
(iii) an assessment of the land cover and agricultural activity
The 2015 Habits Survey of Rosyth covers activities and food consumption. Following
discussion with SEPA, the survey introduces the following new methods to try and capture a
full range of relevant habits, validate methods and characterise the radiological environment:
(i) an initial postal survey to help target the subsequent face-to-face survey
(ii) a mobile radiometric survey to characterise the heterogeneity of radiation in the
environment surrounding the Rosyth site
(iii) GPS tracking on a number of volunteers to better understand the time spent by
individuals as they interact with the environment (although due to the limited number
of individuals tracked and resultant specific personal data obtained the results are not
directly reported in this report)
(iv) Information and focus groups during and after the face-to-face surveys to validate the
data and findings
3.2 Postal Survey
To obtain a provisional independent assessment of the activity and food consumption habits
of the local community living within the study area through the survey, a postal questionnaire
for households was designed, piloted, and after ethical approval, distributed to 1000
households selected using stratified random sampling methods, based on the areas defined
in Figure 3.1. The survey included a map for identifying the range of activities undertaken by
household members. The sample included populations living in the following geographical
areas (see Figure 3.1):
24
(i) Within 1 km from the site boundary (zone 1B)
(ii) Between 1 km and 3 km from the site (zone 2B)
(iii) Between 3 km and 5 km from the site (zone 3B)
(iv) Zones 1-3 repeated within the plume area. This was governed by the prevailing wind
direction (zones 1A to 3A)
Postcodes for all the geographical areas described above, and shown in Figure 3.1, were
generated. The electoral register was grouped according to the zones shown in Figure 3.1.
Contact details of people living within these postcode areas were randomly selected to
provide a demographic cross-section of individuals. An assessment was made of the
deposition areas from the plume using the prevailing wind direction. Under the area of the
potential plume, 50% of the surveys were posted to people living north west of the BRS.
Considering the weighting factor under the plume, the number of surveys were equally
divided on each zone, with zones 1 to 3 under the plume receiving 167 surveys each and
Zones 1, 2 and 3 outside of the plume receiving 167, 166 and 166 respectively. Sampling
and surveying at different distances from the site enabled the relationship between distance
and habits to be explored and provided a means of producing additional potentially useful
Figure 3.1
The postal survey zones for the Rosyth area centred from the site boundary
25
data. The postal survey produced an independent data set from a broader cross section of
the population living in the area again potentially providing the means to identify new or
missed habits that might provide useful focus to target some of the face-to-face surveys or
information groups.
The survey and information was mailed out and a reminder was sent out after 2 weeks to
people who had not returned the survey. The distribution of the questionnaire responses, by
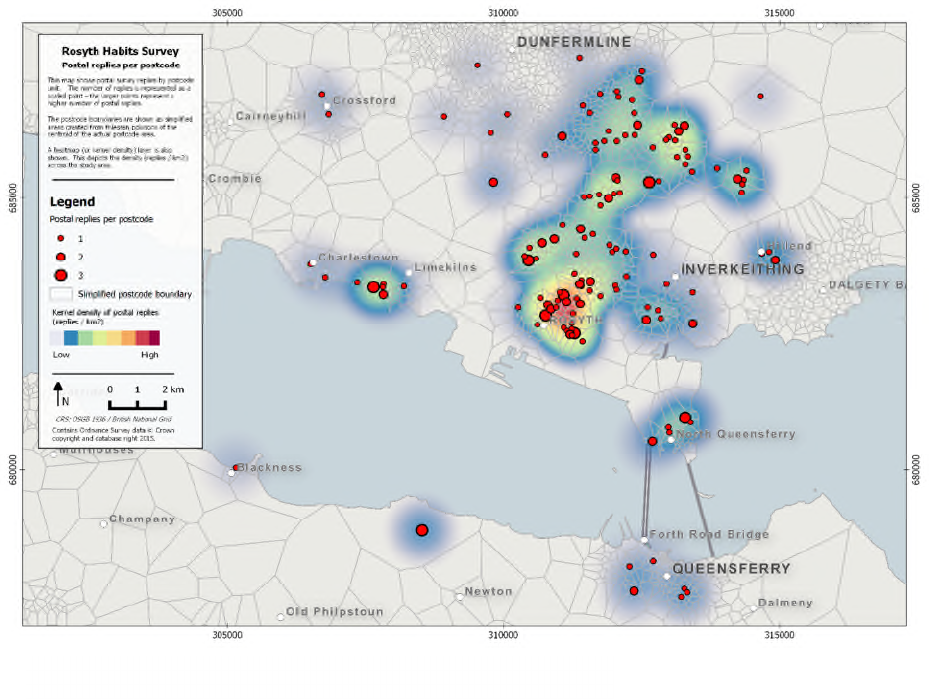
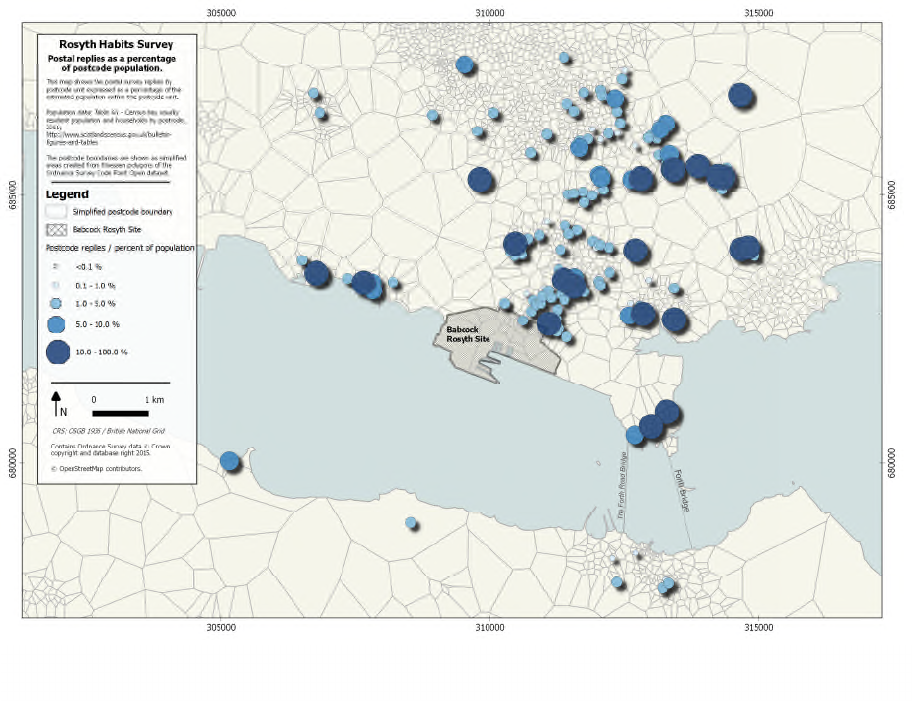
postcode, is shown in Figure 3.2. The percentage response received per head of estimated
population in each postcode area is presented in Figure 3.3. It is important to note that
postcodes with very small populations can result in 100 % response when surveys are
returned.
The postal survey helped refine and revise the face-to-face survey tools and identify the
optimal areas to target the face-to-face surveys. It also provided information on sites for the
collection of observation data and indicated at what times the areas might be busy and
supplied additional information and contacts with regard to both individuals and a wider
range of activities that might merit further investigation in the later survey work.
Figure 3.2
Postal Survey Responses for the Rosyth Area
26
3.3 Radiometric Surveys
The radiometric surveys comprised a carborne gamma spectrometry survey, in-situ air-
kerma dosimetry and beta skin dosimetry. The carborne survey work is described in
Appendix A.
3.3.1 In Situ Dosimetry
The ERL has ISO 17025:2005 accredited procedures for the deployment and recording of
gamma dose rate in air (air kerma), using ISO 17025:2005 accredited (UKAS) accredited
calibrations for two Thermo Radeye instruments. Measurements were undertaken at all
locations where occupancy or location was likely to lead to higher exposure to radioactivity
or radiations as a result of site activities. These included areas that may have elevated
radionuclide concentrations where fine sediment is known to accumulate (e.g. salt marshes
and mudflats). The effective dose from terrestrial gamma radiation was calculated and
reported in μSv h
-1
. Further details of the in-situ methodology can be found in Appendix B.
Figure 3.3.
Showing the percentage response per size of local population (local
population from postcode headcounts 2011)
27
3.3.2 Beta Dosimetry
A ruggedized Thermo BP19RD /Electra instrument was deployed to assess the Beta
dosimetry of skin dose [H’(0.07)]. The BP19RD provided a wide area monitor instrument
(100 cm
2
) and used to monitor items that were used in the Firth of Forth and potentially
exposed to the higher radioactivity concentrations, i.e. close to licensed discharge points.
Items monitored included: wetsuits, waterproof clothing, fishing tackle and nets. Further
details of the Beta skin dosimetry can be found in Appendix C.
3.3.3 Sampling
Where unusual foodstuffs or areas of possible contamination were identified and not
included within the SEPA’s monitoring programme, samples were collected and analysed by
gamma spectrometry in accordance with ISO17025 protocols.
3.3 GPS Tracking
A number of methods of tracking user location were investigated, from using Google
Location histories in mobile phones to custom mobile application development. However, to
ensure consistency in data a wearable GPS tracking device was considered the most
suitable device for the Rosyth Habits Survey. Further details of the system deployed are
described in Appendix D.
3.4 Conduct of the Survey
Preparatory work undertaken before the fieldwork survey entailed discussions with SEPA,
meetings and telephone calls with the BRS staff, on site visits and exploratory observations
around the survey area prior to the commencement of the survey itself. The approach to the
face-to-face surveys is described in more detail in Appendix E. Past survey reports were
reviewed and web-based searches were conducted to ensure as many relevant groups were
identified and captured along with a range of maps to planning for the survey. A large
directory of key groups involved in activities, occupancy and food production and sale in the
area was compiled and used (see Chapter 5 for additional detail) to contact key groups and
individuals in the locality. This included sailing, yachting, motor powered sailing, wild
swimming, rowing, walking, cycling and running groups, social clubs, youth groups and
playgroups within and outwith the area where necessary because some of their members
used the area for recreation and other activities.
28
The team also approached both the Fife local authority, a number of community councils in
the area and employers such as those involved in the construction of the new Forth Bridge.
Some focus groups and informal meetings were arranged prior to the surveys and also
during and after the surveys to gain additional information and fill in any critical gaps that
might emerge in the face-to-face interviews
The nature and timing of the fieldwork survey was discussed with SEPA prior to the start of
the work. The fieldwork was conducted primarily between 29
th
June 2015 and 12
th
July 2015.
A number of follow-up visits were also undertaken in the area.
The survey team that conducted the face-to-face interviews, observations and
measurements totalled 9 people all of whom had received appropriate training and several
had experience from conducting previous surveys. The team were provided with site specific
field manuals developed for the survey.
From the preliminary survey visits and planning, the team of 9 were able to cover multiple
sites at multiple times over the survey period. They interviewed those engaged in a wide
range of activities, some living in close proximity to the BRS and some who consumed local
produce from land or sea. Adults with children and infants were included. Those surveyed
included wild swimmers, kayakers, rowers, yachts people, boat repairers, bridge builders,
emergency workers, café owners, postal staff, community gardeners, allotment keepers,
walkers, professional dog walkers, runners, cyclists and people fishing.
3.5 Meetings, Informal Contacts and Focus Groups
In the 2015 survey, a variety of data were gathered by a variety of approaches. This included
holding a range of meetings with relevant parties and individuals as well as a ‘standard’ face-
to-face interview schedule. The multi-methods approach provided a means to ‘triangulate’
(verify) the data acquired through the different approaches: for example to check occupancy
and activity data against the ‘snapshot’ observations recorded over a limited number of days
in one season acquired from the individual face-to-face interviews. The meetings also
provided some additional information about local produce grown by householders, allotment
owners, horticulturalists and farmers and consumption of particular types of local food such
as honey and game. The information gathered also facilitated some snowballing of the
survey because the individual meetings and focus groups provided additional contacts to
follow-up on. These groups were approached prior to, during and after the face-to-face
interviews by telephone and email.
29
Additionally, prior to and during the survey a directory of local groups, bodies and
organisations relevant to the survey was compiled. The directory proved an invaluable
resource through the survey period both for contacting groups and for use as a checklist
against which responses and non-responses from potentially important groups with regard to
activity, occupancy, exposure and local food consumption could be recorded. For future
surveys, the directory will provide a useful starting point and a means of monitoring any
changes in group/business or other activity in the area. The directory development required
extensive web searches, follow-up telephone calls and use of earlier contacts across
organisations and businesses.
Focus groups and various related informal meetings were also held with groups such as
rowing clubs, community councils, community groups and centres, social clubs, youth
groups and other local organisations and business groups. The information gathered helped
to ensure the face-to-face interviews were relevant, relatively comprehensive and covered all
the key topics necessary. The meetings also supplemented information from the postal
survey and the face-to-face interviews and provided an opportunity to probe in more detail
information or address omissions relating to the face-to-face surveys. Information gleaned
for example related to type of activity or food consumption. This included provision of
information on new developments and location of activities and increase in activities.
3.6 Data Conversion
During the face-to-face interviews data on food consumption were recorded in units provided
by respondents (e.g. pounds, grams, and ounces) and later converted into kilograms per
year. In some cases, respondents were unable to estimate food consumption in kilograms
per year and instead gave the number of plants grown or the length and number of rows,
these data were converted into consumption rates using conversion weights where possible
e.g. one broccoli plant typically yields 700g (Garden Forum Horticulture, 2009; Hessayon,
2014) so that all consumption figures were reported in kilograms per year.
3.7 Data Rounding and Grouping
All data collected from the face-to-face and postal surveys were reported to two significant
figures. For the food consumption data the total annual consumption (kg) of different food
types were calculated by multiplying the quantity (kg) and frequency (times per year). The
food items were placed into groups with similar attributes (Table 3.1) these groups are
similar to those used in previous reports but focussed on the most common food items.
Respondents were given the option to add any additional food items in ‘Other’ food category.

30
Table 3.1 Food Groups used in the Habits Survey
Food
G
roup
Example of
F
oods within this
G
roup
Green Vegetables asparagus, broccoli, brussel sprouts, cabbage, calabrese,
cauliflower, chard, courgettes, herbs, kale, lettuce, marrow, spinach,
broad bean, french bean, pea, kohi rabi, pepper, runner bean,
sweetcorn
Root Vegetables beetroot, carrot, celery, fennel, garlic, jerusalem artichoke, leek,
onion, parsnip, radish, shallot, spring onion, swede, turnip
Potato potato
Domestic Fruit apple, blackberry, blackcurrant, blueberries, cucumber, gooseberry,
grape, pear, plum, raspberry, redcurrant, strawberry, tayberry,
tomato
Milk milk, yoghurt, cheese
Cattle Meat beef, buffalo
Pig Meat pork
Sheep Meat lamb, mutton
Poultry chicken, turkey, goose
Eggs hens’ eggs
Wild/Free Foods apple, blackberry, garlic, elderflower, cherries, meddlers,
mushrooms, raspberry, sloe berries
Honey honey
Game pheasant, wild venison
Fish bass, cod, mackerel, pollock, salmon
Crustaceans brown crab, common lobster
Molluscs winkle, mussels
Wild fowl mallard, pink-footed goose, teal, wigeon
The time respondents spent carrying out activities was calculated by multiplying frequency
(occasions per year) and duration (hours) taking into account seasonality where appropriate.
In addition to food consumption a ‘liquid’ category was also added and respondents who
carried out aquatic activities that could result in the inadvertent ingestion of water, e.g.
outdoor swimming/sailing, were identified to account for this pathway.

31
The age groupings used in this report are based on International Commission of
Radiological Protection (ICRP) recommendations and are listed below in Table 3.2.
Table 3.2 ICRP age groups used in the dose assessment
Name of age group Age range
Group 1 0-5 year old
Group 2 6-15 year old
Group 3
16 year old and over
3.8 Qualitative and Quantitative Observation
Whilst undertaking the face-to-face surveys, observational data were acquired on obvious
changes to each location such as new build housing, along with information on site usage
and numbers of individuals undertaking specific habits. Observations were acquired over a
specified time period, e.g. 20 minutes, and on-shore and offshore (including intertidal)
activities were noted. The number of individuals, their gender and their approximate age
group undertaking each activity were also noted or estimated where large numbers were
observed, e.g. beach activities. Some individuals were approached where possible and
subsequent face-to-face surveys were conducted. Contact with individuals during face-to-
face interviews frequently allowed the accuracy of observations to be checked and
sometimes to be expanded: for example dog walkers might also engage in beachcombing
and sailing at other times. Along with noting the weather conditions at the time of survey, this
approach provided a basis for making a comparison of habits at different times and within
and outwith the period of the local school holidays.
3.9 Dose Assessment Tool
The Habits Dose Assessment Spreadsheet Tool collates the data from the face-to-face
survey in Rosyth and then used the consumption rates and habits data to calculate the
retrospective dose to each interviewed member of the public, covering the total exposure
from all pathways. It should be noted that only the consumption of locally produced food has
been included in the retrospective dose assessment. Dose assessment was carried out
following the guidance in NDAWG and ICRP for the Representative Person.
Activity concentration values came from modelling Rosyth discharges for 2013 using the
default settings in PC CREAM 08 (PHE, 2008) and measurements of samples collected in
the field. Dose coefficients for different age groups are described by ICRP (2012). As
32
described in Section 3.7, data for the 2015 Rosyth Habits Survey were collected in three age
groups (Table 3.2). The dose conversion coefficients (DCCs) for each age group were taken
from ICRP: Group 1 - infants; Group 2 - 10 year olds; and Group 3 - adults.
The tool analyses four general exposure pathways:
(i) Internal terrestrial, which includes the consumption of locally produced meat, fruit and
vegetables;
(ii) External terrestrial, which determines the external doses from exposure to radiation
present in the terrestrial environment as a result of deposition from atmospheric
discharges and direct exposure through shine from on-site activities with radioactive
materials;
(iii) Internal aquatic, which includes ingestion of fish, crustaceans, molluscs and
inadvertent consumption of seawater. A proxy for inadvertent drinking of water was
calculated by multiplying the time spent on aquatic activities by the known average of
water ingested in such activities as described in Leonard et al. (2014), McBride
(2012) and Stone et al. (2008); and
(iv) External aquatic, which estimates the dose from external exposure through aquatic
activities, e.g. from radionuclides present in the aquatic environment (in water and
sediments in saltmarshes or intertidal areas).
The direct exposure to shine in publically accessible areas to on-site activities was included
in the analysis using in-situ measurements.
The representative person was calculated independently for the total exposure and then by
each exposure pathway. To identify the representative person, the 97.5 percentile rate cut
off method was applied (see Chapter 1). The representative person was calculated
separately for external terrestrial and external marine exposure, internal terrestrial and
internal marine consumption related exposure. The combined calculated total integrated all
routes of exposure. In cases when the representative person (i.e. between the 93 and 97.5
percentile) was not found by the survey, the tool calculated a hypothetical representative
person. The report therefore details both the hypothetical representative person and the
most exposed person(s) found for that pathway during the survey.
33
4 Survey Site Introduction
4.1 Introduction
The survey locations were established from the analysis presented in Chapter 2 and to
provide consistency with the previous Rosyth Habits Survey undertaken in 2010. The sites
were visited throughout the survey period and selected where possible to be revisited before
and during the local school holiday period. Offshore and onshore observations were
undertaken at each site. Each site was visited for varying lengths of time according to the
survey schedule, site activity and proximity to the BRS.
4.2 Survey Area Descriptions
The terrestrial/aquatic survey area (shown in Figure 2.1) covered a stretch of the Firth of
Forth and its intertidal areas - the northern shore stretched from Kincardine to Kinghorn and
the southern shore stretched from Bo’ness to Newhaven. The survey site was extended to
accommodate areas outwith the concentrated survey area from the BRS. Preliminary visits
showed little commercial or hobby fishing. The survey is reported from west to east starting
on the northern shore with the most western area visited being Kincardine. The southern
shore is also reported from west to east with the most western area visited being Bo’ness.
Many sites reported the presence of mudflats and bait diggers which would be expected
given the estuary’s SSSI designation and classification under the NATURA 2000 regulations.
On the northern shore the entire survey reported the extensive use of the Fife Coastal Path
which runs along the coast of the survey area. This was extended to start in Kincardine in
2011 therefore a change from the previous survey in 2010 with a possible increase of people
walking the full length. The region is well served by the East Coast Railway from
Inverkeithing to Dundee.
For both the northern shoreline and southern shoreline, the observation descriptions are
described in survey locations starting from the west to east.
4.3 Site Descriptions for the Firth of Forth Northern Shore
4.3.1 Kincardine
The most western point on the northern shore of the survey area was Kincardine (Figure
4.1). Observations were made at this site but no face-to-face interviews were undertaken.
The area observed was by the shore with the coastal path running alongside and scrub
woodland behind to the north. The Fife Coastal Path was extended to Kincardine with the

34
development of the new Kincardine Bridge in 2011 and now connects Kincardine to Culross
without the need for extensive use of the road network. The coastal path moves away from
the coast as it passes the Longannet coal fired power station before returning to the coast at
Culross. No onshore habits were observed other than the occasional walker. Offshore there
were three boats moored, one fishing boat and five paddleboats to the west of the
Kincardine Bridge.
Figure 4.1 View to the south towards Kincardine Bridge from Kincardine
4.3.2 Culross
Culross is a popular tourist area with a number of attractions. On the sea front (Figure 4.2)
access to the beach and jetty is available to foot traffic via the level crossing with the stone
railway embankment forming the sea wall. The railway line from Inverkeithing lies between
the shore and Culross itself. There are two large car parks both east and west to the main
35
village area. There was a range of onshore activities which included dog walking, walking,
cycling, jogging, tourists, families’ with children playing at the park, children playing football
in the green park space and people walking along the beach and beach combing. Tourists
from outwith the survey area made up the majority of people with numbers visiting the area
approximately in excess of 20, 60 and 100 per day when visited during the survey period.
The onshore activities noted were all during the local school holiday period, no activities
were noted outwith (Appendix H). Two sailing boats and a rowing boat were moored offshore
and at some distance offshore a commercial ship, a leisure boat and a sail boat were
observed during the survey period. The lower shore substrate was that of mud and stone. A
disused jetty was also noted.
Figure 4.2 View to the East along the coast at Culross from Culross
4.3.3 Preston Island, Torry Bay and Crombie Point
Torry Bay is a small village overlooking the Firth of Forth and to the west is Preston Island
which forms a promontory between Culross and Torry Bay. A children’s playground area is
situated directly behind the shore separated only by the coastal path (Figure 4.3). A new
36
housing development overlooks the bay with building plots for sale. A public car parking area
is situated by Torry Burn.
During the survey period this site reported relatively low occupancy with three dog walkers,
one cyclist, one walker and two families playing in the playground by the shore observed
when visited during the survey period. No children or families were playing in the playground
outwith the local school holidays (Appendix H). As would be expected from villages close to
Edinburgh a steady stream of commuting traffic was noted. On the south side of the Forth
one boat was observed with two people on it and two boats were moored. The shore area at
low tide reveals a large area of mud and large boulders. Torry Bay forms part of the
designated nature reserve which has areas of salt marsh formed from artificial lagoons built
from ash from the Longannet Power Station. The reserve forms part of the larger area
between Longannet Point and Crombie Point and has an intertidal substrate of mud flats.
This area is home to overwintering birds. Torry Bay is an area where wildfowling is permitted
but no wildfowlers were identified during the survey period.
Figure 4.3 View towards the east at Torry Bay from Torry Bay
Eastwards from Torry Bay there is access to the shore at Crombie Point. Although the area
is largely woodland there are around ten residential houses looking south over the Firth of
37
Forth with cycle paths and agricultural land noted in the surrounding area. The beach area
was mainly sand and mud and the people observed included five dog walkers, one walker,
one person jogging and several people paddling. There were in excess of 60 people playing
on the beach noted during the local school holiday period in contrast to solely dog walkers,
cyclists and walkers outwith the school holiday period. Access eastwards along the shore is
prevented by the MoD base, RNAD Crombie, with the Fife Coastal Path re-joining the coast
at Charlestown.
4.3.4 Charlestown
Along the coastline eastwards, between Charlestown to Limekilns, there were several small
bays made up of sand, mud and pebbles. Rocky outcrops were also noted. There is a small
harbour in Charlestown (Figure 4.4) with over 30 boats and three sail boats moored within
the harbour. No activities offshore with boats were noted either outwith or during the local
school holiday period (Appendix H). At the time of survey he was working on his boat and
continued to spend a large amount of time there. The boats moored were all observed to sit
on the mud substrate when the tide went out. Onshore beside the harbour one person was
observed undertaking boat maintenance. Other onshore activities consisted of dog walking,
walking and people working in their gardens in the nearby residential area. During the school
holiday period several children were observed playing and walkers and dog walker numbers
increased from four outwith the holiday period to 10 within the holiday period.
38
Figure 4.4 Charlestown Harbour
4.3.5 Limekilns
Limekilns is a small coastal town with several shops, pubs and restaurant/bistro. There is a
small marina with a boat club, The Forth Cruising Club, which has around 90 members
whose aquatic activity is predominantly sailing. The Forth Cruising Club has approximately
60 boats which are mainly 17 to 35 feet in length together with a few sailing dinghies. The
majority of the boats are moored at Brucehaven Harbour (Figure 4.5) and Limekilns Pier
during the sailing season but some are moored outwith Limekilns in other clubs on the Forth.
Activities observed on the beach were a mixture of families playing and paddling, dog
walkers, people sitting on the beach, picnickers and a family playing football. Numbers of
individuals varied with these activities during and outwith the local school holiday period with
walking and dog walking attributing to the most popular activity (Appendix H). The substrate
was sand and rocks with one person observed to be bait digging.
Offshore there were more than 10 sail boats moored with only one boat under sail.
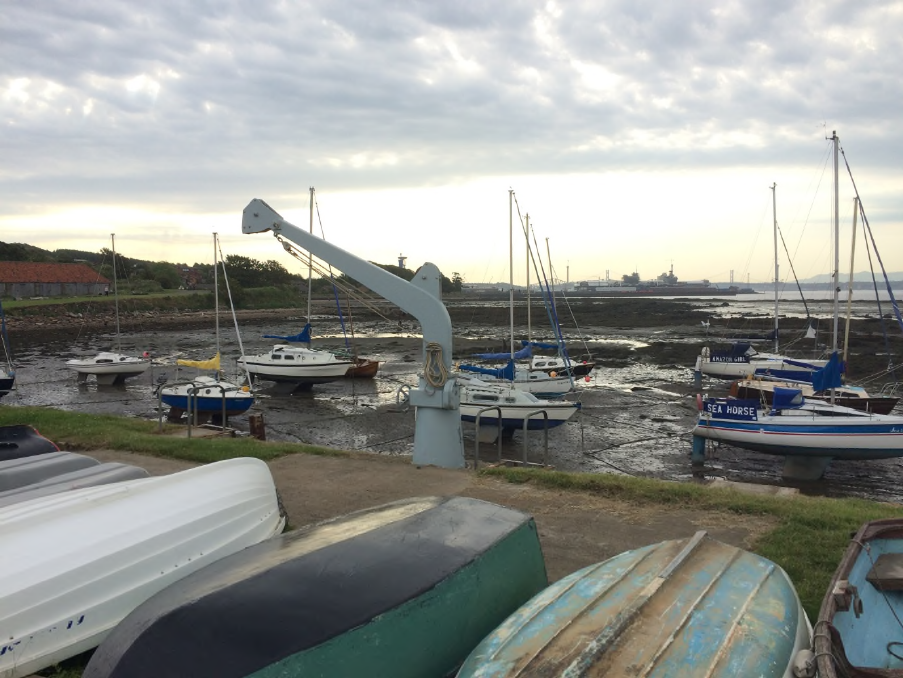
39
Figure 4.5 Brucehaven Harbour, Limekilns
4.3.6 Rosyth
The BRS was part of the survey area. A large part of the surrounding area of shore was
occupied by the BRS preventing access by the public to this area of the shore. Adjacent to
the BRS is a commercial port which houses a ferry terminal.
Activities noted at the entrance to the BRS were cars and delivery vehicles travelling in and
out of the site, people walking, security men checking cars and people walking to and from
work.
Rosyth itself is part of a waterfront regeneration scheme. A recent proposal, which is
currently out to public consultation, aims to provide both residential and commercial
development in the area.
Further detail of the BRS is discussed in Section 2.1.
40
4.3.7 North Queensferry
North Queensferry (Figure 4.6) is a small town situated beneath the Forth Bridge and is the
most southerly site on the northern shore of the survey area. The shoreline along this area
from the slipway in the town to the North Queensferry Harbour is mainly large boulders on
the upper shore and rocks, mud and seaweed towards the lower shore. The slipway in town
provided public access to boats giving adventure trips together with the possibility of
launching and recovery of small vessels. Within the shore area of the town the activities
noted were two people dog walking, in excess of 20 people sightseeing, two photographers,
walkers and a family of five picnicking on the slipway. There is an active community garden
in North Queensferry and this is discussed in Section 6.7.1. Two sailboats and a sea kayak
were noted offshore.
West of the main town is the harbour in which the North Queensferry Boat Club is located. It
has approximately 100 members with moorings available to boats with keels that can sit on
the mud at low tide. A small pontoon is also available. Boats affiliated with the club are
mainly sailing yachts. Several boats were moored but a large number of boats were
observed to be in the boat yard. Several people used the shoreline just on the west side of
the entrance into the harbour for dog walking. One person was observed fishing from the
pier within the harbour and six people were working on their boats. Offshore activities noted
from the harbour were sailing yachts, kayaks and a leisure boat.
Extensive construction operations are underway due to the building of the new Forth Road
Bridge (with lottery funding being approved to develop a Forth Bridge Visitors Centre) which
is due to open in 2016. Further details of the Forth Road Bridge are discussed in Chapter 2.
Deep Sea World in North Queensferry is a visitor centre that attracts many people to the
area.
No observations were undertaken for this site outwith the local school holiday period
(Appendix H).
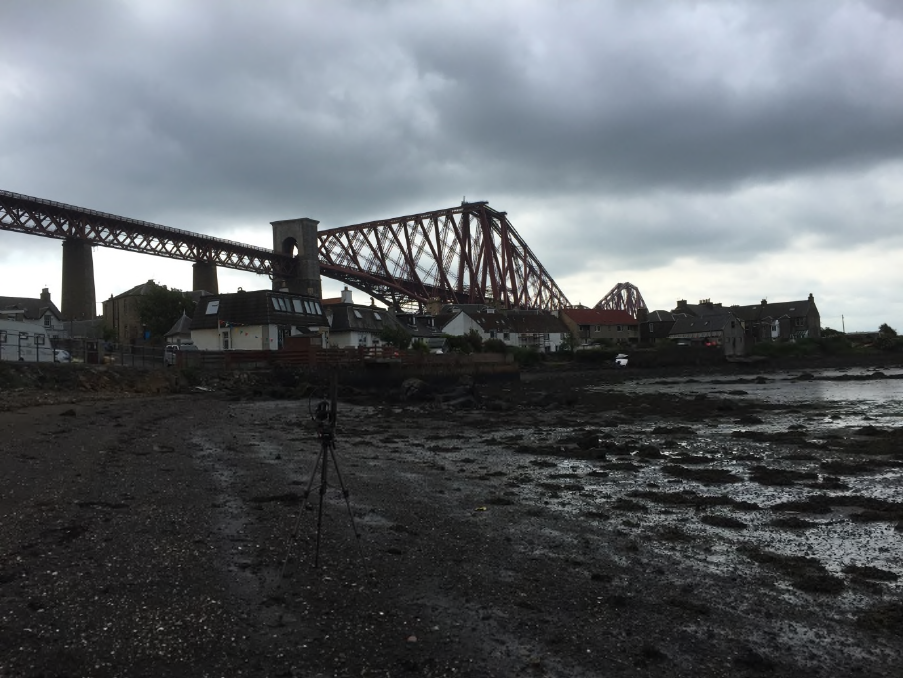
41
Figure 4.6 View towards the South towards the Forth Bridge at North Queensferry
4.3.8 Inverkeithing
Inverkeithing is a developing town and attracts visitors due to its historical interest. It is
bypassed by the M90 which links Fife, south of the Firth of Forth, via the Forth Road Bridge.
There is also a rail link to Edinburgh and Dundee. Many people that work at the nearby the
BRS find accommodation here resulting in the town population being that of locals and
transient workers.
The town has a well organised community garden with some core workers identified and
other volunteers. Further information is discussed in Section 6.7.1. Activities noted in town
were mainly that of people shopping and socialising. Inverkeithing has a small inlet revealing
a mud substrate at low tide. This particular area appeared relatively run down with a large
derelict expanse to the west of the inlet area. One person was observed fishing from the inlet
during the survey period. In April this year several members of the Inverkeithing Boat Club
attended a community council meeting with Fife Council. Fife Council proposed the club
formally register as a community boat club. The club is in the process of cleaning up the
area and plan to provide ‘member’ details and to register as a club. A large green space
42
west of the inlet was popular with approximately 20 people dog walking, in excess of 15
families playing at the park, three people cycling, five people jogging and in excess of 40
people walking. Limited intertidal access was noted from here via a steep embankment. No
observations were noted at this site outwith the local school holiday period (Appendix H).
Offshore activities observed were a large cruise liner towards North Queensferry, a gravel
cargo ship resting on the mud and some sail boats were moored along with three rowing
boats.
4.3.9 St David’s Harbour and Dalgety Bay
Access to St David’s Bay is via a coastal path and there are also large sea defence boulders
along the shoreline which people were observed climbing over too, gaining access to the
bay. The bay itself is sandy. This bay was to the west of St David’s Harbour which appeared
to be disused.
Onshore observations at St David’s Bay were 10 people dog walking along the coastal paths
and the steep embankment, one family (two adults and one child) playing and digging in the
sand on the beach and two people sitting in their car eating lunch and enjoying the view.
Offshore activities were one windsurfer and six sailing boats some distance offshore.
Observations were made within the local school holiday period (Appendix H).
Dalgety Bay lies on the north shore of the Firth of Forth eastwards from St Davids Bay. The
bay itself lies to the south east of Dalgety Bay town. The town was developed in the 1960’s
and 1970’s. Prior to the creation of the new town the area hosted a MoD airbase, RNAS
Donibristle, which closed in 1959. The current Donibristile Industrial Park was developed
over much of the runway of the former air base.
On the beach (Figure 4.7) at Dalgety Bay, since 1990, radioactive items which contain
radium-226 and associated daughter products have been detected. The historical disposal of
radioactive wastes together with other wastes from the Royal Naval Air Station, Donibristle,
is the cause of this contamination. It has been reported by SEPA that during the operation of
the site and clearance the coastline advanced in a southerly direction, such advancement
was caused by the disposal of incinerated waste and resultant ash and clinker onto the
foreshore. Coastal erosion of this site has now exposed the contamination on and adjacent
to the foreshore. Due to the magnitude of the contamination found and its potential effects
on public health, if encountered, public protection measures have been established and
people are advised not to remove material from the beach and to avoid one area of the
beach entirely. Currently the area is monitored on a monthly basis by a contractor working
43
for the MoD. The contractor was observed to be undertaking this monitoring during the
survey.
Dalgety Bay has an active sailing club with direct access to the foreshore with two slipways
and a jetty. The main craft are sail dinghies and keel boats. Safety Boats are also used. The
sailing club operates a Royal Yachting Association Recognised Teaching Establishment
which house 27 dinghies for this purpose. To the west is a sandy harbour with one boat
moored on the sand. In contrast to this sand, the area in front of the Sailing Club and to the
east of the Club (forming part of the contaminated area) is rock and shingle with obvious
artefacts from site clearance (crockery, brick, etc.). The lower shore substrate was mud.
Warning signs are visible indicating the presence of radioactive contamination both on
approach to the club and to the east and west. A Food and Environment Protection Act ban
is also in place for Dalgety Bay preventing the commercial harvesting of fish and shellfish
due to the radioactive contamination in the sediment. The area behind the foreshore forms
part of the coastal path and is wooded and grassy. Activities noted on the coastal path area
were predominantly dog walking (in excess of 20) and walking (in excess of 20) with some
people picnicking, cycling and jogging. Three tents were set up in front of the sailing club
lodge. No people were noted to be engaged in any intertidal activities. One individual
interviewed collected and consumed whelks along the foreshore of Dalgety Bay. Offshore
one oil tanker was noted at the Forth Bridge Terminal, one tanker off the terminal port at
Braefoot Bay, one tanker off of Hound Point and a further one oil tanker with support
vessels. Three cruise liners, three tug boats, small boats ferrying passengers to and from
shore and 19 sailing yachts along with three power boats were moored to buoys.
No evidence of significant land use change was noted in the area. It was noted that there
was a proposal for a further housing development to the east of the town.

44
Figure 4.7 View towards the East at Dalgety Bay
4.3.10 Aberdour
Aberdour is a small village on the south coast of Fife looking south to the island of Inchcolm
which is a popular tourist attraction. It is a village that attracts visitors with one coach noted
and several visitor attractions including a Castle with in excess of 50 visitors at the time of
the survey and local shops. During the time of the survey together with five people were
noted walking and five people cycling on the nearby cycle route. There is a railway station
which connects the village eastward towards Dundee and west towards Inverkeithing.
Aberdour is situated between the larger conurbations of Burntisland to the east and Dalgety
Bay to the west.
Aberdour is home to the Aberdour Boat Club and is situated on the northern shore of the
Firth of Forth. Founded in 1930 it provides a range of boating activities including canoes,
rowing, power boats and sailing. An active racing and cruising programme is also available.
The club has a current membership of over 100 members and the club is affiliated to both
the Royal Yachting Association and the Forth Yacht Clubs Association. The harbour has a
stone pier and large rocks on the upper shore with a small sandy beach.
45
4.3.11 Silversands
Silversands is a small sandy leisure beach situated to the east of Aberdour on the northern
shore of the Firth of Forth. It has a rocky promontory to the west separating Aberdour
Harbour from Silversands beach. It is a very popular beach with lifeguards patrolling the
beach during the peak summer season. Silversands is a Blue Flag beach and has a Green
Coast Award. The sandy bay is approximately 600 metres long with the beach sloping gently
towards the water. Fife Council maintains the site.
The Fife Coastal Path and the Millenium Cycleways Network pass by this beach and the
surrounding area. Tourist and visitor facilities observed during the survey were a beachfront
café, toilets and outdoor shower area, a first aid point, children’s play park and crazy golf. A
slipway allows the launching and recovery of small craft.
Activities observed during the survey period were families playing and paddling at the beach,
families with children digging in the sand, one person jogging, dog walking, dogs paddling,
beachcombing, three families having a barbeque and families playing at the park and crazy
golf. Silversands beach is a dog friendly beach and only has dog restrictions on the main
sandy area during the summer season.
On one particular day at Silversands approximately 500 people were observed at the beach
along with 20 people swimming and paddling, one fishing boat, one leisure boat and one
commercial boat some distance from the shore. Body boarding and sailboarding were also
observed. Open water swimming has increased in popularity at Silversands and swimmers
are reported to swim daily in the sea for pleasure as a leisure pursuit and also for training for
open water competitions. The bay itself provides some safety from the currents. Despite this
reported increase of the open water-swimming hobby, no open water swimmers were
observed during the survey period.
The beach backs onto woodland with a very large green space behind the café area
providing ample space for parking.
All observations for this site were undertaken during the local school holiday period
(Appendix H).

46
4.3.12 Burntisland
Burntisland is a coastal resort on the Firth of Forth to the east of Silversands. The town has
a popular 18 hole golf course, bowling green and leisure centre with swimming pool. Behind
the beach promenade on a large grassy expanse a fair ground is set up for the summer
period which attracts many visitors and locals. Burntisland beach (Figure 4.8) is a sandy
Blue Flag beach with a promenade providing benches for sitting, a large car park, leisure
centre and swimming pool, café and restaurant, dive boat centre, slipway and lifeguard
station. The slipway can be used by the public for small leisure crafts and dive boats. The
beach is fine sand with patches of black coal dust, which is present from layers of coal
outcropping from the sea bed being washed onshore (SNH, Beaches of Fife, 1978).
Figure 4.8 View towards the north towards Burntisland
Aquatic activities observed were five people paddling and swimming, one open water
swimmer, five leisure sail boats, four dive boats landing and one bait digger. Twelve people
(mainly children) were observed walking out onto the mud near the rocky promontory to the
east. At low tide mud and sand flats are visible on the lower part of the beach.
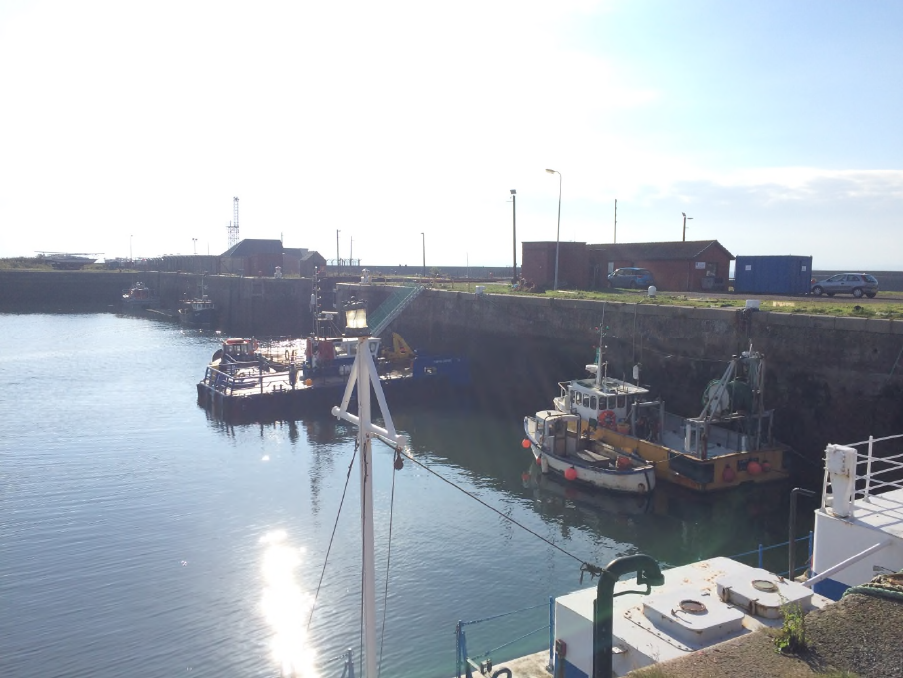
47
Onshore activities observed within the survey period were mainly people at the funfair,
families sitting on benches and playing on the beach and rocks, building sandcastles, beach
combing, dog walking, people out walking, one photographer, cycling and fishing. Persons
were also observed to be excercising other animals on the beach. No observations were
made outwith the local school holidays (Appendix H).
Continuing eastwards from Burntisland beach the rocky stretch of shore extends to the
Burntisland docks. The Port of Burntisland is made up of two inner basins – the east dock
with an adjoining west dock. The dockyard has experienced a revival from coastal shipping
and also opportunities within the offshore renewable sector with the west dock housing two
major employers. Creeling is still undertaken at Burntisland. The outer harbour is occupied
by the Burntisland Sailing Club on the Firth of Forth. The club has 25 moorings accessible in
all tides and is situated within the south eastern corner of the outer harbour (Figure 4.9). It
holds a compound for winter storage for boats and boating equipment.
Burntisland railway station is situated beside the harbour.
Figure 4.9 Burntisland Harbour
48
4.3.13 Kinghorn Harbour Beach and Pettycur
Kinghorn Harbour beach is a small sandy beach with large rocky outcrops to the east and
west of the sandy area. It was a very popular small beach and activities noted were dog
walking, walking and playing on the beach, one person fishing from beach, one
photographer, and two people bait digging. Offshore Habits noted were two people paddle
boarding, sailing, fishing, maintenance supply oilrigs, commercial shipping and container
ships. There is a small parking area beside the harbour and several boats were seen to be
moored.
The residential area consisted of houses, a small café and shop and the Kinghorn Lifeboat
Station which is an RNLI funded and operated rescue station. One person and a child were
fishing from the rocks at the west side of the beach. A steep embankment to the eastern
promontory had benches and two people were bird/nature watching.
To the east from Kinghorn Harbour is Pettycur beach (Figure 4.10) which is a sandy beach
between high rocky promontories to both the east and the west. This little harbour was very
popular with fishermen with approximately 14 huts (Figure 4.11) present to store fishing
equipment, seven fishing boats and six rowing boats moored. Several people were
interviewed at this site who fished and creeling was also undertaken. The lobster and crab
caught were sold outwith the survey area. One person was observed bait digging for lug
worms, rag worms and white sand worms. Several people were seen fishing from the shore
and indicated that this was a regular activity. Other onshore activities observed were five dog
walkers, several families out walking and three people were observed kite boarding at low
tide to the east of the eastern rocky promontory.
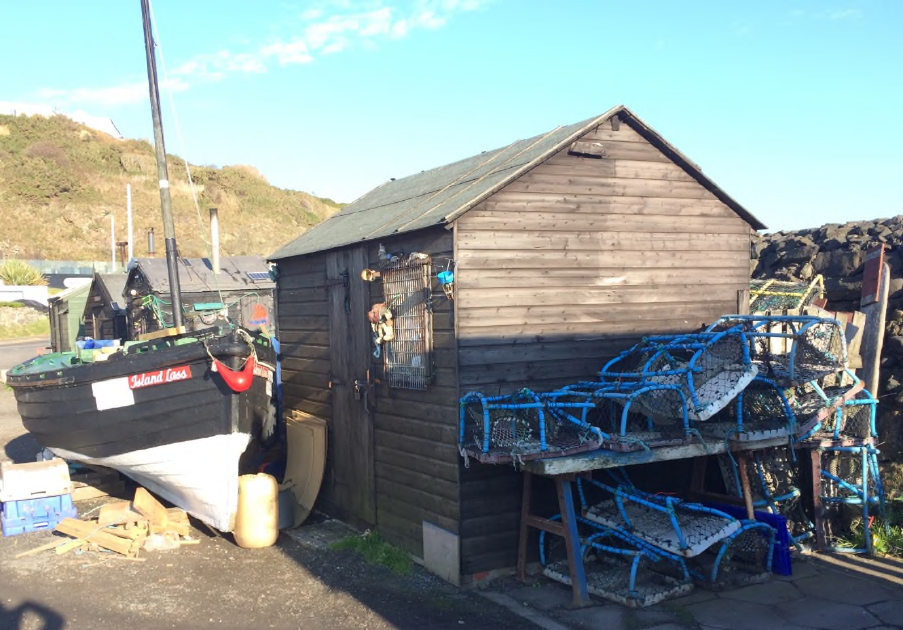
49
Figure 4.11 Fishing hut, Pettycur
One person was particularly interested in the local history of Pettycur and had noticed for
some time that as a result of the tides and weather some rocky outcrops have become
apparent in the centre of the beach towards the beach wall. It was reported that this slow
erosion was thought to be uncovering the old Pettycur Harbour and is currently under
investigation by the Scottish Coastal Archaeology and the Problem of Erosion (SCAPE).
A road runs alongside the beach with its high beach wall and a small café and shop are
situated towards the eastern end.
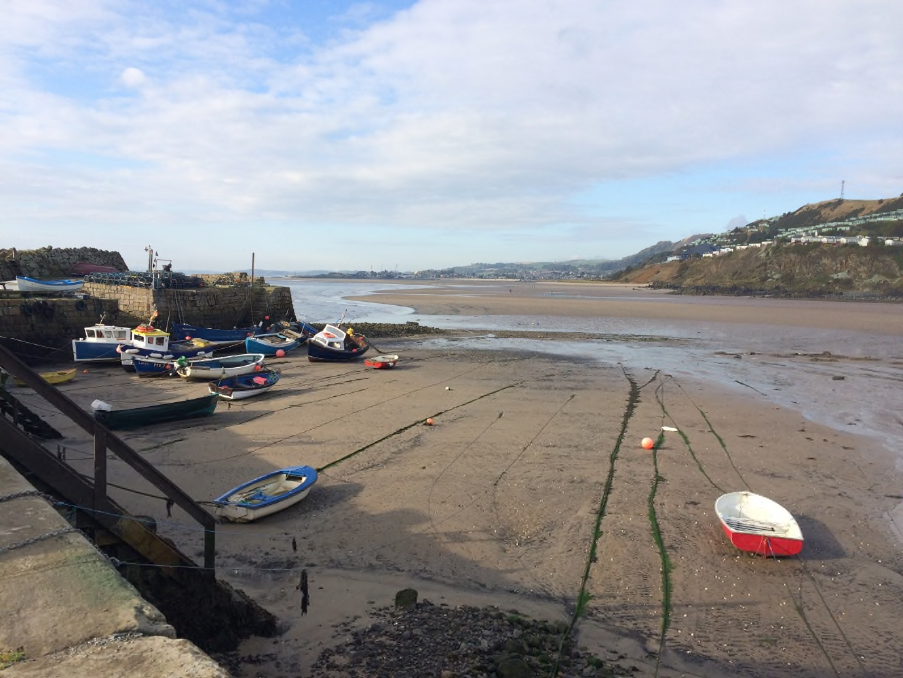
50
Figure 4.10 View towards the west at Pettycur
4.4 Site Descriptions for the Firth of Forth Southern Shore
4.4.1 Bo’ness
Bo’ness lies on the south bank of the River Forth and the beach tidal area, easily accessed
from several locations, is composed of sand, pebbles and mud. Onshore habit observations
throughout the survey period included people on pathed areas and at designated benched
areas. The onshore habits behind the shoreline included people out for walks, dog walking,
sitting picnicking, sitting reading, cycling and jogging. Outwith the school holidays
approximately four dog walkers were observed and this number increased significantly within
the school holidays on one day to 12 dog walkers, 15 walkers and two cyclists. It was
generally noted that the number of individuals increased with onshore activities during the
school holiday period (Appendix H). No habits were noted on the intertidal area (Figure
4.11). Four people were observed fishing from the wall of the harbour. Four sailing boats
were the only offshore habits observed.
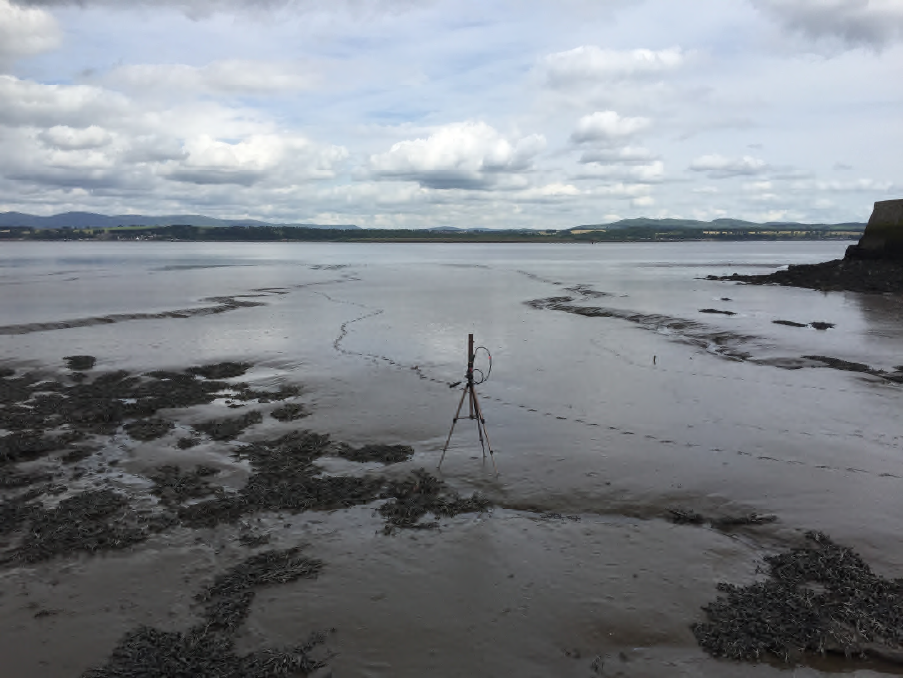
51
The Bo’ness and Kinneil Railway runs alongside the Firth of Forth and is a very popular
tourist attraction to the area.
The Upper Forth Boat Club is based in the Grangepans area of Bo’ness with the bay having
swinging moorings being the property of individual members. Hard standing provides
storage for approximately 30 boats. Shore-side facilities consist of a launching system, de-
masting derrick, gantry and work shop.
Figure 4.11 View towards the north from Bo’ness
4.4.2 Carriden
Carriden beach is a mud, sand and pebble beach which has two small boat yards and
sewage treatment works to the rear. The coastal path, which forms part of the John Muir
Way passes by the beach with a children’s play park nearby. Carriden Boat Yard is primarily
a storage facility for boats situated on the south bank of the Forth Estuary.
There were a number of children observed playing in the park outwith the school holiday
period and this increased for families and individuals to 10 walkers, five dog walkers, seven
cyclists and four picnickers during the local school holiday period (Appendix H). Several
scrambling bikes were observed in the woods behind the sewage works. Potential offshore
52
habits were indicated with the presence of three boats moored but unattended together with
seven launch and motor boats on the water. Locals reported that people fish for their own
consumption from this area off the pier although none were identified during the survey
period.
The coastal path leads from here eastwards towards Blackness. Some of this coastal path is
currently being repaired and a new path being made due to coastal erosion.
4.4.3 Blackness
Blackness village (Figure 4.12) is close to Blackness Castle. There is a large grassy
expanse and the John Muir Way provides ready access for walkers and cyclists. Onshore,
people were observed to be dog walking, walking, cycling, picnicking, playing on the beach,
having a barbeque, people sitting on boats onshore and beach combing. Numbers of
individuals undertaking onshore activities were generally similar outwith and during the
school holidays (Appendix H). Habits noted offshore were people on boats, 17 sail boats
under sail and five boats in the harbour. This was within the local school holidays in contrast
with only one boat sailing observed outwith the local school holidays. The substrate was
mainly of mud flats on the lower shore with a mixture of stone, sand and mud in the upper
shore. It was reported that people undertake metal detecting, bait digging and collecting sea
coal within the intertidal area.

53
Figure 4.12 View towards the west at Blackness
Blackness Boat Club is affiliated to both the Royal Yachting Association and the Forth Yacht
Clubs Association and has a membership of over 60. The club caters for canoes, rowing,
power boats and sailing. Members tend to be mainly interested in day sailing and cruising
and occasionally club races. Swinging moorings are used for boats out in the bay and a pier
is available to be used for short stay. Winter storage is also available.
4.4.4 Society Point
Society Point was visited during the survey period and was observed to have a beach area
with Hopetoun House to the West. Close to Hopetoun House cars were parked and on the
nearby beach area one family were observed to be playing. Four people were playing on the
beach, two people were beach combing, two dog walkers and one photographer was
observed. Several cyclists were also observed to pass by the beach.
Offshore habits observed were a cargo ship passing by the BRS to the north over the Firth of
Forth, a bridge support vessel and two speedboats. A Marine Conservation Society beach
and litter clean-up had been undertaken over the summer.
54
4.4.5 Port Edgar and South Queensferry
Port Edgar is primarily a large marina with business being dominated with boating services,
sales, supplies and training for the Royal Yacht Association. Restaurants, pubs, cruise/ferry
stop and lifeboat services were also present. The marina is located between the Forth Road
Bridge and the Rail Bridge and is host to a slipway with approximately 300 berths with sail
and motor boats moored. The marina (Figure 4.13) is the base for a rowing club, a yacht
club and a paddlers club that was established in 2011. Port Edgar Marina is also home to
organisations such as the Sea Cadets, HMS coastguard and Port Edgar Watersports Activity
School which provide a wide range of watersports including dinghy sailing, powerboating,
sea kayaking and canoeing. There is evidence of creeling being undertaken.
Onshore, the immediate town of Port Edgar, South Queensferry, was extremely busy and
very popular with tourists. Tourist buses were present waiting for ferries. A high proportion of
visitors were families and tourists with well in excess of 1000 people on three occasions
during the survey period, dominated by tourists from cruise ships and coaches using the car
parks as drop off points. Photographers and a bagpipe band were also observed.
Offshore activities observed consisted of sail boats, speed boat, ferry cruise boats, a large
cruise ship docked, small tug boats, tourist boats, sailing dinghies, sailing boats, sail boards,
yachts, boats working on the Forth Bridge crossing. South Queensferry also has a Lifeboat
Station.
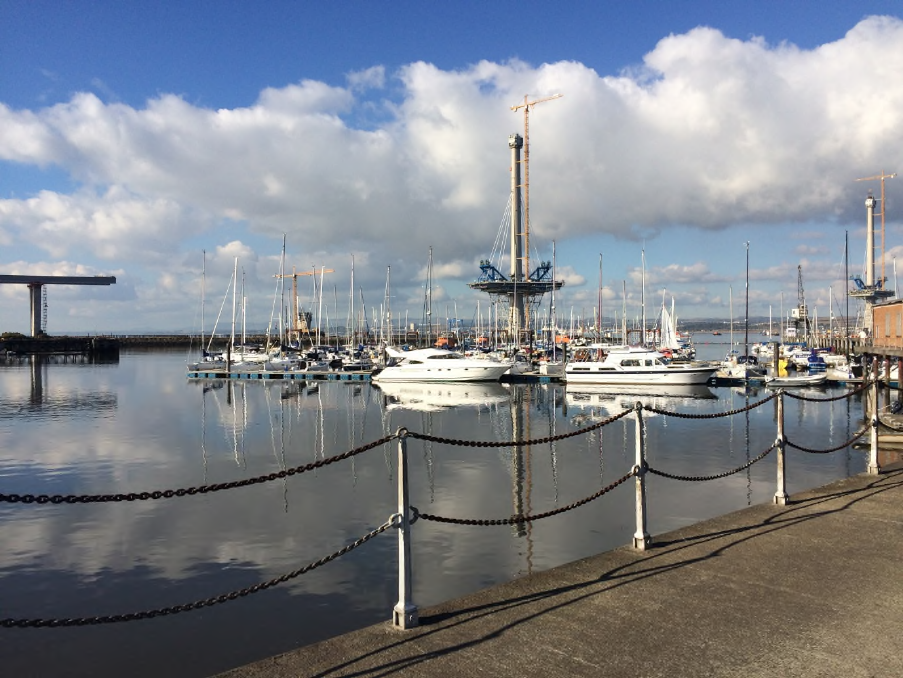
55
Figure 4.13 Port Edgar Marina
4.4.6 Hound Point
Hound Point is a headland on the Dalmeny Estate which gives public access (there is no
formal right of way) to the shore. The area of beach surveyed at Hound Point was part of the
coastal walk which provided a pier and a boat house. It was a relatively popular area with
onshore activities and seven cyclists, 11 dog walkers, 49 walkers and three people
picnicking were observed. Numbers of individuals present daily were relatively similar during
and outwith the local school holiday period. Three people had a campfire and several people
were sitting on the beach. Four people were observed to be fishing from the pier.
Offshore activities included commercial ships and tug boats, work boats operating, cruise
ship, four jet skis and seven sail boats. Eight sailing boats and dinghies were moored. All
these offshore activities took place during the local school holiday period (Appendix H).
Hound Point also has an offshore tanker berth and oil handling facility which is operated by
BP in conjunction with Forth Ports Plc.
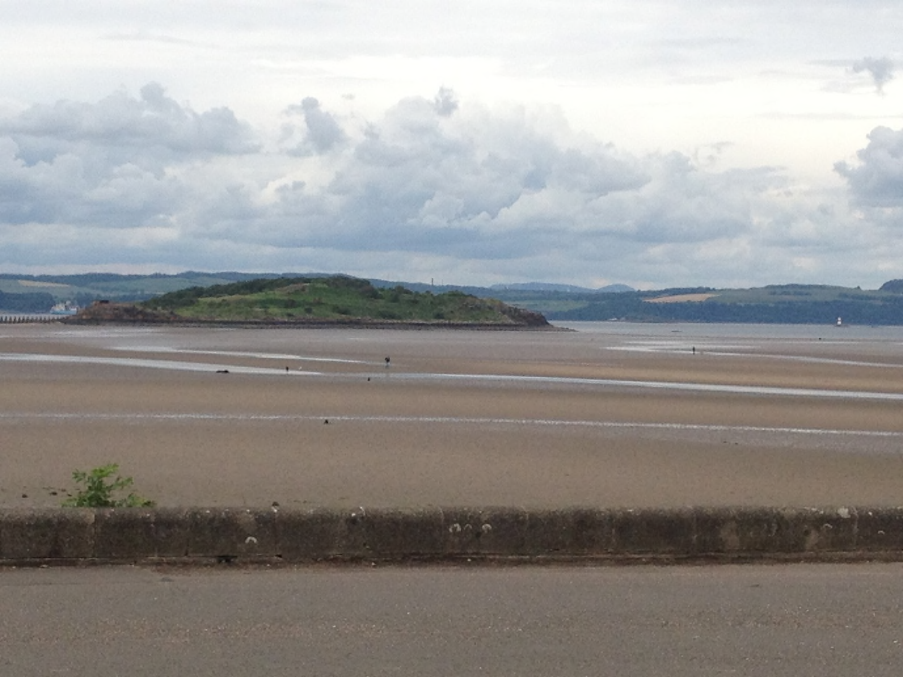
56
4.4.7 Cramond
Cramond village is located towards the east of the River Almond with a sandy beach and
coastal path. A small café was nearby with restaurant and pubs in the village
Cramond Island is a small tidal island on the Firth of Forth approximately 1.6 km offshore
with a rocky shoreline. It is connected to the mainland at low tide across the Drum Sands.
The causeway between Cramond Island and Cramond village exposes a paved path at low
tide. On the southern shore of the Firth of Forth Drum Sands is an extensive tidal area of
sand. Drum Sands extends from Hound Point to Granton in the east. The sandflats within
this area are of international importance and host to thousands of breeding and roosting
waders and winter wildfowl.
Figure 4.14 View north towards Cramond Island
The main onshore activities within Cramond and Cramond Island (Figure 4.14) were dog
walkers, cyclists and joggers but one person fishing off the rocks and one person
beachcombing were also observed. Two people were also camping on the island. The beach
area has a slipway which was being jet washed by boat club members during the survey
period. During the school holidays it was noted that the number of families with children
57
walking increased from none observed outwith to approximately 60 individuals (including
children) on one day within the school holidays. The numbers of dog walkers, cyclist and
joggers remained similar during and outwith the holidays showing approximately eight, two
and two individuals respectively (Appendix H).
Public shellfish consumption notices were visible warning people not to consume the
shellfish as they are unfit for human consumption due to the possible bacterial
contamination.
The majority of activities took place on the causeway but one family was observed to be
walking east of the causeway.
Offshore habits observed were three boats moored and unattended, small numbers of
yachts, sailing dinghies and one safety boat. Two container ships were within the Firth of
Forth. There was no significant difference during and outwith the school holidays.
The Cramond Boat Club has its moorings at the mouth of the River Almond for 40 keel boats
and space in an enclosed dinghy park for a further 40 boats.
4.4.8 Granton
From Drum Sands eastwards towards Granton Harbour there was a sand and pebble shore
but no activities were observed. Granton Harbour has been in a stage of re-development for
both residential and commercial use and a further revised proposal has recently been
submitted to the council. The Royal Eastern Yacht Club and the Almond Yacht Club,
(incorporated by the Royal Forth Yacht Club) are based at Granton Harbour and they share
the harbour with The Forth Corinthians Yacht Club (FCYC) who have 80 boats moored at
Granton or stored in their own boat yard on the pier. The FCYC club is primarily a cruising
club, with a membership of around 140 and growing, although there is a keen racing group
within the club racing fin keeled boats. A rowing group is also housed within the club, the
Newhaven Coastal Rowers.
The sandy beach area of Granton was large with a coastal path. A large expanse of green
space with benches was situated for visitors. The beach was relatively popular with many
people and the activities observed included 10 dog walkers, 12 people walking along the
beach and two people sitting on the beach. Seven people were fishing off the beach and a
further two people were fishing off the jetty during the school holiday period. None were
observed outwith the local school holiday period (Appendix H). Dog walkers, cyclist and
joggers were also observed along the coastal path. Three people were painting boats.
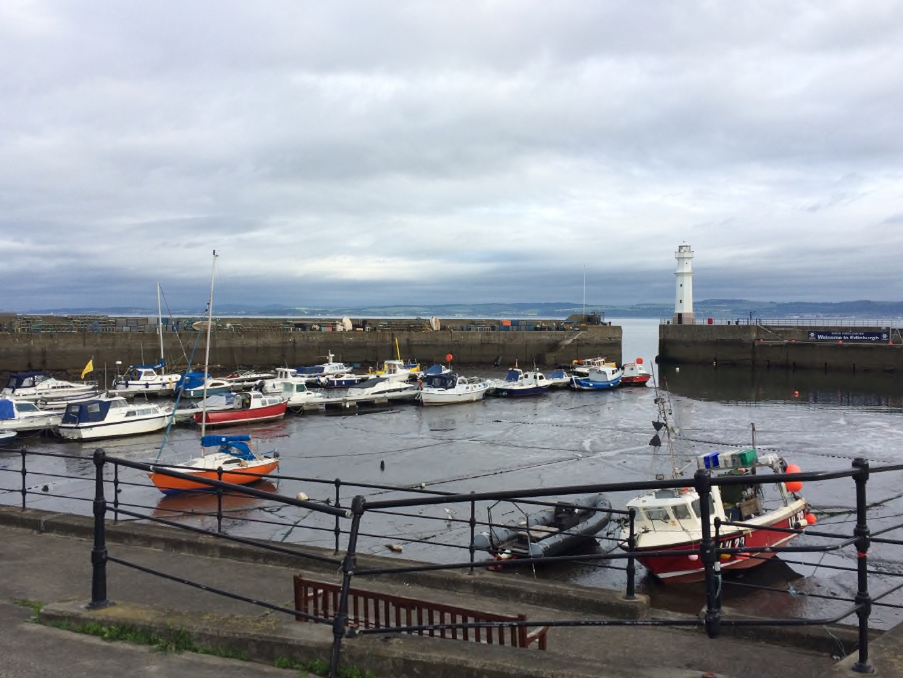
58
Public shellfish consumption notices were visible warning people not to consume the
shellfish as they are unfit for human consumption due to the possible bacterial
contamination.
4.4.9 Newhaven
Newhaven is situated east from Granton and has areas identified for residential development
land. Recently Forth Ports have unveiled plans for a new cruise liner terminal in a bid to
attract the ‘super liners’ of the future. Plans for dredging and reviews of local infrastructure
are all reportedly well advanced. If proposals are developed, ships would anchor around 1.5
miles offshore with passengers brought to Newhaven Harbour (Figure 4.15) on tender
vessels.
Current onshore activities observed were mainly dog walking, jogging and walking. Numbers
of individuals for these activities were fairly low with the exception of walking when in excess
of 30 adults and children were observed on one day. Offshore activity was considerable with
ships noted in ports both to the east and west, commercial boat traffic and people on board a
power boat and sailing yacht in the harbour. There is evidence of creeling being undertaken
based on boats moored at Newhaven Harbour.
Figure 4.15 Newhaven Harbour
59
5 Aquatic Radiation Pathways
5.1 Introduction
This section describes the relevant pathways for aquatic exposure to radioactivity and
radiation for both internal and external routes as a result of authorised discharges to the Firth
of Forth. The chapter describes the results from the postal survey returns, exposure
pathways from commercial and private fishing, wildfowling, use of pleasure craft in the Firth
of Forth along with other sources of exposure include wild swimming. The final section of this
chapter details consumption rates for food sourced from the Firth of Forth and environmental
occupancy rates for external exposure.
5.2 Postal Survey Results
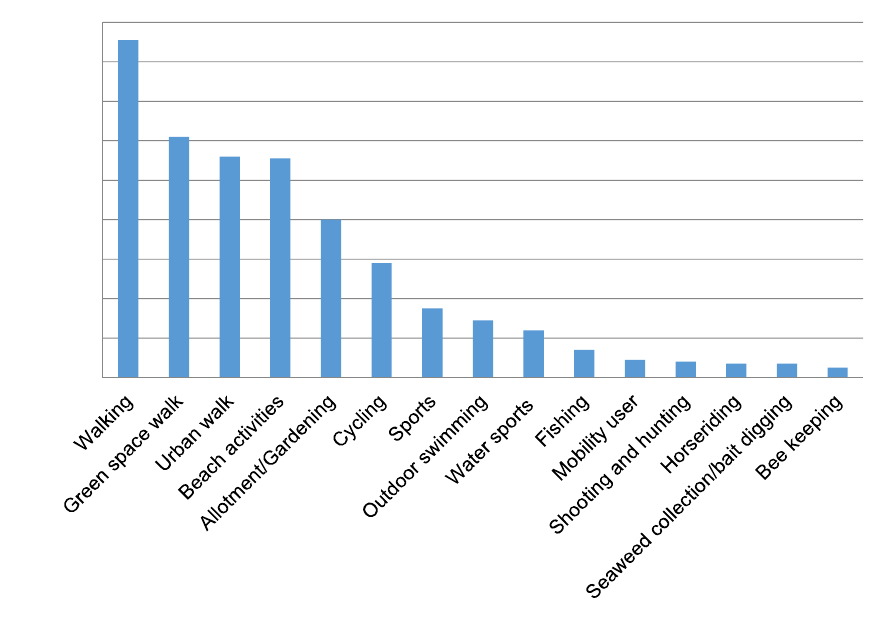
60
Of the 1000 postal surveys that were sent out to households in the survey area 177
households returned their surveys, 24 of the surveys were returned incomplete and the
remaining 153 postal returns were used in analysis along with extra information obtained on
behalf of other household members. The postal survey proved very useful for identifying
popular activities (Figure 5.1) along with where households take part in certain activities, as
respondents were asked to mark down where they carry out their activities on a map of the
survey area. This information was mapped onto a heat map (a map showing the density of
responses) to identify popular areas and activities around the BRS (Figure 5.2). These areas
were later factored into the schedule for the face-to-face surveys. In addition to location,
households were asked to indicate how often they participate in certain activities which was
converted into number of days per year; most days (260 days per year), once or twice a
week (104 days per year), once or twice a month (24 days per year), once or twice a year (2
Figure 5.1
Overview of the number of household participating in activities within the
survey area.
0
20
40
60
80
100
120
140
160
180
Number of households
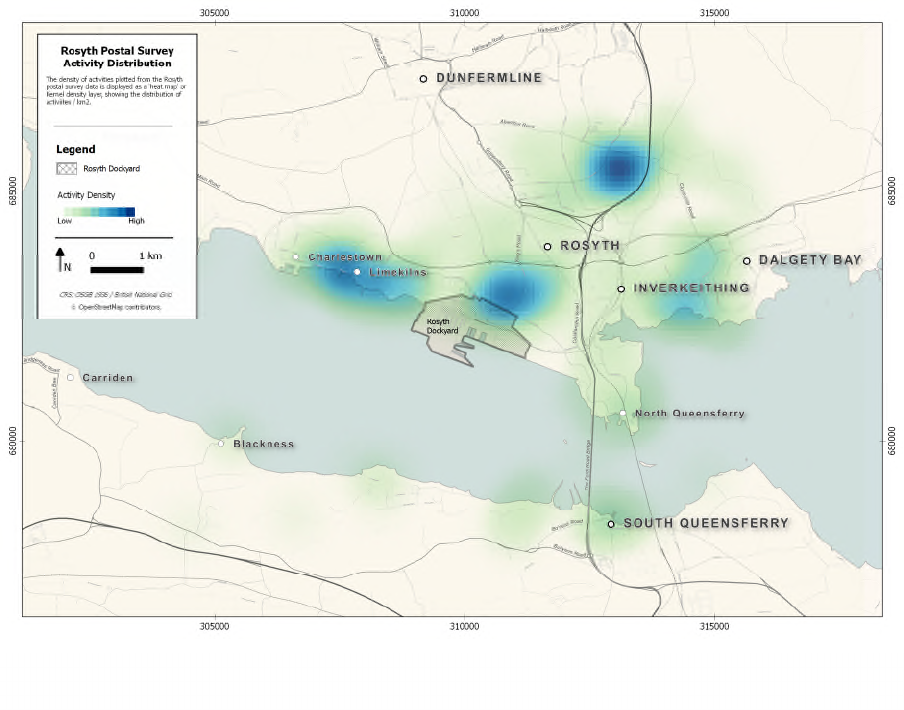
61
days per year) or never (0 days per year). No information on how long individuals spent
doing these activities was captured. The results of the aquatic radiation pathway can be
found in Sections 5.2.1, 5.2.2 and terrestrial radiation pathways in Sections, 6.2.1 and 6.2.2.
5.2.1 Internal exposure
Each household was asked to indicate how often members of their household consume local
fresh or frozen fish/crustaceans/molluscs. The 153 household postal returns showed that 61
individuals from within the households consume crab, lobster, mussels and 153 consume
fish such as cod, salmon, haddock and mackerel each varying in frequency. A summary of
results from the postal survey shows that respondents consume fish (71.5%) more
frequently than they consume crustaceans and molluscs (28.5%). The highest number of
individuals (45.4%) consume fish more than 24 days per year. For crustaceans the highest
number of respondents consume crustaceans/molluscs twice a year (18.2%). There was no
follow-up with those higher rate individuals.
Figure 5.2
Heat map showing where respondents carry out activities within the survey
area.
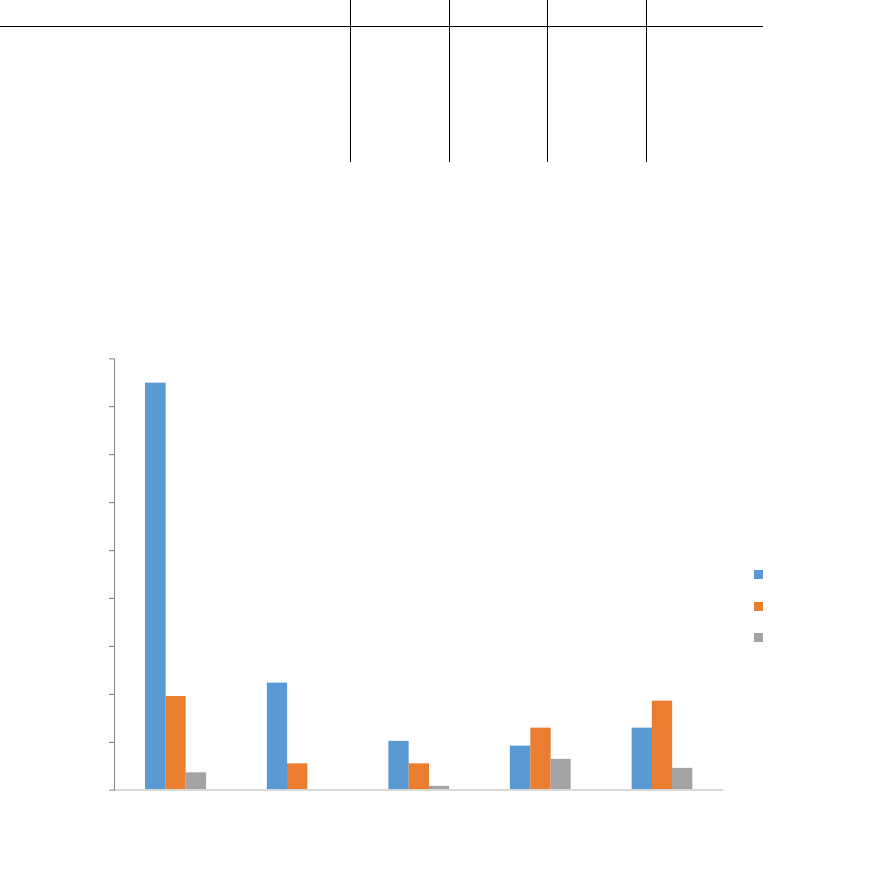
62
Table 5.1. Summary of how often members of a household consume aquatic food
types.
Frequency (days per year)
Food Type >24 24 2 Total
Crustaceans/molluscs
(crab, lobster, mussels)
5
(2.4%)
17
(7.9%)
39
(18.2%)
61
(28.5%)
Fish
(cod, salmon, haddock,
mackerel)
97
(45.4%)
47
(22.0%)
9
(4.2%)
153
(71.5%)
Participants were also asked to provide information on where their household sourced
aquatic food (supermarket, local shop or local market) and how often they purchase these
on a scale of 0-5 (0=never, 5=always). A total of 195 out of 214 (including responses from
multiple household members) individuals provided information on where they source their
fish. The results of where and how often people sourced aquatic food is displayed in figure
5.3. Results show that over 40% of the 195 individuals that consume aquatic food always
source it from a supermarket, 10% local shop and 2% local market.
5.2.2 External Exposure
A number of households carry out aquatic or intertidal activities within the survey area. The
frequency and total number of visits are presented in Table 5.2 with the highest number of
Figure 5.3
Summary of how often respondents obtain fish/crustaceans/molluscs from
supermarkets/local shops or local markets. Scale: 5 (always) to 1 (occasional).
0
5
10
15
20
25
30
35
40
45
5 4 3 2 1
Number of respondents
Preference
Supermarket
Local Shop
Local Market

63
respondents taking part in beach activities (e.g. walking, paddling, beachcombing) followed
by outdoor swimming and water sports.
Table 5.2. Total number of individuals participating in aquatic activities within the survey
area.
Frequency (days per year)
Activity >24 24 2 Total
Beach activity 15 30 66 111
Fishing 3 4 8 15
Outdoor swim 3 5 21 29
Seaweed collection 0 0 7 6
Water sports 7 3 12 22
5.3 Commercial fisheries
There has been no increase in commercial fishing activity in the survey area since 2010.
Two creel fishing boats were identified to operate within the survey area. One boat’s catch of
brown and velvet crab and lobster goes outwith the survey area and the other boat’s catch
supplies fishmongers within the survey area. Crab and lobster also go through the Edinburgh
market worldwide. Mackerel, sprats, crab, lobsters and whelks are all caught within the River
Forth survey area and may be sold locally. One north east Scotland company took crab and
lobster throughout the year for export to Europe and beyond from fishing vessels in the
Forth. Sprats caught at Newhaven are sold within the survey area. Mackerel sold in the
survey area is supplied from outwith the survey area.
One shop in the area was able to confirm that they sold crab, lobster and whelks from the
Firth of Forth area provided by a fishing boat based within the survey area. It also supplied
locally caught mackerel in the shop landed by a fishing boat based within the survey area.
Another shop in the area took fish from outwith the survey area and one fish van that traded
in the survey area did not supply any locally caught fish.
In 2004 the Scottish Executive granted a Special Nature Conservation Order (SNCO) to
Scottish Natural Heritage (SNH) to protect the Firth of Forth cockles as a source of food for
important bird populations. The Nature Conservation Order (Firth of Forth NCO 2006) was
reviewed and retained in 2011.
5.4 Seafood operations
Rosyth now has a salmon processing plant but the salmon do not come from the Forth area.

64
5.5 Fishing and Angling
Hobby fishing continues in the survey area and relates to fish and crabs caught for non-
commercial consumption from boats across the survey area (Table 5.3).
Angling from the shore was identified at South Queensferry, Burntisland, Cramond Island,
Newhaven and Inverkeithing. Angling occurs all year but primarily in the summer. Cod,
mackerel and pollock were caught around Newhaven. Mackerel, pollock and wrasse were
caught at Burntisland in the summer and cod and whiting in the winter.
In one week in the early autumn, one individual caught 100 mackerel in the Rosyth area for
their own and their family and friends consumption. Follow-up was attempted on several
occasions but was unsuccessful.
Table 5.3 Locations associated with hobby fishing activities
Bait Digging Fishing from shore/rocks/pier Small fishing boats
(non-commercial)
Burntisland
Pettycur – lug worm,
rag worm and white
sand worm
Kinghorn
Burntisland
Cramond Island off rocks
Kinghorn off rocks – mackerel
Kinghorn off beach – plaice, dab,
flounder
Granton off jetty - mackerel
Hound Point from pier
Port Edgar with rods – mackerel
Pettycur off beach - mackerel
Carriden – none observed
but advised that people go
out to fish from here
Crombie Point – one fishing
boat observed offshore
North Queensferry – many
go out fishing from boats
here
Preston Island – fishing
boats moored
Pettycur – lobster, crab,
Pettycur – mackerel, cod
and lobster
Kinghorn – mackerel and
flounder
5.6 Wildfowling
No wildfowling was noted either during the survey period or in the survey area. However,
mallard, teal and wigeon are all present in the survey area and may be shot by wildfowlers
as are pink footed geese and possibly grey lag geese. The East of Scotland Association for
Wildfowling and Conservation was approached on several occasions for more information
about wild fowling in the area, but no response was forthcoming.
65
5.7 Pleasure Craft using the Firth of Forth
A member of the Forth Corinthian Yacht Club was approached to summarise the boating
activity within the Firth of Forth to supplement the survey results. It was highlighted that there
is a lack of information on usage of the Forth but is being rectified by work by the Forth
Estuary Forum and by an ongoing survey of recreational use of the coast and sea areas
around Scotland for Marine Scotland.
A wide variety of pleasure craft use the Forth ranging from cruise liners that moor just east of
the Forth Bridge, to yachts, small motor boats, kayaks, canoes and rowing boats. Tour and
charter boats operate from North Queensferry, Hawes Pier at South Queensferry. The
Inchcolm ferry operates from Hawes Pier offering 1.5 h cruises upto 4 times per day during
the summer and three hour landing trips to Inchcolm two times per day. Port Edgar has
about 300 boats for recreational use and additional boat moorings are available in South
Queensferry Harbour and North Queensferry. Cruise ships moored east of the Forth Bridge
use multiple landing craft to ferry passengers to and from tourist coaches at Hawes Pier in
South Queensferry. Increasingly, cruise liners anchor in Leith Roads (a stretch of water 3 km
from the town of Leith) and passengers are then ferried to Newhaven. Plans have also been
proposed to land passengers in North Queensferry in the future.
Smaller Craft
Dinghy racing activities are focussed in three main centres, Port Edgar, Dalgety Bay and
North Berwick. Racing activities take place throughout the year on weekends and holidays
and scheduled around the tide times. Races can involve tens of boats largely from within
clubs and include adults and children orientated activities. Windsurfing activities take place
largely in the outer Estuary in East Lothian although a limited amount is known to take place
from Cramond. One face-to-face survey respondent indicated that kite surfing also takes
place to a limited extent off Burntisland, although none was observed during the survey.
There are a small number of sailing craft under 6 metres long used for day sailing and local
dinghy cruising, for example at Portobello.
Kayaking activity is currently being surveyed by the Firth of Clyde Forum and will be reported
in February 2016. Kayaking activities take place within and independent of organised
groups. Coastal rowing is a competitive and recreational sport that started at Anstruther.
There are currently ten clubs on the Forth with 16 St Ayles skiffs between them and more
being built and new clubs being formed. Although there are few large competitive events on
the Forth all the boats are heavily used for training and there are many local events.
66
The main boating station of the Northern Area of the Sea Cadets is at Port Edgar and the
units at Grangemouth, Port Edgar, Rosyth, Granton, Leith, Musselburgh and Methil all row
and sail on the Forth. The Port Edgar Sea Cadets Centre, which is also the National Sea
Cadets Centre, has 40 cadets who spend around 40 h y
-1
on the water in the area. The Sea
Scouts based at Limekilns have over 80 members aged from 6 to 16, most live locally, and
11 leaders and six instructors spend three hours per week on average in a boat on the Forth
with four out of six instructors also on the water for that time (typically 150 h y
-1
). The boat is
hauled across the mud depending on tides. The Sea Scouts sail from Long Craig just east of
South Queensferry.
Sea angling is dominated by small 5 m powerboats that are out in all weathers and focus in
the area east of the bridges and around the islands. They routinely creel for lobster and
catch fish such as mackerel. No consumption rates were obtained.
Larger Craft
Forth Yacht Clubs Association has 23 member clubs although there are a few clubs that do
not belong to it. These clubs total approximately 800 cruising boats based on the Forth.
There are several hundred visiting boats on the Forth over the summer period, generally on
passage to the north or south or transiting the Forth and Clyde canal (about 100 h y
-1
)
although these figures are all estimates. Most visitors berth at Anstruther, Granton or Port
Edgar, all of which have marina facilities. Most clubs have a programme of races. The most
intense racing area is from Blackness in the west to Inchkeith in the east with races run by
six clubs. Port Edgar is particularly important for racing with fleets of more than 50 racing
yachts having been recorded. Most racing takes place between May and October although
there is winter racing from Port Edgar. There are perhaps 50 boats that race regularly with
more than 50 that take part occasionally. These craft will have crews of at least four people.
Most sailing on the Forth is day sailing although many boats sail to the annual Anstruther
Muster and some boats cruise through to the west coast, the Northern Isles or further afield.
Fife Council in particular is well aware of the potential for encouraging water-borne
recreation and tourism and the use of the Forth for cruising is expected to increase.
5.8 Other Pathways
5.8.1 Wild Swimmers
Wild swimmers swam in the Forth at various times without wet suits and, locally, could
spend 100 hours a year in the water. Discussions with the Wild Swimmers Club members
from the area indicated that in the summer, club members spent around 40 hours in the
67
water, in spring 20 hours, in winter 20 hours and in autumn, 20 hours. Daily swims were
taken by some of 30-40 minutes adding up to 3.5 hours a week for some. In winter swims
were 15-20 minutes long. One swimmer spent 104 hours over the year in the water in the
survey area (Kinghorn, Burntisland, Inverkeithing and Limekilns).
5.8.2 Rowing
North Queensferry Boat (Rowing) Club identified that rowers spent on average around three
hours a week rowing in the area in the summer – June to September. Occasionally more
time would be spent rowing at weekends but not all rowing was local. The group estimates
that for the other eight months of the year, they spent on average an hour a week rowing in
the area. When rowing locally, they spent around 40 minutes in and around their boatyard.
This involved putting boats in the water and taking them out again. Boats were washed down
with freshwater and the group remarked that there was little sand or mud on the boats.
When rowing, because of the design of the boats, there was little spray and the rowers were
rarely wet from ‘sea water’. Most club members lived within the survey area although one
came from Kirkcaldy.
5.8.3 Professional Dog Walkers
Professional dog walkers now operate within the survey area. These groups will be active
along the coastal strip for much longer periods in comparison to the 2010 survey. As dogs
can go into the sea and along muddy and sandy areas, the group may potentially have
greater exposure to intertidal substrates.
5.8.4 Ramblers
The South Queensferry Ramblers confirmed that each year they do 10 walks in the area of
between six to eight miles in length. Each walk is around four to five hours. Most walks are
usually circular but some are linear. They consist of coastal and woodland walks. Annually
these would total 40 to 50 hours walking in the survey area including around 25 hours along
coastal paths and roads.
5.8.5 Animals Grazing
No animals were observed feeding on seaweed anywhere in the study area.
68
5.8.6 Bridge Building
A new bridge across the Forth began in 2011 and is planned to be complete in 2016. In
2015, 1200 employees were working on the bridge. In 2015, work was divided between
those working on the land and those on the bridge itself. Those bridge builders not on the
land side commute to the bridge six times a week and spend six hours a week on a boat with
a 60 hour working week on occasions.
5.9 Internal Exposure
5.9.1 Adults’ Consumption Rates
Table 5.4 presents a summary of the consumption rates for aquatic food types including;
fish, crustaceans, molluscs and wildfowl. Mean adult consumption rates for the high-rate
groups and the observed 97.5
th
percentile rates, the high-rate group was determined using a
cut off method and the top 20% of the sample were included in this group. The Table also
includes mean consumption rates and 97.5
th
percentile rates based on the full dataset, in
addition to the hypothetically derived 95.7
th
percentile, generic mean and generic 97.5
th
percentile rates based on National Habit Data (Smith and Jones, 2003).
Table 5.4 Summary of adults’ consumption rates of foods from the aquatic survey area.

69
Food Group
Number of observations
Number of people in the high rate
group
Observed maximum for the high-rate
group (kg y
-1
)
Observed minimum for the high-rate
group (kg y
-1
)
Observed mean for the high-rate
group (kg y
-1
)
Observed 97.5th percentile (kg y
-1
)
Full dataset – Observed mean (kg y
-1
)
Full dataset – Hypothetical 97.5
th
percentile (kg y
-1
)
National Data mean (kg y
-1
)
National data 97.5
th
percentile (kg y
-1
)
Fish
42 1 109 109 109 NA 13 106
15 40
Crustaceans
16 1 31 31 31 NA 7 30
3.5 10
Molluscs
4 1 16 16 16 NA 8 15
3.5 10
Wildfowl
1 1 26 26 26 NA 26 25
ND ND
Adults consumed mackerel (30 individuals), salmon (19 individuals), cod (16 individuals),
and a small number consumed sea bass (8 individuals) from the aquatic survey area. On
average, these respondents consumed mackerel 35 times a year, salmon 38 times a year,
cod 37 times a year and sea bass 35 times a year. The observed maximum consumption
(portion size * frequency per person) of fish was 109.2 kg y
-1
and this individual consumed
bass (13.7 kg y
-1
) cod (13.7 kg y
-1
), mackerel (68.3 kg y
-1
) and salmon (13.7 kg y
-1
) all
obtained from a fish delivery van within the survey area.
Crustacean consumption consisted of mainly brown crab and common lobster. Of the
crustaceans consumed, 11 individuals consumed brown crab 22 times a year on average
and 5.3 kg y
-1
. Also, 12 individuals consumed common lobster 15 times a year on average
and 4.6 kg y
-1
. The highest consumption was 31.2 kg y
-1
, this individual consumed freshly
caught common lobster (13 kg y
-1
) and brown crab (18.2 kg y
-1
) sourced from within the
survey area. Mussel was the only species of mollusc consumed by adults (4 individuals), the
observed maximum consumption was 15.6 kg y
-1
and sourced from fish van within the
survey area. Only one individual was found to consume wildfowl (26 kg y
-1
) sourced from
outwith the survey area.
All respondents sourced aquatic produce from local friends/fishermen that fished off
Burntisland, Kinghorn, North Queensferry or Kirkcaldy. Also, respondents used a local
fishmonger or fish van from within survey area.

70
5.9.2 Children and Infant Consumption Rates
Table 5.5 presents a summary of children’s and infants’ consumption rates of fish,
crustaceans, molluscs and wildfowl from the aquatic survey area. Mean consumption rates
for the high-rate groups and the observed 97.5
th
percentile rates are included in Table 5.5.
The high-rate group was determined using a cut off method, those found at 80% and over
were included in the high-rate group. The Table also includes mean consumption rates and
97.5
th
percentile rates based on the full dataset. For both the child and infant age group, no
consumption of crustaceans or wildfowl was identified.
For the child age group, mackerel was the only fish species to be consumed by children. The
observed maximum consumption provided from the parent was 1 kg y
-1
, all of which was
self-caught within the survey area. Fish species consumed by infants were cod (3.9 kg y
-1
)
and salmon (3.9 kg y
-1
) with maximum consumption being 7.8 (kg y
-1
). The same infant also
consumed mussels (15.6 kg y
-1
) all of which came from a fish van that delivers within survey
area, whose fish is sourced outwith the survey area.
Table 5.5 Summary of children’s and infants’ consumption rates of foods from the aquatic
survey area.
Food Group
Number of observations
Number of people in the
high rate group
Observed
maximum for the
high
-rate group (kg y
-1
)
Observed minimum for the
high
-rate group (kg y
-1
)
Observed mean for the
high
-rate group (kg y
-1
)
Observed 95.7
th
percentile
(kg y
-1
)
Full dataset
– Observed
mean (k
g y
-1
)
Full dataset –
Hypothetical
97.5
th
percentile (kg y
-1
)
Child age group (6 - 15 years old)
Fish
2 1 1 1 1 NA 1 0.99
Crustaceans
0 0 0 0 0 NA 0 0
Molluscs
0 0 0 0 0 NA 0 0
Wildfowl
0 0 0 0 0 NA 0 0
Infant age group (0 - 5 years old)
Fish
1 1 7.8 7.8 7.8 NA 4.17 7.6
Crustaceans
0 0 0 0 0 NA 0 0
Molluscs
1 1 15.6 15.6 15.6 NA 15.6 15.2
Wildfowl
0 0 0 0 0 NA 0 0

71
5.10 External Exposure
Occupancy rates for adults in intertidal, aquatic (in water), aquatic (on water) and handling
rates of equipment can be found in Table 5.6. Intertidal activities for adults included bait
digging, beachcombing, boat maintenance, collecting mussels, razor clams, seaweed and
winkles, crabbing, dog walking, and fixing moorings, handling creels, horse-riding, paddling,
playing, research/educational purposes and rock pooling. The highest intertidal occupancy
rate was 2,930 h y
-1
for a respondent who spent time beachcombing, professional dog
walking and rock pooling within the survey area. Given the high occupancy a follow-up
interview was undertaken and confirmed these values were correct.
Activities in the water included swimming, diving, sub-aqua diving and paddling. The highest
occupancy rate for adults in the water was 106 h y
-1
for a respondent who goes paddling
(100 h y
-1
) and outdoor swimming (6 h y
-1
) within the survey area. Activities on the water
included angling, boat maintenance, being on a dive boat, canoeing, commercial fishing,
commute via boat, jet skiing, rowing, safety boat duties, sailing, power boating, water skiing,
and working on a boat. The highest occupancy rate for adults on the water was 3,416 h y
-1
for a respondent who works full-time on a boat (2,920 h y
-1
) and also owns his own boat so
carries out boat maintenance (416 h y
-1
) within the survey area. Adults were also found to
handle equipment within the survey area, the activities for adults involving handling
equipment included boat maintenance, handling clothes and overalls, diving gear, fishing
gear and outdoor swimming gear. The highest level of handling equipment was 1,460 h y
-1
this respondent spent time handling boating equipment, fishing gear, clothes and overalls on
a daily basis within the survey area.
Table 5.6 Summary of adults’ external exposure for intertidal, aquatic and handling of
equipment.
Activity
Number of observations
Number of people in the
high rate group
Observed maximum for
the high-rate group (h y
-1
)
Observed minimum for the
high-rate group (h y
-1
)
Observed mean for the
high-rate group (h y
-1
)
Observed 95.7
th
percentile
(h y
-1
)
Hypothetical 95.7
th
percentile (h y
-1
)
Intertidal
199 2 2930 2398 2664
ND
2856.8
Aquatic (in water)
43 1 106 106 106
ND
103
Aquatic (on water)
94 5 3416 2768 2969
ND
3331
Handling Equipment
56 1
1460 1460 1460
ND
1424
72
Table 5.7 presents a summary of the children and infants’ intertidal, aquatic (in water),
aquatic (on water) occupancy rates and handling rates of equipment. Intertidal activities for
children and infants included beachcombing, boat maintenance, collecting mussels,
collecting seaweed, dog walking, paddling, and playing on the intertidal area and rock
pooling. The highest occupancy rate for children on the intertidal zone was 1,556 h y
-1
for a
respondent who spent time beachcombing and dog walking. For infants, the highest
occupancy was 1,248 h y
-1
for an infant who spends time playing (624 h y
-1
), rock pooling
(208 h y
-1
), paddling (104 h y
-1
) and dog walking (312 h y
-1
) on the intertidal area. It is
recognised that these values may be an overestimate but no contact details are available to
follow up.
Activities in the water included paddling, swimming and diving. The highest occupancy rate
for children in the water was 104 h y
-1
for a respondent who practiced outdoor swimming at
various locations within the survey area. For infants, the highest occupancy was 52 h y
-1
for
an individual spending time paddling within the survey area.
Activities on the water included sea angling, boat maintenance, canoeing, rowing, safety
boat duties, sailing, sports fishing and working on a boat. The highest occupancy rate for
children carrying out activities on the water was 1,267 h y
-1
. This respondent helped his
parents who were working on a boat (1,095 h y
-1
) in addition to, canoeing (24 h y
-1
), rowing
(4 h y
-1
)
,
safety boat duties (24 h y
-1
), sailing (24 h y
-1
) and sports fishing (96 h y
-1
), further
information on the work this respondent conducted was not obtained and it’s recognised that
this value may be an overestimate but no contact details are available to follow up. All of
these activities were recorded within the survey area. For infants, the highest occupancy
was 72 h y
-1
carrying out fishing activities with a parent. Children also handled equipment
within the survey area, this equipment included boating equipment, diving gear, fishing gear
and swimming gear. The highest occupancy for a child handling equipment was 1,095 h y
-1
,
this respondent spent time maintaining boat equipment and fishing gear with a parent. No
individuals in the infant age group were identified handling equipment during the survey
period.

73
Table 5.7 Summary of children’s and infants’ external exposure for intertidal, aquatic and
handling of equipment
Activity
Number of observations
Number of people in the
high rate group
Observed maximum for
the high-rate group (h y
-1
)
Observed minimum for the
high-rate group (h y
-1
)
Observed mean for the
high-rate group (h y
-1
)
Observed 95.7
th
percentile
(h y
-1
)
Hypothetical 95.7
th
percentile (h y
-1
)
Child age group (6 - 15 years old)
Intertidal
35 6 1556 1378 1462
ND
1517
Aquatic (in water)
10 1 104 104 104
ND
101
Aquatic (on water)
8 1 1267 1267 1267
ND
1235
Handling Equipment
4 1
1095 1095 1095
ND
1068
Infant age group (0 - 5 years old)
Intertidal
25 2 1248 1248 1248 ND 1217
Aquatic (in water)
10 1 52 52 52 ND 50.7
Aquatic (on water)
1 1 72 72 72 ND 70.2
Handling Equipment
0 0 0 0 0 ND 0
Gamma dose rate measurements over different substrates within the survey area can be
found in Section 7.3.
74
6 Terrestrial Radiation Pathways
6.1 Introduction
Chapter 6 deals with all inland routes of exposure immediately adjacent to the Firth of Forth
coastal and intertidal areas (Figure 2.1). The observations made at each site have been
presented in Chapter 4. The results from the postal survey reports are presented to provide
an overview of the habits within the 5 km study area immediately around the Rosyth
perimeter. The experimental results from the GPS tracker devices are also presented to
provide some temporal and spatial resolution in the habits of individuals. Private food
production details are provided and the results from the face-to-face consumption levels for
privately produced food stuffs are presented. It is noted that there is subjectivity on
individuals reporting on masses, volumes and frequency. Information is reported as
provided.
6.2 Postal Survey Results
6.2.1 Internal Exposure
A list of terrestrial food items used in the postal survey is shown in Table 6.1. The results
show that dairy products such as milk, cheese and yoghurt are the most frequently
consumed food type with 126 respondents consuming it daily as well as the most popular
with 169 respondents consuming dairy products. Wild meat, such as rabbit and game, was
the least selected food type with only 24 respondents consuming it and 16 of these only
consume it twice a year. No eggs were identified as being sourced within the study area.
For terrestrial food types respondents were asked to estimate where they sourced fresh or
frozen terrestrial food from (supermarket, local shop, allotment/garden or a local market). On
using the full dataset respondents selected terrestrial food items from the supermarket on a
daily basis (1,115 selections). Figures 6.1-6.3 show how frequently respondents use
supermarkts to source meat, vegetables and potatoes.
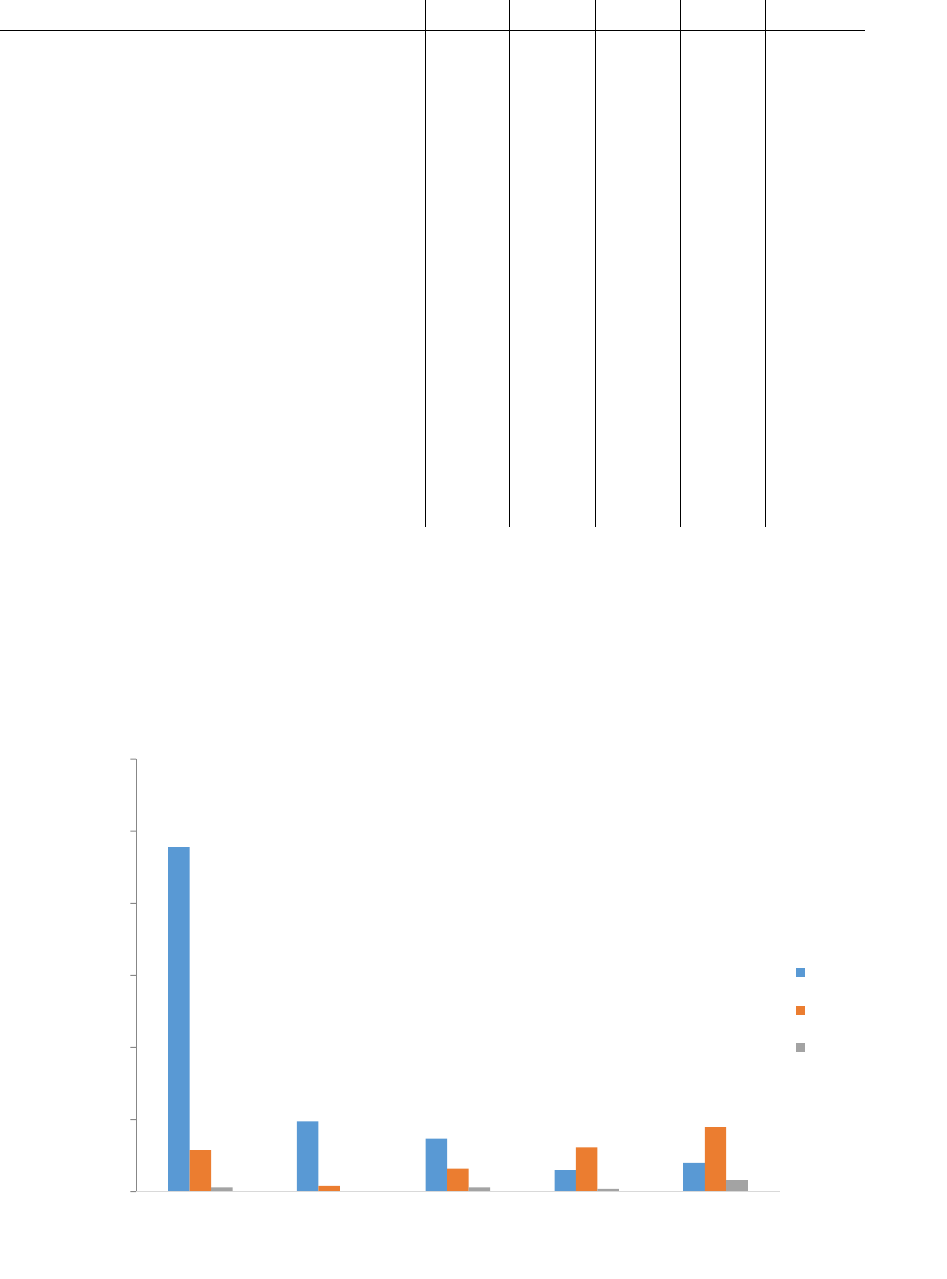
75
Table 6.1 Summary of terrestrial food types and how frequently each food type is consumed.
Frequency (days per year)
Food type 260 104 24 2 Total
beef, lamb, pork 15 98 31 6 150
green vegetables 32 89 30 6 157
chicken,(duck, goose, wildfowl) 30 102 17 0 149
cow and goats’ milk, cheese and/or
yoghurt
126 37 5 1 169
honey 20 26 42 18 106
leeks or onions 53 75 19 4 151
lettuce, tomatoes, cucumber 49 78 25 6 158
pies, burgers, sausages, haggis made
from local meat
7 46 70 10 133
potatoes 65 75 10 0 150
root vegetables 42 86 22 2 152
shop bought apples, pears and/or berries 83 53 16 7 159
wild meat such as rabbit or game 0 2 6 16 24
wild/ free food including berries, apples,
pears, mushrooms in season
18 21 14 25 78
Figure 6.1
Summary of how often respondents obtain meat from supermarkets/local
shops or local markets. Scale: 5 (always) to 1 (occasional).
0
10
20
30
40
50
60
5 4 3 2 1
Number of respondents
Preference
Supermarket
local shop
local market
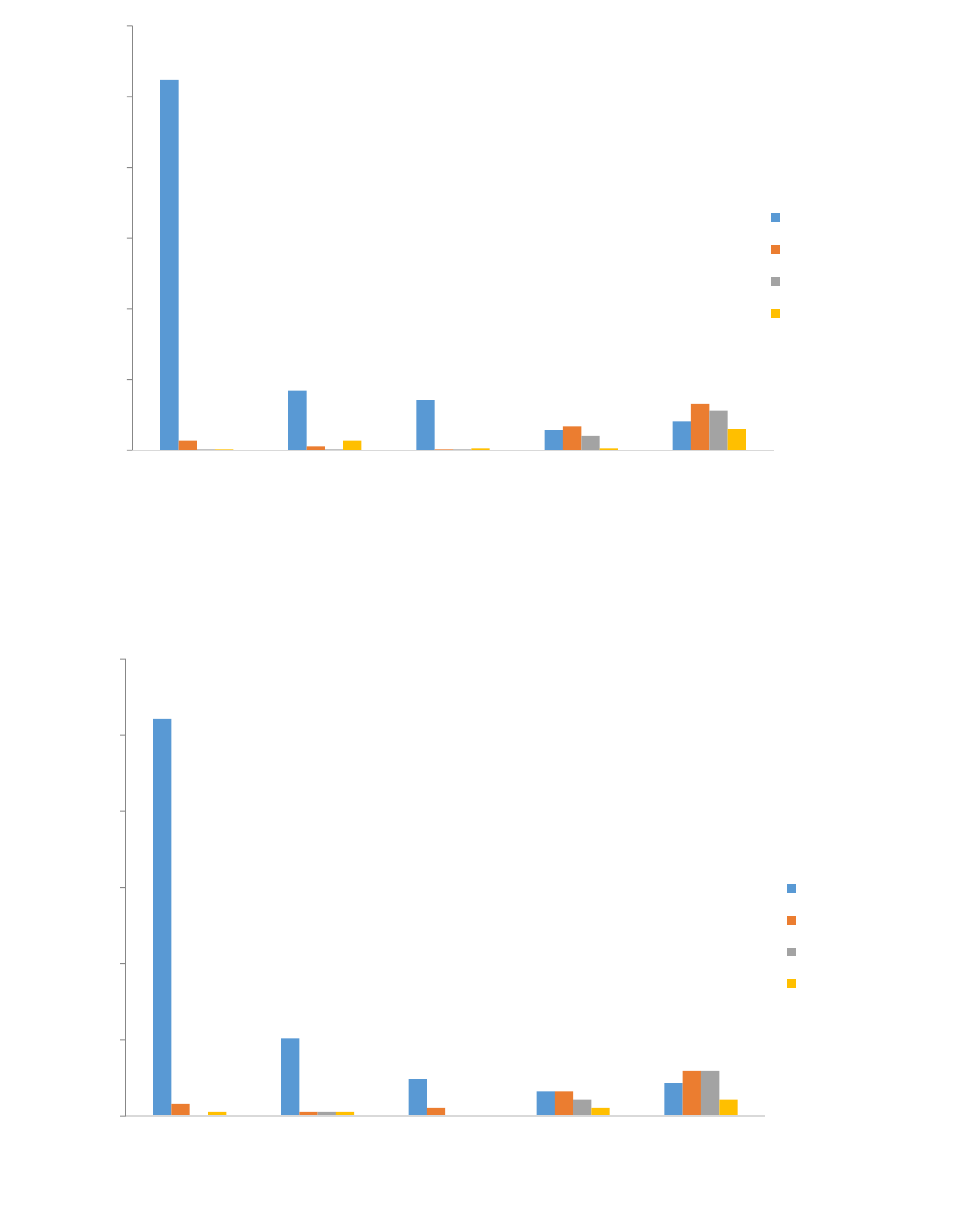
76
Figure
6.2
Summary of how often respondents obtain vegetables from
supermarkets/local shops or local markets. Scale: 5 (always) to 1 (occasional).
0
10
20
30
40
50
60
5 4 3 2 1
Number of respondents
Preference
supermarket
local shop
allotment/garden
local market
0%
10%
20%
30%
40%
50%
60%
5 4 3 2 1
Number of respondents
Preference
supermarket
local shop
allotment/garden
local market
Figure
6.3
Summary of how often respondents obtain potatoes from supermarkets/local
shops or local markets. Scale: 5 (always) to 1 (occasional).

77
6.2.2 Outdoor Activities
The postal survey showed that greenspace walking, urban walking and allotment/gardening
activities were the highest selected terrestrial activities. Allotments and gardening were
selected by 80 households with 34% participating on a daily basis and a further 345
participating twice per week (Table 6.2). Outdoor walking was selected 163 times with 61%
participating daily.
Table 6.2 Summary of how often respondents participate in outdoor terrestrial activities.
Frequency (days per year)
Activity
260
104
24
2
Total
Allotment/Gardening 27 27 21 5 80
Bee keeping 2 1 1 1 5
Cycling 9 19 15 16 59
Green Space Walking 30 46 35 8 119
Horse-Riding 1 5 0 2 8
Mobility User 1 6 1 2 10
Shooting and Hunting 0 2 4 4 10
Sports 0 15 6 5 26
Urban Walking 35 37 26 9 107
Walking 100 49 14 0 163
6.3 GPS Survey Results
To provide more details on the use of the environment around the BRS, five individuals were
selected to wear trackers based from the knowledge gained of their habits from the face-to-
face interviews. Trackers were deployed for a period of one week. Three were given to
Rosyth site employees and two were given to two residents of North Queensferry who were
identified from the face-to-face survey as spending a lot of their time in the North
Queensferry area. Details of the GPS tracker results are presented in Appendix F.
6.4 Private Food Production
6.4.1 Allotments and Community Gardens
Five allotments were identified within the 5 km radius of the BRS. Two were based in
Rosyth: (i) Admiralty Road allotments (Figure 6.4), which is run by a private committee; and
(ii) Wemyss Road allotments, which is run by the council. Two further allotments were
identified in Dunfermline: (i) Calais View allotments; and (ii) Whirlbut allotments, both run by
the council. Additional allotments identified included: (i) one in Inverkeithing, Hope Street
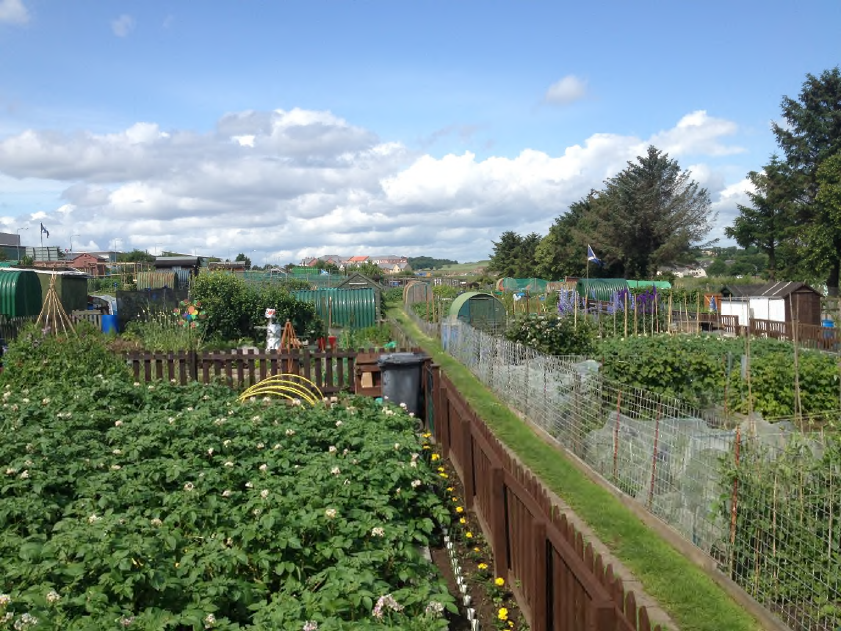
78
allotments, which is run by a committee. One allotment in Dalgety Bay, which is run by a
committee, was identified but is just outwith the 5 km radius.
The allotments varied in size from a small allotment of approximately five plots at the Calais
View allotments in Dunfermline to approximately 50 at the Admiralty Road allotments in
Rosyth. The Admiralty Road allotments were by far the most active site at the time of the
interviews, resulting in the majority of the successful face-to-face interviews. It was however
difficult to access the site due to the locked gates, required for site security. The Wemyss
Road allotments were situated beside the railway station and appeared fairly small with
approximately 20 well-maintained plots. The Calais View allotments, with only about five
plots, were less well maintained and there appeared to be only one plot being worked. No
interviews were undertaken at this allotment. The Whirlbut allotments were a fairly small site
with approximately 15 plots, all of which were relatively well maintained. As with Admiralty
Road, access to Whirlbut was difficult due to the presence of locked gates.
The individual interviewed at this allotment indicated that the council were developing plans
to expand the Whirlbut site to the adjacent land to provide more plots.
Figu
re
6.4
View looking west over the Admiralty Road Allotments, Rosyth
79
The allotments produced a wide variety of vegetables and fruit and the majority of allotment
holders interviewed provided detailed data on the yield of their products, many of which had
a record of the amount of each vegetable and fruit planted and the yield. Face-to-face
interviews at the Admiralty Road allotments indicated that all the produce on the survey list
were produced to varying degrees by one or more allotment owners. The food grown at the
allotments were consumed by their families and friends within the survey area.
Two community gardens and one community “free food” project were identified within the
survey area. The community garden in Inverkeithing is well organised. Members manage the
garden together and consume the vegetables and fruit. Visitors are welcome to wander
around the garden and there is an opportunity to purchase produce available. A second
active community garden was identified at North Queensferry, behind Ferryhills Road, within
an old walled garden. The community garden produces food primarily for those that tend to
the garden, although an open-day was being planned by the organising committee at the
time of visiting. A school within the survey area also has a garden, tended by volunteers and
school children. Seaweed is extensively used as a soil conditioner on the school garden
within the survey area. No other community gardens within the survey area were identified.
The community “free food” in Rosyth – Edible and Tasty Spaces (EATS) - was set up by the
Rosyth Community Council as a project and there are the three sites situated at the library,
The Anchor Bed and Queensferry Road. The Rosyth Community Council is hoping to
establish a community garden and a centenary orchard which they are currently trying to
secure land for from Fife Council. Other EATS sites are present elsewhere in Fife but no
others were identified within the survey area.
Within the community gardens a variety of green leafy vegetables, root vegetables and
alliums were grown. Some soft fruits were also grown. Within the free foods available it was
mainly cabbage, purple sprouting, chard, crab apples and fruit shrubs.
Over the survey period, 120 people were interviewed who grew their own food either within
their own home gardens or community gardens. However, fully quantitative information was
difficult to acquire or interpret from all interviews. Of these interviews, 26 individuals yielded
data of sufficient quality for quantitative estimates of food quantities grown and consumed.
6.4.2 Use of Seaweed as a soil conditioner
Seaweed as a soil conditioner is used in the area, and of the 26 individuals questioned in the
face-to-face survey, five confirmed that they used seaweed routinely for this purpose and
this is presented in Table 6.3. Quantities were usually reported in terms of trailer, wheel
barrow or sack loads. These were converted during the face-to-face interviews with the

80
respondents to approximate mass assuming the seaweed was wet. The seaweed was
applied either as compost or directly to the soil surface and allowed to decompose. Two
additional respondents identified that they used a commercial liquid seaweed application,
this has been excluded from any further analysis.
Table 6.3 Use of Seaweed as a soil conditioner in the Rosyth Area
Survey ID Used where Collected From Application
Estimated
Annual
Quantity (kg)
R/S/AT/015 Community
Garden and
School
Firth of Forth,
Northern Shore
Directly to the soil
surface
3000
R/A/LE/71 Admiralty Road
Allotment
Limekilns Composted 180
R/A/AT/052a Admiralty Road
Allotment
Limekilns Composted 200
R/A/AT/052c Admiralty Road
Allotment
Limekilns Composted 200
R/A/AT/053a Admiralty Road
Allotment
Limekilns and
Crombie Point
Composted 150
6.5 Other Pathways
6.5.1 Production of Honey
The production of honey is very much weather-dependent as wet cold weather reduces the
bees’ ability to come out of the hive. In 2015 during the wet cool summer the bees have not
been able to leave the hive as often as previous years. Coupled with this, the cool wet
weather has also affected the growth of flowers. These two factors meant that in 2015 honey
production was significantly lower than that for 2014 (Dunfermline and West Fife Beekeepers
Association - DWFBA). Beekeepers around Rosyth have confirmed that production of honey
has been low with beekeepers having to feed the bees sugar for most of the summer.
Although 2015 appears to have been a poor year for honey production around Fife, Fife
beekeepers reported an increase in the number of beekeepers over the last few years.
However, as beekeepers are not required to be a member of a bee keeping association or
be registered the precise numbers in the Roysth area are unknown. Information from a
member of Fife Beekeepers Association estimates that there may be around 100 bee
keepers between Burntisland and Culross of which 30 – 40 are known to the Association.
The majority of these are thought to be hobby beekeepers consuming their own honey and
gifting it to friends and family. West Fife Beekeepers has around 60 members. Hives are
81
estimated to produce 14 kg of honey but may produce as much as 32 kg. However, as noted
above for 2015, and reported from Dunfermline and West Fife Beekeepers Association
(DWFBA), significantly lower quantities of honey appear to have been produced.
Two commercial beekeepers were identified in the 2015 survey. Both of the commercial
beekeepers identified sell honey locally within the survey area. As noted, honey production
is weather dependent and one of the beekeepers stated they would ‘normally’ expect to yield
18 – 22 kg of honey from one hive. A third beekeeper was identified within the survey area
however, during the survey period contact with this person was unsuccessful.
6.6 Internal Exposure
6.6.1 Internal Exposure Adult Consumption Rate
Consumption data for locally produced foodstuffs potentially affected by atmospheric
releases from Rosyth are presented in Table 6.4 for adults and Table 6.5 for children. No
consumption of locally produced foodstuffs were identified by infants in 2015.
Table 6.4 presents a summary of the adult consumption rates. The Table summarises the
number of observations made, the number of people in the high-rate consumer group, the
minimum and maximum observed consumption rates for the high-rate consumer group and
the observed (or hypothetically derived) 97.5% consumption rate. The Table also contains
the mean consumption rate for both the high-rate consumer group and the whole dataset
collected from around Rosyth. The Table also provides the mean and 97.5% consumption
rates from national data (Smith and Jones, 2003) for comparison.

82
Table 6.4 Summary of adult consumption rate of foods from the terrestrial survey area
Food type
Number of observations
Number of people in the high rate
group
Observed ma
ximum for the high-rate
group (k
g y
-1
)
Observed min
imum for the high-rate
group (k
g y
-1
)
Observed
mean for the high-rate
group (k
g y
-1
)
Observed 97.5
th
percentile (kg y
-1
)
Full dataset
– Observed mean (kg y
-1
)
Full dataset
– Hypothetical 97.5
th
percentile (k
g y
-1
)
National Mean (k
g y
-1
)
National
97.5
th
percentile (kg y
-1
)
Vegetables
-
Green
22 3 74.2 62.1 68.3 NA 21.8 72.4 15 45
Vegetables
- Root
21 6 43.0 36.3 38.7 27.3 22.2 41.9 10 40
Vegetables
- Potatoes
14 4 50.0 42.0 46.0 NA 24.6 48.8 50 120
Fruit
-
Domestic
19 2 39.0 39.0 38.7 NA 13.5 38.0 20 75
Fruit
-
Wild
7 25
Meat
-
Beef
1 1 20.8 20.8 20.8 NA 20.8 20.3 15 45
Meat
-
Game
NA NA
Meat
-
Poultry
1 1 10.6 10.6 10.6 NA 10.6 10.3 10 30
Meat
-
Sheep
8 25
Honey
2.5 9.5
Consumption of locally produced foods were identified for green and root vegetables,
potatoes, domestic fruit, beef and poultry. No consumption of locally produced lamb or
mutton, honey, venison, milk, pig products, eggs, rabbits/hares, wild mushrooms or
freshwater fish were observed.
Three observed mean consumption rates for the high-rate consumer group were found to be
greater than the 97.5% value for the full 2015 dataset. These were for fruit, beef and poultry
products. Only one of the observed mean consumption rates for the high-rate consumer
group was found to exceed the national 97.5% consumption rate. This was for green
vegetables. The remaining five groups for which data was collected in the 2015 survey were

83
all found to have lower mean consumption rates for the high-rate consumer group than the
national 97.5% consumption rate.
6.6.2 Children and Infant’s Consumption Rates
Table 6.5 presents a summary of the children consumption rates. The Table summarises the
number of observations made, the number of people in the high-rate consumer group, the
minimum and maximum observed consumption rates for the high-rate consumer group and
the observed (or hypothetically derived) 97.5% consumption rate. The Table also contains
the mean consumption rate for both the high-rate consumer group and the whole dataset
collected from around Rosyth. No data on children’s consumption rate are available at a
national level. No information on infants’ consumption rates of foods from the local survey
area could be identified.
Child consumption of locally produced foods were identified for four groups green and root
vegetables, potatoes and domestic fruit. No consumption of locally produced lamb or mutton,
honey, venison, milk, pig products, eggs, rabbits/hares, wild mushrooms, beef, poultry or
freshwater fish were observed. The two observed mean consumption rates for the high-rate
consumer group were found to be greater than the 97.5% value than the full 2015 dataset.
Table 6.5 Summary of children’s consumption rates
Food type
Number of observations
Number of people in the
high rate group
Observed ma
ximum for the
high
-rate group (kg y
-1
)
Observed min
imum for the
high
-rate group (kg y
-1
)
Observed
mean for the high-
rate
group (kg y
-1
)
Observed 95.7
th
percentile
(
kg y
-1
)
Full dataset
– observed
mean (k
g y
-1
)
Full dataset – Hypothetical
97.5
th
percentile (kg y
-1
)
Vegetables- Green
2 2 9.1 9.1 9.1 NA 9.1 8.9
Vegetables - Root
2 2 2.6 2.6 2.6 NA 2.6 2.5
Vegetables
-
Potatoes
2 2 12.5 12.5 12.5 NA 12.5 12.2
Fruit - Domestic
2 2 39 39 39 NA 39 38
Fruit - Wild
0
Meat – Beef
0
Meat – Game
0
Meat – Poultry
0
Meat – Sheep
0
Honey
0
84
7 Direct Radiation Exposure
7.1 Introduction
Direct radiation exposure was assessed in the first instance by a mobile gamma
spectrometry survey, including the main routes around the survey area, the majority of roads
within the 1 km area (Chapter 2) and a more detailed survey of all publically accessible
areas within the BRS.
These data were used to help target follow-up in-situ terrestrial air kerma measurements,
which were undertaken at any location where an apparent anomaly was observed and at all
face-to-face survey locations concurrently with the face-to-face surveys. Estimates of doses
derived from discharges from site are very small and described in Section 2.2.
7.2 Mobile Gamma Spectrometry Survey
7.2.1 Survey Area
A significant portion of the study area was surveyed by car-borne gamma spectrometry. The
main focus was the areas surrounding the BRS, however, additional data was also captured
on route to other survey locations as shown in Figure 7.1 for the broad area and Figure 7.2
for the area surrounding Rosyth. The survey was acquired on two separate occasions on the
15
th
May and 18
th
June.
Figure 7.1 shows the results from the survey. A number of increased counts are illustrated
across the survey area and reflect the change in the gamma radiation environment largely
due to bridges, concrete and other road related support structures. Bridges increase the
amount of natural radiation by changing the geometry from a flat plain underneath the
detector to one that fully surrounds the detector. Anomalies are noted in South Queensferry.
The spectra indicate that these are features resulting from the increase in the natural
abundance of potassium-40, uranium and thorium and is attributed to changes in road
material, for example the change from tarmac to cobbles.

85
Figure 7.1 Example of the distribution of >350 keV gamma counts in the study area
7.3 In-Situ Gamma Dosimetry
7.3.1 Terrestrial Areas
A total of 46 gamma dose rate measurements were taken in terrestrial environments,
excluding intertidal areas. The distribution in terrestrial gamma dose rates are mapped in
Figure 7.2. The map shows that whilst there is no systematic distribution of terrestrial
gamma dose rate, the highest values are identified on site, discussed in Section 7.2.3, and
one site to the south of the estuary in Carriden. Table 7.1 provides a summary of the gamma
dose rate measurements made.
The slightly elevated measurement at Carriden Boat Club was made at a central location
within the boatyard.

86
Table 7.1 Summary of Gamma Dose rate measurements collected across the terrestrial
environments. Where n=1, the range is based on the 2σ measurement uncertainty.
Location Surface n
Mean
(µGy h
-1
)
Range
Minimum Maximum
(µGy h
-1
)
Bo'ness
grass bank close to intertidal
area
1 0.0331 0.0291 0.0370
Carriden coastal path 1 0.0243 0.0206 0.0279
Carriden boat club 1 0.0442 0.0399 0.0485
Charlestown grass area close to harbour 4 0.0186 0.0159 0.0246
Cramond
Island
causeway on concrete surface 1 0.0265 0.0228 0.0303
Cramond
Island
grass bank close to beach 1 0.0155 0.0120 0.0190
Crombie
Houses on road close to shoreline 1 0.0242 0.0206 0.0279
Culross grass/tarmac in car park 2 0.0328 0.0316 0.0341
Culross grass on seafront 1 0.0282 0.0244 0.0320
Culross grass in West Park 7 0.0285 0.0236 0.0332
Dalgety Bay grass bank 1 0.0196 0.0160 0.0232
Granton grass bank on coastal path 1 0.0242 0.0206 0.0279
Hound Point grass on seafront 1 0.0137 0.0103 0.0171
Kincardine concrete/coastal path 2 0.0340 0.0299 0.0380
Kincardine grass bank 3 0.0283 0.0228 0.0338
Limekilns grass bank 1 0.0236 0.0200 0.0273
North
Queensferry
garden where boating
equipment is washed
1 0.0240 0.0204 0.0277
BRS
concrete surface on perimeter
fence of radiography buildings
7 0.0280 0.0245 0.0309
BRS road outside AWAF 1 0.0315 0.0276 0.0354
BRS
junction between Wood Road.
and Bell Road
1 0.0538 0.0491 0.0584
Rosyth Park grass 3 0.0347 0.0275 0.0392
Torryburn coastal path 1 0.0237 0.0200 0.0273
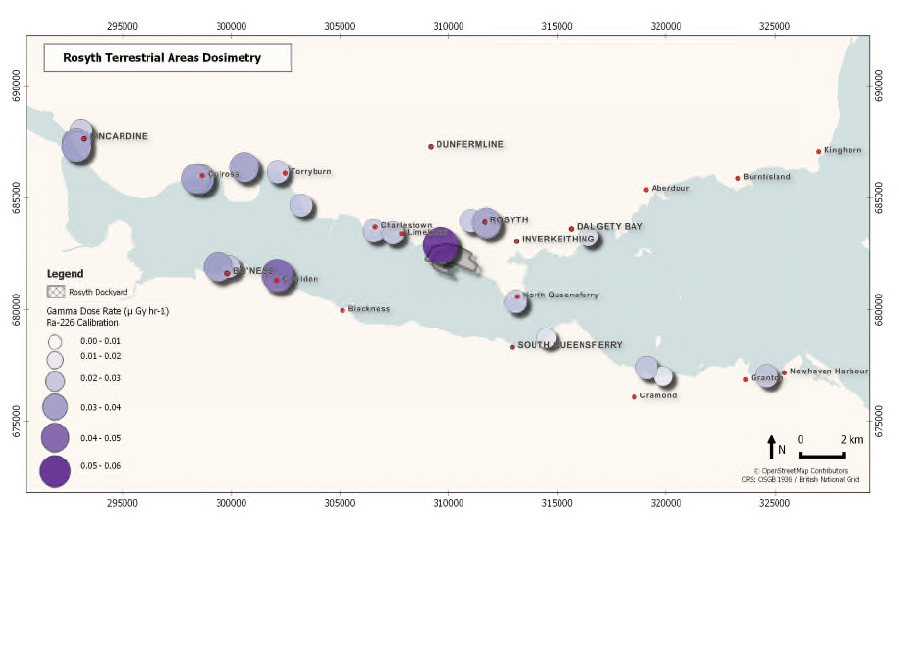
87
7.3.2 Intertidal areas
A total of 37 in-situ terrestrial gamma dose rate measurements were made over intertidal
surfaces. At each site, gamma dose rate measurements were made over the dominant
intertidal surfaces observed. Figure 7.3 provides a summary of the intertidal gamma dose
rates measured. Geological influences in addition to sediment moisture strongly control the
observed terrestrial gamma dose rate. The lowest values were very close to 0 µGy h
-1
(with
intrinsic and cosmic component removed) over wet sand with standing water at Burntisland
and as a result of the purity of the quartz sand Silversands. The maximum values recorded
for each site are reported in Table 7.2.
Figure 7.2
Map showing the distribution of gamma dose rates observed at the study site
locations in the terrestrial environment. Note at Rosyth radiography sources were known
to be in use.

88
Table 7.2 Terrestrial gamma dose rate recorded over different intertidal substrates
Gamma Dose Rate over Substrate type (µGy h
-
1
)
Location
Mud /
silt 2 σ Sand 2 σ Shingle 2 σ
Pebbles
/ Rock 2 σ
Blackness 0.0126 0.0034
Bo'ness 0.0258 0.0037 0.0343 0.0423 0.0423 0.0042
Burntisland 0.0129 0.0034 0.0188 0.0067 0.0193 0.0035
Carriden 0.0223 0.0036 0.0346 0.0040
Charlestown 0.0183 0.0035
Cramond Island 0.0215 0.0036 0.0170 0.0035
Dalgety Bay 0.0260 0.0037 0.0239 0.0037 0.0284 0.0038 0.0093 0.0033
Inverkeithing 0.0242 0.0037
Kincardine 0.0265 0.0037
Limekilns 0.0202 0.0035
North
Queensferry 0.0194 0.0035 0.0248 0.0037 0.0277 0.0038
Silver Sands 0.0200 0.0035
Society Point 0.0141 0.0034
South
Queensferry 0.0126 0.0034
Torryburn 0.0246 0.0037 0.0276 0.0038 0.0254 0.0037
Mean 0.0224 0.0204 0.0317 0.0143
Maximum 0.0265 0.0343 0.0423 0.0193
Figure 7.3
Map showing the distribution of gamma dose rates observed at the study site
locations in the intertidal environment

89
The highest values were recorded at Bo’ness and are associated with historical pottery
manufacturing, and has been observed previously (CEFAS, 2010). This historical legacy
may also explain the slightly elevated values at Carriden.
7.4 In-Situ Beta Dosimetry
Beta dosimetry of skin dose [H’(0.07)] was measured over objects and clothing frequently
immersed within the Firth of Forth. A kayak, wet suit, wet suit boots and fishing equipment
were measured within the northern shore survey area and wet suit clothing from dinghy
sailors were measured within the southern shore survey area. All measurements were below
the detection limits of 0.2 µSv h
-1
per cm
-2
.
7.5 Sample Analyses
During the survey period samples were collected at locations thought to represent possible
pathways of radioactivity into the food chain or external exposure. Samples of soil and
vegetables were collected from a Community garden in Rosyth where it is known that
seaweed has been used as a soil conditioner. Similarly, samples of sediment were collected
from the west bay at North Queensferry. The results are presented in Table 7.3. The
137
Cs
activities are consistent with environmental levels of 1960’s nuclear weapons testing fallout.
Table 7.3 Summary of the radio-analytical results from the samples collected in and around
North Queensferry and community garden
Sample
60
Co
137
Cs
Quality
Activity
Bq kg
-1
Quality
Activity
Bq kg
-1
2 σ
Soil Community Garden Plot 1 < 8.36E-02 5.43E+00 5.71E-02
Soil Community Garden Plot 2 < 5.62E-02 5.36E+00 5.55E-02
Soil Community Garden Plot 3 < 3.21E-01 6.54E+00 8.30E-02
Intertidal Mud < 3.93E-02 3.51E+00 8.16E-02
Green Leaf from Radish < 1.66E-01 < 3.83E-01
Radish < 4.13E-01 < 2.60E-01
White Chard < 4.29E-01 < 4.31E-01
Red Spinach < 4.23E-01 2.75E+00 3.29E-01

90
7.6 Occupancy levels
7.6.1 Occupancy data for the survey area
A summary of the types of activities that respondents participate in within the survey area
can be found in Table 7.4. The face-to-face interviews revealed that individuals to take part
in a range of terrestrial, aquatic and intertidal activities within the survey area (Table 7.4)
with the highest number of individuals taking part in rambling/walking (232 respondents) with
the most frequent walker spending 2,190 hours a year rambling/walking in Hound Point. For
the aquatic activities, sailing was the most popular (39 respondents) and dog walking was
the most popular intertidal activity (121 respondents).
Table 7.4 Summary of the activities and total number of respondents that take part in the
activities. The location of the maximum occupancy is also given.
Activity type Activity
Number of
responden
ts
Maximum
occupancy
(h y
-1
)
Location
(if provided)
Terrestrial Allotment 39 1825 Rosyth Allotments
Terrestrial Bee Keeping 6 91.25 Limekilns
Terrestrial Bird/Nature Watching 69 730 Charlestown, Limekilns
Terrestrial Bowling 23 312 Aberdour
Terrestrial Cycling 171 730
Terrestrial Dog Walking 185 1825 Silversands
Terrestrial Gardening 209 730 Rosyth
Terrestrial Golfing 43 1460 Blackness
Terrestrial Horse Riding 10 208 Burntisland
Terrestrial Playing 102 1825 Inverkeithing
Terrestrial Rambling/Walking 232 2190 Hound Point
Terrestrial Running 117 912.5
Terrestrial Sitting/Picnicking 132 728
Terrestrial Sports 42 730 Dalgety Bay
Terrestrial
Collecting Wild
Produce 28 104 Limekilns
Aquatic Angling – Sea 33 832 North Queensferry
Aquatic Angling - Freshwater 13 832 Kinghorn
Aquatic
Boat Maintenance
29 2920
Aquatic
Being on a Dive Boat
3 480
Aquatic
Canoeing
14 730 North Queensferry
Aquatic
Commercial
Fishing/Creeling
1 24
Aquatic
Commute via Boat
2 300
Aquatic
Diving
5 24 Burntisland
Aquatic
Jet Skiing
1 624
Aquatic
Paddling
41 100
South Queensferry to Society
Point
Aquatic
Rowing
10 208 North Queensferry

91
Aquatic
Safety Boat Duties
13 200
Aquatic
Sailing
39 520 Dalgety Bay
Aquatic
Sports Fishing
3 416 Rosyth
Aquatic
Sub-aqua Diving
1 4 Around Forth
Aquatic
Swimming
28 104 Around Forth
Aquatic
Power Boating
6 208 Granton
Aquatic
Water Skiing
0 0
Aquatic
Working on a Boat
7 2920 BRS
Aquatic
Forth Road Bridge
Work 1 2700
Forth Road Bridge
Intertidal
Bait Digging
11 52 Pettycur Beach, Kinghorn
Intertidal
Beachcombing
75 1440 North Queensferry
Intertidal
Boat Maintenance
16 900 Charlestown Harbour
Intertidal
Collecting Mussels
8 52 North Queensferry
Intertidal
Collecting Razor
Clams
2 208 North Queensferry
Intertidal
Collecting Seaweed
6 52 North Queensferry
Intertidal
Collecting Winkles
1 6
Intertidal
Crabbing
36 208 North Queensferry
Intertidal
Handling Creels
1 1095
Intertidal
Dog Walking
121 2190 Cramond
Intertidal
Fixing Moorings
7 208 Limekilns
Intertidal
Horse Riding
2 52 Limekilns
Intertidal
Paddling
74 160 Kinghorn
Intertidal
Playing
56 1248
Intertidal
Research/Educational
Purposes
4 24 Kinghorn/Aberdour
Intertidal
Rock Pooling
50 730 Forth – various
Intertidal
Wildfowling
0 0
Maintaining
equipment
Boats and Boating
Equipment
32 730 North Queensferry
Maintaining
equipment
Clothes and Overalls
29 365 Blackness
Maintaining
equipment
Diving Gear
7 12
Maintaining
equipment
Fishing Gear
19 365 North Queensferry
Maintaining
equipment
Swimming Gear
5 84
7.6.2 Occupancy rates within 1km of Babcock Rosyth Site (inside/outside
work or home)
Individuals living or working within 1km of BRS were asked to estimate how much time they
spend inside and outside their home or workplace. The results presented in Table 7.5 show
the time spent indoors and outdoors on an annual basis. Three individuals interviewed lived

92
within 1km of the BRS, the highest amount of time spent indoors was 3,650 h y
-1
and 1,460 h
y
-1
outdoors, individual spent the rest of the time outwith the survey area.
Table 7.5 Occupancy rates of those individuals working or living within 1km of the BRS.
Survey Id
Indoors at
home (h y
-1
)
Outdoors at
home (h y
-1
)
Indoors at
work (h y
-1
)
Outdoors at
work (h y
-1
)
R/A/ID/071 3650 1460 1460 85.8
R/A/ID/080 2920 1095
NA NA
R/A /BS/004 1825 730
NA NA
R/A/AW/23
NA NA
0 800
R/A/SB/002
NA NA
630 945
R/A/SB/003
NA NA
1125 450
R/A/SB/012
NA NA
84 0
R/A/SB/038
NA NA
0 1820
R/A/SB/043
NA NA
0 780
R/A/LE/003
NA NA
0 2080
R/A/LE/004
NA NA
0 2600
R/A/LE/014
NA NA
8.5 260
R/A /BS/005
NA NA
1300 780
R/A/DM/019
NA NA
4197.5 85.8
R/A/DM/022
NA NA
3650 130
R/A/DM/025
NA NA
3285 130
93
8 Doses to the Representative Person
8.1 Introduction
The information collected within the Habits Survey in 2015 has been used to estimate
retrospectively the doses to people living around Rosyth and in the surrounding area. The
data collected have identified individuals who consume locally producing food and who have
activities that may lead them to receiving an exposure to radioactive materials present in the
environment. It should be noted that the Rosyth discharges are small and well within
permitted discharge limits and that consequently the doses calculated for people are
correspondingly small and well within the public dose limit of 1 mSv per year for
retrospective assessment and 0.3 mSv for prospective assessment. Here the data are first
considered for the aquatic and terrestrial pathways separately for both internal and external
exposure and then a combined dose assessment is presented.
8.2 Aquatic Radiation Pathways
8.2.1 Internal exposure
The retrospective dose arising from internal exposure (via food sources from the aquatic
environment) has been used to determine the representative person from this pathway but
the doses reported here also include the contributions to the dose from the consumption of
food sources in the terrestrial environment and the external activities that people do in both
the aquatic and terrestrial environments (e.g. dog walking on intertidal surfaces or swimming
in open water etc.).
The retrospective dose to the representative person (97.5%) from internal aquatic exposure
is 1.51E-8 mSv with the dose rate to the most exposed person from this same exposure
pathway is 1.55E-8 mSv. In the case of those higher rate consumers (of locally produced
food only) the dose arises from the consumption of fish and molluscs with no significant
contribution from the external activities in either the aquatic or terrestrial environments.
8.2.2 External exposure
The retrospective dose arising from external exposure (via people’s habit activities in and on
the aquatic environment) has been used to determine the representative person from this
pathway but the doses reported here also include the consumption of food sources in the
aquatic and terrestrial environment and the external activities that people do in the terrestrial
environment (e.g. dog walking on intertidal surfaces etc.).
94
The retrospective dose to the representative person (97.5%) from external aquatic exposure
is 6.3E-15 mSv with the dose rate to the most exposed person from this same exposure
pathway is 6.1E-15 mSv. It should be noted that the total dose to the individuals in the higher
activity habits in the aquatic environment are still dominated by contributions from the
internal exposure pathway (the total dose being in the order of 7.9E-13 mSv). In the case of
those higher rate activities the dose arises from direct contact with equipment that may be
contaminated (96% of the dose), followed by activities on water at 3.6% of the dose and
finally activities in water at 0.6% of the dose.
8.3 Terrestrial radiation pathways
8.3.1 Internal exposure
The retrospective dose arising from internal exposure (via food sources from the terrestrial
environment) only has been used to determine the representative person from this pathway.
The doses reported also include the contributions to the dose from the consumption of food
sources in the aquatic environment and the external activities that people do in both the
aquatic and terrestrial environments. However, it should be noted that because of the
specific radionuclides released to atmosphere from the Rosyth site (principally
14
C and
3
H)
there is no or only very limited deposition to the terrestrial environment. This means that the
terrestrial internal exposure pathway is essentially 0 mSv from the anthropogenic releases
from Rosyth.
8.3.2 External exposure
External exposure (excluding direction shine on site)
The retrospective dose arising from external exposure (via people’s habit activities in the
terrestrial environment) only has been used to determine the representative person from this
pathway. The doses reported also include the contributions to the dose from the
consumption of food sources in the aquatic and terrestrial environments and the external
activities that people do in the aquatic environment. However, it should be noted that
because of the specific radionuclides released to atmosphere from the Rosyth site
(principally
14
C and
3
H) there is no or only very limited deposition to the terrestrial
environment. This means that the terrestrial internal exposure pathway is essentially 0 mSv
from the anthropogenic releases from Rosyth.
External exposure with direct shine including from onsite sources
95
The retrospective dose arising from external exposure (via people’s habit activities in the
terrestrial environment) only has been used to determine the representative person from this
pathway but the doses reported here also include the contributions to the dose from the
consumption of food sources in the aquatic and terrestrial environments and the external
activities that people do in the aquatic environment.
The retrospective dose to the representative person (97.5%) from external terrestrial
exposure is 7.5E-4 mSv with the dose rate to the most exposed person from this same
exposure pathway is 7.7E-4 mSv. In the case of those higher rate activity people the dose
arises almost entirely from the direct shine from the Rosyth site itself.
8.4 Overall combined radiation exposure
8.4.1 Total exposure (excluding direction shine on site)
The retrospective dose arising from all exposure pathways (e.g. via people’s habit activities
in and on the aquatic or terrestrial environments and the consumption of all foodstuffs
derived locally from the aquatic or terrestrial environments) has been used to determine the
representative person. The retrospective dose to the representative person (97.5%) is
1.51E-8 mSv with the dose rate to the most exposed person from the same exposure
pathways being 1.55E-8 mSv. In the case of those higher rate exposed person the dose is
dominated by the internal aquatic environment doses from ingestion of molluscs (1.5E-8
mSv) and fish (7.4E-10 mSv).
These doses are very small in comparison with the 1 mSv public dose limit. They are for a
retrospective dose assessment using PC CREAM modelled dispersion of the actual reported
discharges from Rosyth in RIFE 2013, the consumption of locally produced food and the
habit activities in the terrestrial and aquatic environments in the local area around the Rosyth
site.
8.4.2 With direct shine including from onsite sources
The retrospective dose arising from all exposure pathways (e.g. via people’s habit activities
in and on the aquatic or terrestrial environments and the consumption of all foodstuffs
derived locally from the aquatic or terrestrial environments) has been used to determine the
representative person. The retrospective dose to the representative person (97.5%) is 7.5E-
4 mSv with the dose rate to the most exposed person from the same exposure pathways is
7.7E-4 mSv. In the case of those higher rate exposed people the dose is dominated by the
external terrestrial environment doses from the direct shine from the Rosyth site.
96
These doses are very small in comparison with the 1 mSv public retrospective dose limit.
They are for a retrospective dose assessment using PC CREAM modelled dispersion of the
actual reported discharges from Rosyth in RIFE 2013, the consumption of locally produced
food and the habit activities in the terrestrial and aquatic environments in the local area
around the Rosyth site.
In summary, the key point of exposure excluding shine from Rosyth is the aquatic internal
pathway. However including shine from Rosyth the external terrestrial pathway becomes the
key point of exposure.
97
9 Comparisons with the previous survey
9.1 Introduction
The results from this 2015 Rosyth Habits Survey can be compared with results from the last
Habits Survey, undertaken in Rosyth in 2010 by CEFAS. The results have been reported in
Chapters 5 and 6 for both the postal survey and the face-to-face survey and comparisons
are made. No comparisons have been made for the postal survey as a postal survey was
not undertaken in 2010.
The aquatic and terrestrial survey area in the 2015 survey area remained unchanged from
the 2010 survey. However full face-to-face interviews were completed within Kinghorn and
Newhaven area, east of the Kincardine Bridge in the 2015 survey. This was different to the
2010 survey with no full face-to-face surveys being completed within the Kinghorn and
Newhaven areas in 2015. In addition, meetings and focus groups were able to provide
additional data and validate the findings of the face-to-face surveys.
9.2 Aquatic Survey
9.2.1 Postal Survey: Internal Exposure
A postal survey was undertaken in the 2015 survey and it was reported that respondents
consumed fish (cod, salmon, haddock and mackerel) more frequently than crustaceans
(crab and lobster) and molluscs (mussels). The majority of respondents sourced their
fish/crustaceans/molluscs from supermarkets (40 %) but fish was sourced from local shops
and markets (12 %). This is discussed further in Section 5.2.1. A postal survey was not
undertaken in 2010 therefore there are no data for comparison.
9.2.2 Postal Survey: External Exposure
It was reported that of the respondents who undertook aquatic activities, the highest number
of respondents participated in beach activities (walking, paddling, beach combing) followed
by outdoor swimming and water sports. This is discussed further in Section 5.2.2. A postal
survey was not undertaken in 2010 so there are no data for comparison.
9.2.3 Face-to-Face: Adult Consumption Rates - Internal Exposure
In 2015 the mean consumption rate for the adult high-rate group in the face-to-face
interviews is substantially increased for fish, crustaceans, molluscs and wildfowl compared
with 2010. The main species of fish consumed by adults were mackerel and cod in 2010

98
compared with mackerel, salmon and cod in 2015. The main crustaceans consumed by
adults in 2010 were brown crab and common lobster, this remained the same in 2015. In
2010 the only mollusc consumed by adults was winkles compared with mussels in 2015. It
should be noted that one person interviewed consumed shellfish from Dalgety Bay. In 2010
the main species of wildfowl consumed by adults were wigeon, mallard, pink-footed goose
and teal compared with only one person identified who consumed wildfowl from outwith the
survey area in 2015. The origins of the wildfowl were not known. The consumption of marine
plant/algae by adults remained unchanged with no consumption identified in 2010 and in
2015.
A comparison between 2010 and 2015 adult consumption rates of aquatic foods in the face-
to-face interviews is presented in Table 9.1.
Table 9.1 Comparison between 2010 and 2015 adult consumption rates of aquatic foods
2010 2015 National/
Generic
Food Group
Number of people in
the high-rate group
Maximum
consumption rate (kg
y
-1
)
Mean consumption
rate (kg y
-1
)
Number of people in
the high-rate group
Maximum
consumption rate (kg
y
-1
)
Mean consumption
rate (kg y
-1
)
Mean (kg y
-1
)
Fish
8 35.0 17.0 1 109.20 109.20 15.0
Crustaceans
10 7.8 4.6 1 31.20 31.20 3.5
Molluscs
4 5.8 5.8 1 15.60 15.60 3.5
Wild Fowl
3 8.3 4.8 0 26.00 26.00 ND
9.2.4 Face-to-Face: Children and Infants’ Consumption Rates - Internal
Exposure
The consumption rate of fish, crustaceans, molluscs and wild fowl for children and infants
was not determined in 2010 therefore there is no data for comparison. There was no
consumption of crustaceans or wildfowl identified for children and infants in 2015. The only
fish species consumed by children was mackerel (self-caught in the Forth) in 2015 and fish
consumed by infants were cod and salmon. The same infant also consumed mussels in
2015.

99
Refer to Section 4.10.2 for further details.
9.2.5 Face-to-Face: Adults Intertidal Occupancy - External Exposure
In contrast to the 2010 survey external exposure was divided into four distinct groups:
intertidal activities, aquatic in water activities, aquatic on water activities and the handling of
equipment - all of which are discussed in further detail in Section 5.10.
In 2015, handling of equipment by adults within the survey area was reported. These
activities included boat maintenance, handling clothes and overalls, diving gear, fishing gear
and outdoor swimming gear. In 2010, the handling of fishing gear was determined as a
mean occupancy-handling rate for the high rate group (h y
-1
) as 674. This was observed to
be substantially lower although the handling of fishing gear is only a sub category of the
handling of equipment in 2015 so this may account for the substantial increase.
Activities taking place in or on the water were assessed differently in 2015 with mean
occupancy rates and 97.5th percentile rates determined. In 2010 survey these data were not
determined.
Handling of sediment for adults was not identified as a significant pathway determined within
the 2015 survey as there was no difference in dose on different sediment types.
These data are presented in Table 9.2.
Table 9.2 The 2015 aquatic external exposure pathways for adults
Activity
Number of
people in the
high rate
group
Observed
maximum for
the rate
group (h y
-1
)
Observed mean for
the high rate group
(h y
-1
)
Intertidal
5 2930 2664
Aquatic (in water)
1 106 106
Aquatic (on water)
1 3416 2968.8
Handling
equipment
1 1460 1460

100
9.2.6 Face-to-face: Children and Infants Intertidal Occupancy - External
Exposure
As with the adult intertidal occupancy, in contrast to the 2010 survey, external exposure was
divided into four distinct groups: intertidal activities, aquatic in water activities, aquatic on
water activities and the handling of equipment - all of which are discussed in further detail in
Section 5.10.
In 2015 the intertidal occupancy for children and infants was recorded. These data are
presented in Table 9.3.
As with the adults, handling of sediment for children and infants was not recorded in the
2015 survey.
Activities taking place in or on the water were assessed differently in 2015 with mean
occupancy rates and 97.5th percentile rates determined in comparison to these data not
being determined in 2010.
In 2015 one person in the infant age group was identified and none were identified in 2010.
Table 9.3 The 2015 aquatic external exposure pathways for children and infants
Activity Number of
people in the
high rate group
(h y
-1
)
Observed
maximum for the
high rate group (h
y
-1
)
Observed mean for
the high rate group
(h y
-1
)
Child (6 - 15 years old)
Intertidal
5 1556 358.59
Aquatic (in water)
1 104 104
Aquatic (on water)
1 1267 1267
Handling equipment
1 1095 1095
Infant (0 - 5 years old)
Intertidal
2 1248 1248
Aquatic (in water)
1 52 52
Aquatic (on water)
1 72 72
Handling equipment
0 0 0

101
9.3 Terrestrial Survey
9.3.1 Postal Survey: Internal Exposure
A postal survey was undertaken in 2015 and it was determined that dairy products (milk,
cheese and yoghurt) was the most frequently consumed food type. Wild meat (rabbit and
game) was the food type least frequently consumed. The supermarket was reported as
being where respondents most frequently sourced terrestrial food items although local shops
and markets were also used. Refer to Section 5.2.1 for further detail.
No postal survey was undertaken in 2010 therefore there are no data to make comparisons.
9.3.2 Postal Survey: External Exposure
The most frequently selected terrestrial activities within the postal survey in 2015 were
greenspace walking, urban walking and allotment/gardening. A total of 61 % of respondents
participated in outdoor walking daily. Refer to Section 5.2.2 for further detail.
No postal survey was undertaken in 2010 therefore there are no data to make comparisons.
9.3.3 Face-to-Face: Adult Consumption Rates - Internal Exposure
Consumption rates increased in the 2015 survey in the vegetables (green) food group in
comparison to the 2010 survey.
Consumption rates decreased in the 2015 survey in the following food groups: vegetables
(root), vegetables (potatoes), fruit (domestic), meat (beef) and meat (poultry) in comparison
to the 2010 survey.
Eggs, rabbit/hare and wild fungi were not identified in 2010. This remained unchanged in
2015.
Locally produced milk, pig meat or fresh water fish were not identified as being consumed in
2010 compared to one person identified in 2015 who kept his own brown trout in his garden
in North Queensferry.
A comparison between the 2010 and 2015 mean consumption rates for adult consumption of
the terrestrial food groups is presented in Table 9.4. It is noted from Table 9.4 that the total
consumption of these food groups (kg y
-1
) has decreased.
Table 9.4 Comparison between 2010 and 2015 mean consumption rate for adult
consumption of terrestrial food groups (kg y
-1
).
Food group 2010 2015 National FSA National diet survey

102
Vegetables – Green 39.2 68.3 15 59 (all veg)
Vegetables – Root 45.6 38.7 10
Vegetables - Potatoes 73.4 46.0 50
Fruit - Domestic 60.6 38.7 20 34 (all fruit)
Fruit - Wild 0.7 ND 7
Meat – Beef 47.3 20.8 15 40.15 (all meat and fish)
Meat - Game ND ND 6
Meat - Poultry 1.4 10.6 10
Meat - Sheep 7.9 ND 8
Meat - Honey 8.8 ND 2.5
9.3.4 Face-to-Face: Children and Infants Consumption Rates - Internal
Exposure
No comparison of consumption rate was made for children as there was no consumption
rate identified in 2010. The mean consumption rates for children and infants is presented in
table 9.5.
Table 9.5 The mean consumption rates (kg y
-1
) for children and infants in the 2015 Habits
Survey, national values and estimated consumptions rates based on adult data (Table 9.4).
*Values derived from ratio used in RIFE 2014 Table X2.1.
Food group 2015
National*
(children)
National*
(Infants)
Consumption
rates for
Children
Consumption
rates for
Infant
Vegetables – Green 9.1 6 3.5 27.3 16.0
Vegetables – Root 2.6 6 5 24.2 19.3
Vegetables -
Potatoes
12.5 45 10 41.2 9.2
Fruit - Domestic 39 15 9 29.8 17.6
Fruit - Wild ND 3 1 ND ND
Meat – Beef ND 15 3 20.8 11.6
Meat - Game ND 4 0.8 ND ND
Meat - Poultry ND 5.5 2 5.9 2.5
Meat - Sheep ND 4 0.8 ND ND
Honey ND 2 2 ND ND

103
9.4 Direct Radiation Survey
Table 9.6 Comparison between 2010 and 2015 occupancy rates for people living and
working within the direct radiation area (h y
-1
)
2010 2015
Highest Total 8100 5110
Highest Indoor at home 7800 3650
Highest Outdoor at home 1800 1460
Highest indoor at work ND 4198
Highest outdoor at work ND 2600
In 2015 the highest total occupancy rate decreased from 2010.
In 2015 the highest indoor occupancy rate decreased from 2010.
In 2015 the highest outdoor occupancy rate decreased from 2010.
Table 9.6 presents the comparisons between 2010 and 2015 survey occupancy rates for
people living and working within the direct radiation area (h y
-1
). In 2010 the highest total
occupancy rate and highest indoor occupancy rate were both for one adult resident
individual. In 2015, one resident was identified with the highest indoor (3650 h y
-1
) and
outdoor occupancy (1460 h y
-1
) with rest of the time spent outwith the survey area. In 2010
the highest outdoor occupancy rate was one adult resident who worked in the area. In 2015,
occupancy rates for those working within the direct radiation area were determined. The
highest indoor occupancy for one individual at work was 4198 h y
-1
and a different individual
had the highest outdoor occupancy which was 2600 h y
-1
. There is no comparison as this
was not looked at during the 2010 survey.
Children and infants were not identified within the high-rate groups in the 2010 survey, this
remained unchanged in the 2015 survey.
104
10 Recommendations and Suggestions for Monitoring
Programme Changes
10.1 Introduction
The Rosyth Habits Survey presents results from three main sources of community
engagement: (i) Postal questionnaire (n=156); (ii) face-to-face surveys (n=526); and (iii) a
number of meetings, informal contacts and focus group meetings. These data have been
supplemented with radiometric surveys including: (i) a car-borne gamma spectrometry
survey (n=18,000); (ii) in situ gamma dose rate (n=45); (iii) additional sampling with
laboratory based gamma spectrometry (n=8); and (iv) Beta skin dose assessments (n=6).
Prior to the survey, there was discussion with the Health Physicists of the Babcock
International Group who operate the site. This provided an update on relevant site
operations and activities since the previous 2010 Habits Survey and planned changes in site
operation over the next five years. As in previous surveys of human habits around the
Rosyth site, airborne discharges remain below detection limits although future change in site
usage may alter that position.
Routine surveys monitor gamma doses over sediment, fish and shellfish (RIFE Report 2014
for 2013 data) with further monitoring undertaken by the Babcock International Group. The
sampling activities reported in this report confirmed that concentrations of radionuclides from
the site remain extremely low and below detectable activities for
60
Co.
137
Cs activity
concentrations measured were consistent with levels anticipated from historical nuclear
weapons testing fallout.
Here the main findings and recommendations are presented.
10.2 Conclusions and Recommendations
SEPA’s current monitoring programme provides satisfactory coverage to enable assessment
to be made of the impact of Rosyth discharges on the public.
Retrospective dose assessments indicate that the doses received by the representative
persons and most exposed individual(s) are very small in comparison with the 1 mSv public
dose limit for all pathways identified and considered. The highest dose estimated was from
direct shine from on-site sources (0.00077 mSv).
In conducting the survey, attention was given as to whether the correct food groups, area
and frequency are being monitored. Consideration could be given to the following areas:
105
(i) Gamma dose rates could be reported as terrestrial gamma dose rates, i.e. with
the cosmic and intrinsic component removed. This will provide a better estimate
of dose from any contaminated surfaces and provide data that is more consistent
with European partners.
(ii) Overall fish consumption rates are higher in 2015 compared with 2010. Mussels
appear to be the more popular mollusc collected and consumed in 2015
compared with winkles in 2010. Consideration should be given to the inclusion of
mussels within routine monitoring, especially in North Queensferry harbour. This
could be considered to be monitored from North Queensferry harbour and
analysed by gamma spectrometry.

106
References
Hessayon D. G. (2014). The new vegetable & Herb expert. Transworld publications Ltd
2014, London.
Garden Forum Horticulture (2009). http://www.gardenforumhorticulture.co.uk/gyo/Square-
Foot-Gardening.pdf. Accessed on: 29/09/2015.
ICRP (2006). Assessing Dose of the Representative Person for the Purpose of the Radiation
Protection of the Public. ICRP Publication 101a. Ann. ICRP 36 (3), 2006.
ICRP (2007). The 2007 Recommendations of the International Commission on Radiological
Protection. ICRP Publication 103. Ann. ICRP 37 (2-4), 2007.
ICRU 57 (1998). Conversion Coefficients for Use in Radiological Protection Against External
Radiation (1998). International Commission on Radiation Units and measurements,
Maryland USA.
NDAWG (2013). Use of Habits Data in Prospective Dose Assessments. NDAWG Guidance
Note 7. Available from http://ndawg.org/.
Public Health England (2008). PC CREAM.
Smith, K. R. and Jones, A. L. (2003). Generalised Habit Data for Radiological Assessments.
NRPB-W41. NRPB, Chiltern.
Scottish Natural Heritage, (1978). Beaches of Fife.
107
