
1
Biology 212: Anatomy and Physiology II
Lab #4: CARDIOVASCULAR PHYSIOLOGY AND THE
ELECTROCARDIOGRAM
References: Saladin, KS: Anatomy and Physiology, The Unity of Form and Function 7
th
(2015). Be sure you read and understand Chapter 19 before beginning this lab.
Overview of the Cardiovascular System:
Our heart is an amazing organ that pumps blood throughout our bodies for a lifetime. If your
heart beats 72 times a minute for 78 years, you will have a heart that has beat/contracted
approximately 3 billion (3,000,000,000) times. How does the heart work? If it is injured or damaged
at some point, how will your physician diagnose what is wrong and strategize ways to improve the
health of your heart or prescribe exercise after a heart attack (cardiac rehabilitation)?
Electrocardiograms (ECGs) provide important information about the function of your heart. In this
exercise, you will learn the fundamentals of the electrical activity of the heart and relate these
activities to the mechanical actions of pumping. You will also become familiar with your peripheral
circulation and how it is dependent on a beating heart, ventricular ejection, and patent vessels.
The cardiovascular system encompasses the heart, blood vessels, and blood contained in this closed
system. There are two sets of arteries, low pressure pulmonary trunk and high pressure aorta
(pulmonary and systemic circuits), that deliver blood to the lungs and body respectively. Each
arterial system is really a pressure reservoir to maintain the pressure gradient generated by the
pumping of the heart during systole and ejection of blood into these two circuits. As seen last week’s
in lab, the systemic system is vitally responsible for delivery of oxygenated blood to the body and the
delivery of carbon dioxide rich deoxygenated blood to the lungs. Pulmonary circuit sends blood to
the lungs and back to the left atrium. Your pulse is evidence of the blood pressure generated during
systole and ejection into the aorta and well as the resultant perfusion into your finger.
Objectives:
1. Compare and contrast values for a normal heart rate with tachycardia and bradycardia.
2. For a volunteer determine pulse rate by palpating the radial artery and with a finger
pulse transducer
3. Describe the origin of cardiac autorhythmicity and the major landmarks of the conduction
pathway within the heart.
4. Define what ECG stands for, and how the ECG is generated in terms of a change in
voltage (mV) and time (seconds).
5. Label features of the ECG (P-QRS-T waves) and how the waves correlate with the
mechanical events of the cardiac cycle and the events occurring in the conduction pathway.
6. Compare and contrast intervals verses segments on an ECG in this regard.
7. For a volunteer use the ECG, Lead I, and five R-R intervals to determine heart rate.
8. Compare and contrast these clinical terms: nodal sinus rhythm, arrhythmia, heart block,
and fibrillation
2
Manual determination and interpretation of pulse rate
Heart rate at rest typically falls into the range of 55 to 85 beats/minute (BPM). A heart rate over 100
beats per minute is usually considered to be tachycardia (fast). A heart rate under 60 beats/minute
is usually considered to be bradycardia (slow). If you are exercising, your oxygen demands increase
and the heart rate and cardiac output increases to supply more blood and oxygen to your exercising
muscles. At such times, an elevated heart rate is normal. If you are an athlete or sleeping, a slower
heart rate is normal. Any heart rate above 200 BPM is dangerous even when exercising, and a pulse
lower than 40 BPM is never safe.
For the following exercises, we will be using a data acquisition system to collect clinical information
about you and your lab partners. These exercises will be carried out using your lab instructor’s
computer connected to the data acquisition system. The exercises will be run as demonstrations for
groups of 4-6 students. You will receive a hard copy of your group’s information.
Exercise 1a : Palpation of radial arterial pulse rate.
This exercise assumes that when the heart depolarizes and contracts it ejects a volume of blood that
leaves the ventricle. This volume creates a pressure wave as the ejected blood moves distally from
the heart. When the waves arrives at your wrist it can be felt by putting light pressure on the radial
artery.
1. Select a volunteer from your group of 4-6 students and locate the radial artery or ulnar artery
in the wrist. (Usually the ulnar pulse is the harder to find.)
2. Apply firm pressure over the radial artery so you can feel pulses. Count the number of pulses
in 15 second and calculate the number of pulses per minute:
(_________pulses/15 seconds X 60 seconds/minute = ________ pulses/ minute).
Exercise 1b: Determination of pulse with a pulse transducer.
The pulse transducer is a plethysmograph that fits over your finger and detects the movement/pulse
wave of blood traveling through small arteries in your finger. This pressure wave is detected and
converted to a voltage change that can be recorded by the system. Note the distribution of arterial
blood flow in the hand. Fingers receive blood through the superficial palmar arch as well as through
the deep palmar arch from both the radial and ulnar arteries. This same pulse wave then travels into
the end of your fingers. Your instructor will record this data with your group’s volunteer.
1. Place the nickel-sized pressure pad of the pulse transducer on the tip of the middle finger of
either hand of the volunteer. Use the Velcro strap to make sure it is firmly attached but not
tight enough to cut off circulation. Rest this hand in your lap with the palm up.
2.
Start recording. Remind the volunteer to remain relaxed and as still as possible.
Make sure the volunteer is still facing away from the monitor. BE SURE to observe that
the x-axis represents time (cm/second or box/second), you will need to understand this scale
to determine the pulse rate.
3. Highlight a record that includes a minimum of five pulses and print the results. Determine
the pulse rate (beats/min) on this tracing, using this formula:
( 5 pulses/__________ seconds X 60 seconds/minute = ________ pulses/ minute).

3
4. While recording with the finger pulse transducer, put pressure on the radial artery. Observe
that the amplitude (size) of the finger pulses becomes diminished until the pressure on the radial
artery is removed.
Did the numbers for your pulse rate obtained by the radial pulse method agree with those of the finger
pulse transducer? Explain your answer.
How did compression of the radial artery affect blood flow to the finger? Explain your answer.
Cellular Origin of Depolarization and the Cardiac Conduction System.
All vertebrate hearts are said to be myogenic. (Break the word apart, and you will understand its
meaning. The root myo- means muscle, and in this case, it means the heart muscle proper is the
source for the signal to contract. The second part of the word -- genic -- means origin. The heart is
the source of the signal to contract; it does not require a stimulation from axons originating in the
nervous system like a skeletal muscle does, nor does it rely on endocrine signals for initiation of the
depolarization. Indeed during a heart transplant surgery a heart is removed from one person, and
continues to beat with no neural inputs at all during and the autorhythmicity continues after
placement in the second organ recipient. However, both the nervous system and the endocrine
system (as well as some chemicals) can modify the rate at which the heart beats in the transplant
recipient. Indeed, with respect to atrial natriuretic hormone the heart can actually be an endocrine
organ.
The myocardium represents the layer of contractile muscle cells in the heart that generates the
contraction force that pushes blood through the pulmonary or systemic circuits. Autorhythmic cells
depolarize spontaneously without external stimulation and create the depolarization that the
contractile cells need to function. In a healthy heart the cells of the sinoatrial (SA) node are quite
permeable to sodium. When enough sodium leaks into the sarcoplasm, voltage gated sodium, calcium
and potassium sequentially open creating depolarization followed by repolarization.
This pacemaker depolarization in the SA Nodal cells pass through the gap junctions that link the
cells of the heart into an electrical syncytium, this is followed by a wave of repolarization. There is a
very specific conduction pathway that a depolarization must follow, deviations or alterations in this
pathway can be fatal. Any abnormal depolarization in the cells of the heart is called an AHHRYTHMIA.
Exercise 2. Landmarks of the Cardiac Conduction System:
Obtain one of the large brown heart models with the conduction system outlined. (You probably
looked at this model last week when identifying the features of heart anatomy.)
1. The pacemaker of the heart is the sinoatrial (SA) node; #73) located where the superior
vena cava empties into the upper right atrium. It is a green spot on the upper surface of the
right atrium.
2. When the SA node depolarizes, its sends its wave of depolarization through the gap
junctions to adjacent and ever more distal cells laterally over both atria and obliquely
permitting the atria to depolarize, contract, and eject blood through the AV valves into the
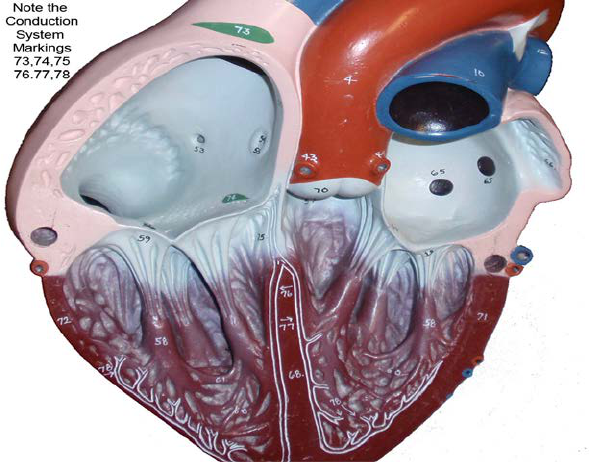
4
ventricles. the AV Node. The atrioventricular (AV) node; #74) s located on the lower
medial floor of the right atrium/atrioventricular septum and represents the location where
the depolarization can pass from atria into ventricular septum.
3. After the AV node the depolarization travels into the atrioventricular bundle (i.e., Bundle
of His, #75) on its pathway down the septum towards the ventricular myocardium.
4. The atrioventricular bundle passes into the interventricular septum and branches into the
left bundle branch (#77) that deliver the wave of depolarization into the septum and left
ventricular wall, and the right bundle branch (#76) that delivers the depolarization to the
right ventricular wall.
5. The bundle branches divide into fine Purkinje fibers (#78) in the septum along the left
bundle branch and after the apex of the heart. These fibers distribute the wave of
depolarization to the individual contractile cardiomyocytes where contractile force for
ventricular ejection is finally generated.
6. The wave of depolarization moves from the apex in a superior direction until it reaches the
atrioventricular septum, which “should” prevent passage of the depolarization back into
the atrium.
7. The wave of depolarization is followed by a wave of repolarization and cardiac rest
(diastole) making the cardiac cells ready to receive the next depolarization for the next
heart cycle. It is important to remember that perfusion of heart tissue (oxygen delivery)
occurs mostly during diastole.
The Electrocardiogram (ECG)
The electrical waves of depolarization and repolarization that spread across the heart can be
detected on the surface of the skin. The output, or record of cardiac depolarization across time is a
graph called an electrocardiogram (ECG or EKG). An ECG is the record of net differences in voltage
between the positive (+) and negative (-) electrodes. The connection between the two electrodes is
called a lead. This means the time variable is plotted on the x axis and the voltage difference (mV) is
5
on the y axis. If the depolarization wave (summation of all cardiac cell potentials) is moving from the
negative electrode towards the positive electrode, the record will produce a positive or upward ECG
deflection. When the wave of depolarization moves towards the reference electrode, the recording
will be a negative ECG wave deflection. If the wave of depolarization moves perpendicular to the
positive and negative electrodes it is called isoelectric (no net positive or negative ECG deflection).
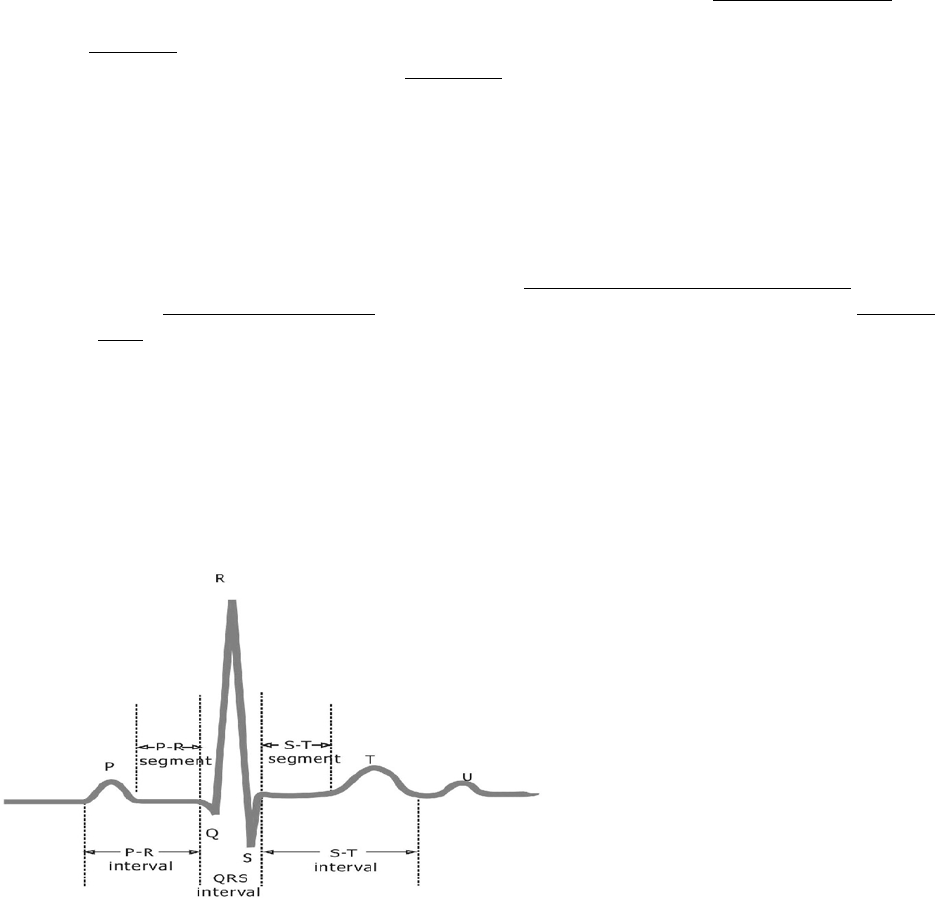
The normal ECG has a series of distinct waves called deflection waves (P wave, QRS complex and T
wave). Each part of the ECG represents a specific electrical event in the ventricle. The first wave
deflection generally observed on the ECG is the small P wave and is produced when SA node causes
the right and then the left atria to depolarize. The QRS complex represents ventricular
depolarization and the T-wave represents the electrical signature of ventricular repolarization.
The QRS complex consists of three deflections. The first negative ventricular deflection is called
the Q-wave. The first positive deflection from the ventricle is called the R-wave. The first negative
deflection after the R-wave is called the S-wave. If there is no observed Q-wave you may observe a
RS only. If there is no positive R-wave, the negative deflection is called a QS-wave. The QRS complex
marks arrival of the wave of depolarization into the septum and ventricular walls. Larger wave sizes
(i.e., large voltage amplitude change) are caused by either a larger muscle mass of the ventricles or
the fact that the wave of depolarization is moving directly towards the electrode. The QRS complex
is typically about 0.08 seconds in duration. IT IS VERY IMPORTANT to remember that depolarization
(QRS) comes BEFORE myocardial contraction. IT IS ALSO very important to remember that just
because the heart depolarizes, blood need not be ejected into the pulmonary artery or aorta (ECG
rate does not always equal the pulse rate!)
The T wave is the final noteworthy
deflection on the trace. This wave marks
the change in voltage created by
ventricular repolarization.
An “interval” includes both a wave and
the baseline period between waves (e.g.,
PR interval, QRS interval, ST interval).
The time it takes for the impulses to
travel from the SA node and enter the
septum is represented by the PR-
segment (typically about 0.16-0.18 sec).
The R-R interval is one of the most
important, if your heart rate is 60
beats/minute the R-R interval is 1 second. If the average RR interval of five cardiac cycles was 0.5
seconds, the heart rate would be 120 beats/minute (1 beat/ 0.5 sec X 60 seconds/minute = 120
beats/minute or tachycardia).
A “segment” is a period of time when no waves occur on an ECG trace from the end of one wave to
the beginning of the next wave or complex The PR segment tells the clinical how long it takes for the
wave of depolarization to pass through the AV node. The ST segment represents the amount of time
that the ventricle is depolarized and contracting.
You might assume the atria do not go through repolarization based on the above description, but that
would be the wrong assumption. The atria do repolarize, however the mass of the atria is very small
relative to the mass of the ventricles and this electrical repolarization event is obscured (hidden) by
the depolarization of the ventricles and the QRS complex.
6
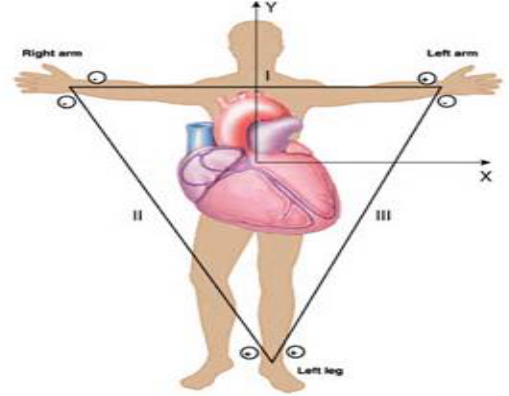
The appearance of the ECG is also a function of where (anatomically) the reference and recording
electrodes are placed, this permits the evaluation of electrical changes across each very specific
axis. Each pair of location is called a LEAD, and there are many different leads that can be used
clinically. Einthoven's triangle represents three (I, II and III) when the positive and negative
electrodes are placed two these three locations (right shoulder, left shoulder or left hip). These are
the three most basic leads used clinically, although if you study to become a cardiac rehabilitation
specialist you will learn many more. These three axes approximates an equilateral triangle with
the heart at the center.
Lead I: negative on right shoulder, positive on left shoulder
Lead II: negative on right shoulder, positive on left hip
Lead III: positive on left hip, negative on left shoulder
For a patient in a bed at rest, lead I is popular because the patient can move about relatively freely
and it is easy for the clinician to determine if the electrodes are attached properly. We will use
primarily Lead I later in this lab activity. Remember that electrolytes in the body conduct electricity
freely so placement of an electrode in the left hip will look just like it would in the left knee or the
left foot.
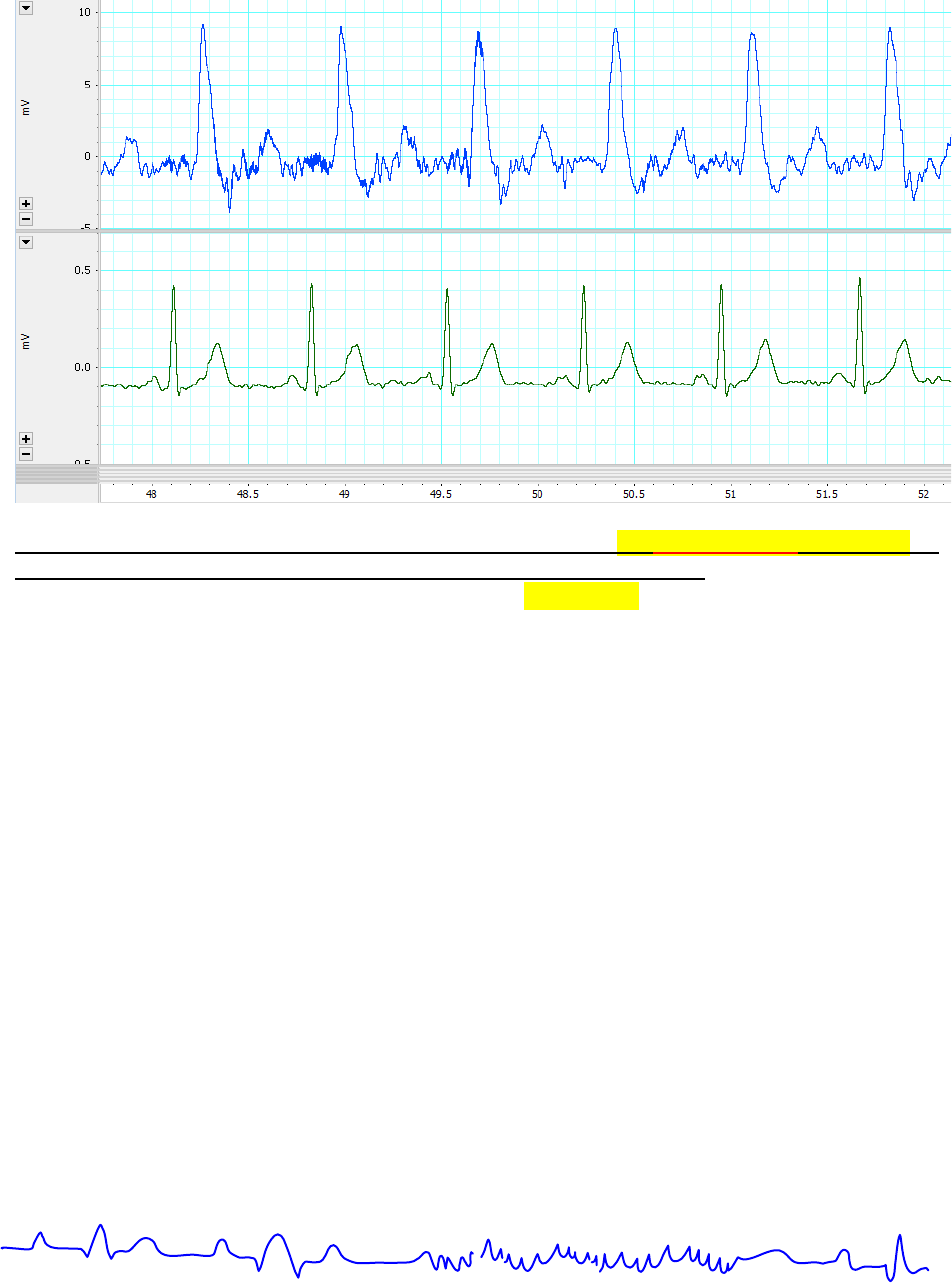
Exercise 3: Examine the sample finger pulse and ECG below to see how calculations are
made. Note that the X-axis across the bottom of these recording shows how each parameter
changes across time (seconds). Remember to convert events per second to events per minute and
to base estimate on an average of five values. Also remember that ECG Q-waves are not always
observed. Your instructor will show you how to calculate these values using a ruler or with the
box method.
7
Compare your Calculations from this ECG to the answers below
Pulse Rate: RR-Interval: Heart Rate: PR-Interval: ST-Interval: .
Be Able to do the Correct Math and calculate an answer for lab exam.
Answers: 85 beats/minute; 0.71 seconds; 85 beats/minute; 0.11 seconds; 0.26 seconds
Depending on how you did it, your answers should be within about about 5% from these values.
Heart Block and Fibrillation:
Heart Block is a failure to properly transmit the wave of depolarization through any part of the
conduction system. Heart block is a pathological condition resulting from an inability to enter or exit
the AV node or to pass through the Bundle of His or Bundle Branches. Damage to the conduction
system can lead to a heart block. Normal healing of any damage causes cardiac muscle to be replaced
by connective tissue, and connective tissue is not autorhythmic and does not readily conduct action
potentials. So the damage can be permanent to the conduction system. Total heart block is when the
signal from the atria to the ventricles is blocked completely—your SA node is no longer the
pacemaker for the ventricles. With total heart block the authorhythmicity of other slower secondary
pacemaker cells in the heart (i.e. AV node or apex) determines the heart rate and the heart rate
becomes very slow (20-40 beats per minute).
Fibrillation represents is anarchy with respect to the pathway of depolarization and contraction is
random and unorganized. If it occurs in the ventricles, no blood would be pumped to the body (i.e.,
brain) resulting in unconsciousness and potential death. Both conditions, heart block and fibrillation,
can be easily detected by the ECG (electrocardiogram). If you observe an apparent fibrillation pattern
in any ECG you look at, ALWAYS double check to see that your electrodes are all firmly attached to
your volunteer or clinical patient. These data collection systems can and do pick up electrical
interference, so if the patient has lots of static electricity in their clothes or metal jewelry you may
not be able to collect a clean ECG recording.
Normal Sinus Rhythm ECG Fibrillation (Saw Tooth ECG Pattern) Convert to Normal ECG
8
Exercise 4. Collect a Finger pulse and ECG trace for your group’s volunteer. Identify the
wave deflections on your trace. You should also be able to determine separate RR intervals
(average of 3 R-Rs is good enough for the lab exam, average of 5 will give you a more
clinically accurate value) and determine an average heart rate (beats/minutes) using either
a ruler or the box method. Your lab instructor will show you how to measure heart rate in
lab. On the lab exam you will be able to choose the method (box or ruler) that you wish to
use for your calculations, both tools will be available on the test. You also need to
determine and interpret the PR intervals and the ST intervals (seconds).
Your instructor will collect a ECG and Finger Pulse data for each group as a series of
demonstrations in this lab and provide each group with a paper recording so they can
perform the desired measurements.
1. Connect each electrode lead [white(-), black(+), and green(ground)] to the electrode gel
clips. Place the electrode gels on the wrists and ankle of the volunteer: positive lead (black)
on left wrist, negative lead (white) on right wrist and ground (green) on right ankle or
abdomen. This is the standard electrode placement for Lead I on the ECG. Attach the
fingerpulse transducer to their finger with the palm facing up.
2. Start recording and adjust electrodes until a suitable ECG and finger pulse record is
obtained. Remind the volunteer to remain relaxed and as still as possible throughout the
duration of the sampling period.
3. Highlight the ECG trace, and print off the results.
4. Calculate the ECG waves, intervals, segments and heart rate using the ECG record for your
group.
Exercise 6. Discuss the following physiological problems with your lab partners so you can
better understand how ECGs are used to explain cardiovascular function (See ECG #1,2
and 3 below). You may also wish to do this at home when you study this laboratory
manual.
With respect to the P, QRS, and T waves: When does peak ventricular force and ejection of
blood into the pulmonary trunk or aorta occur? When does cardiac perfusion occur? If you
compare ECG #2 to ECG #3, when the heart rate increases what is decreased more, the time
between the end of the T-wave and next QRS (T-Q Interval; diastole), or the time between S-T
Interval (systole)? Why does tachycardia during exercise often exacerbate hypoxia in the heart
and lead to conduction problems, fibrillation or a heart attack?
Does the electrical depolarization event precede the arrival of the pulse distally at the finger?
Consider a person with a long arm (six foot tall WSU Women’s Basketball player) with the arm
9
of a five foot tall WSU Gymnast. Would the delay between ECG and pulse wave arrival in the
finger for the tall person be shorter, longer or the same relative to the tall person? Why?
Why should the clinician NEVER consider atrial depolarization rate as a measure of heart rate?
Does ventricular depolarization always follow atrial depolarization? What is the best term to
describe this aberration: Arrhythmia, Heart Block or Fibrillation?
If the left AV Valve did not open properly during diastole (stenosis) so that no ventricular filling
occurred, and the mostly empty ventricle contracted during systole. Why might you see
ventricular depolarization on the ECG but observe not pulse in the finger? Therefore, why does
the clinician always need to verify that heart depolarization rate is the same as pulse rate? Why
is it easier to monitor heart depolarization rate in the intensive care however?
10
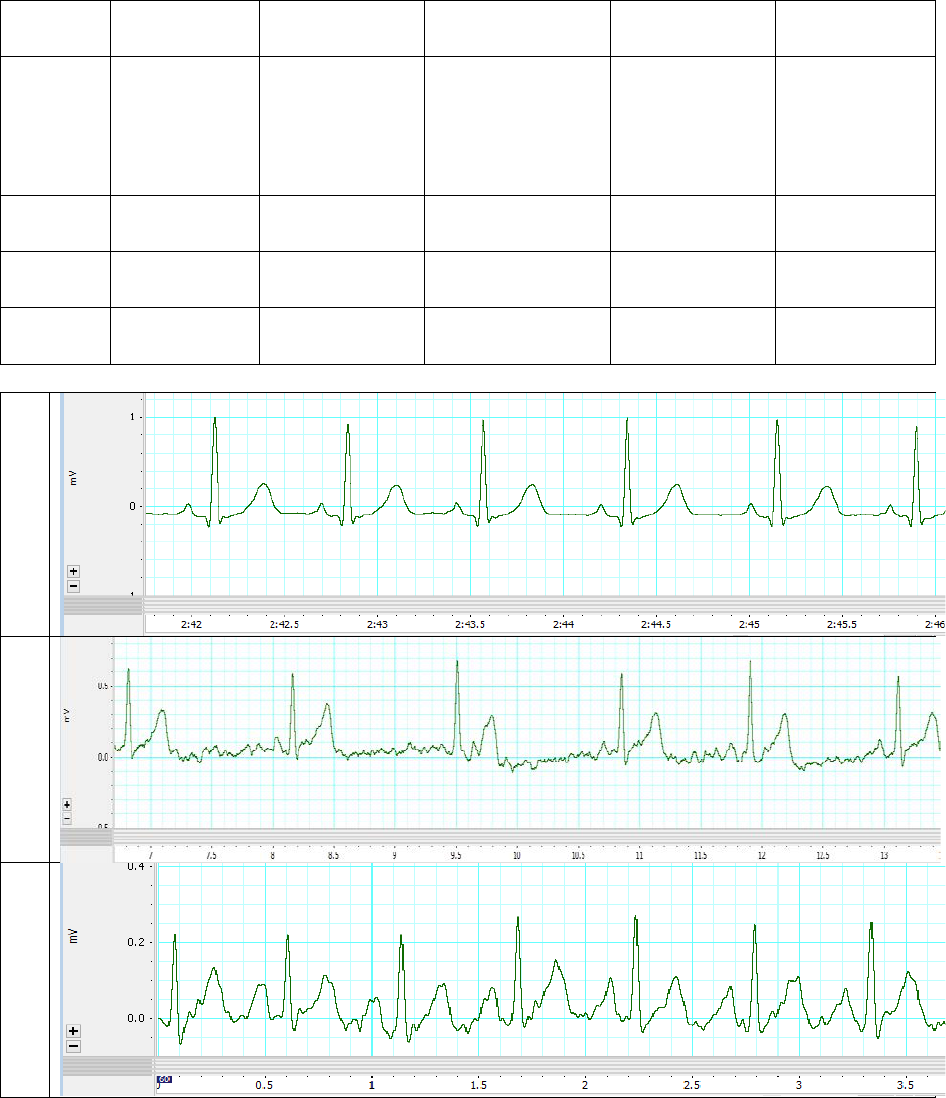
Exercise 5. For additional lab exam practice fill in this table using these three ECG
recordings. You can do this when you study the lab materials at home. Note the Q-wave is
not always visible on this or all ECG recordings. Estimate rates and intervals as well as you can.
RR interval
(sec)
PR interval
(sec)
ST interval
(sec)
Heart Rate
Beats/minute
Clinical Term
for Rate
What
happens
during
this
interval?
How did you
calculate the
answers
below?
Normal Sinus
Rhythm
Tachycardia
Bradycardia
ECG# 1
ECG #2
ECG #3
ECG 1
ECG 2
ECG 3
