
Hypothesis Testing
Null Hypothesis H
0
:Statement being tested; Claim about µ or historical value of µ
Given Null Hypothesis: µ = k k is a value of the mean given
µ is the population mean discussed throughout the worksheet
Alternative H
ypothesis H
1
: Statement you will adopt in the situa ti o n in which evidence(data)
is strong so H
0
is rejected.
Why do hypothesis testing? Sample mean may be di↵erent from the population mean.
Type of
Test to Apply:
Right T
ailed µ>kYou believe that µ is more than value stated in H
0
Left-Ta iled µ<kYou believe that µ is less than value stated in H
0
Two-Tailed µ 6= k You b elieve that µ is di↵erent from the value stated in H
0
Test µ When Known(P-Value Method)
x¯
µ
Given x is
normal and is known: test statistic: z
¯x
=
p
/ n
x¯
= mean of a random sa m p le µ =valuestated in H
0
n =sample size
= population standard deviation ↵:Preset level of significance*
*Note:
↵ is given in all of these approaches used
P-Values a
nd Types of Tests:
Graph Test Conclusion
z
¯x
0
x
x
1. Left-tailed Test
H
0
: µ = kH
1
: µ<k
P-value = P (z<z
¯
)
This is the probability of
getting a test statistic as
low as or lower than z
¯
If P-value ↵,we reject H
0
and say the data
are statistically significant at the level ↵.
If P-value > ↵,we do notreject H
0
.
0
z
¯x
x
x
2. Right-tailed Test
H
0
: µ = kH
1
: µ>k
P-value = P (z>z
¯
)
This is the probability of
getting a test statistic as
high as or higher than z
¯
If P-value ↵,we reject H
0
and say the data
are statistically significant at the level ↵.
If P-value > ↵,we do notreject H
0
.
|z |
0
¯x
|z |
¯x
x
x
x
3. Two-tailed Test
H
0
: µ = kH
1
: µ 6= k
P-value = 2P (z>|z
¯
|)
This is the probability of
getting a test statistic ei
-
ther lo
wer than |z
¯
| or
higher than |z
¯
|
If P-value ↵,w
e reject H
0
and say the data
are statistically significant at the level ↵.
If P-value > ↵,we do notreject H
0
.
Tel:
csusm.edu/stemsc
XXXX
@csusm_stemcenter
STEM SC (N): (760) 750-4101
STEM SC (S): (760) 750-7324
Hypothesis Testing
Test µ When Unknown(P-Value Method Continued)
x¯ µ
test statistic: t =
p
s= samplestandard deviation
s/ n
Critical Region
Method
x¯
µ
Testing µ wh
en is known: test statistic: z
0
=
p
= population standard deviation
/ n
µ i
s the population mean discussed throughout the worksheet
↵:P
reset level of significance
Note: Assuming a table of areas to the left of z is used, area ↵ is converted to area 1-↵ if you are using
the right tailed test.
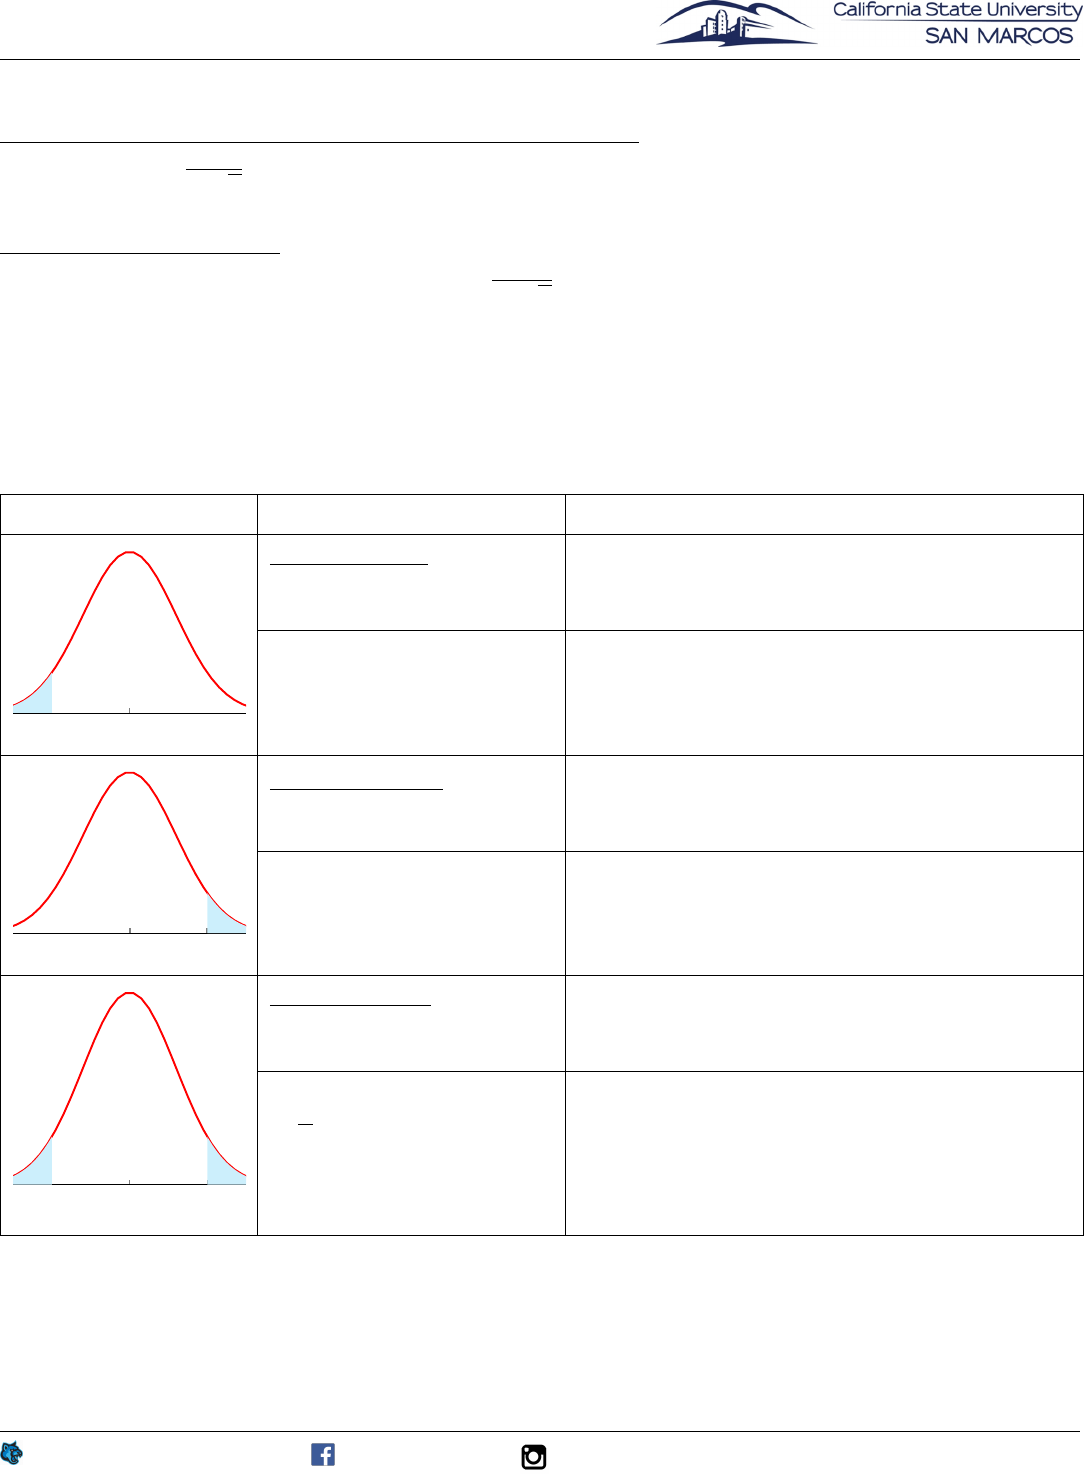
Also Note: Shaded area in figures below is the critical region.
Graph Method Conclusion
Left-tailed Test
H
0
: µ = kH
1
: µ<k
P-value = P (z<t)
If P-value ↵,wereject H
0
.
If P-value > ↵,wedonotreject H
0
.
-t
0
Given Area = ↵
Critical Value:
Find z-score of ↵: z
c
=-t
Compare z
0
to z
c
If sample test statistic critical value, reject H
0
If sam p l e test statistic > critical value, fail to
reject H
0
.
Right-tailed Test
H
0
: µ = kH
1
: µ>k
P-value = P (z>t)
If P-value ↵,wereject H
0
.
If P-value > ↵,wedonotreject H
0
.
0
t
Given Area = ↵
Critical Value:
Find z-score of ↵: z
c
=t
Compare z
0
to z
c
If sample test statistic critical value, reject H
0
If sam p l e test statistic < critical value, fail to
reject H
0
.
Two-tailed Test
H
0
: µ = kH
1
: µ 6= k
P-value = 2P (z>|t|)
If P-value ↵,wereject H
0
.
If P-value > ↵,wedonotreject H
0
.
-t
0
t
Area of each shaded region
↵
=
2
Critical Value:
Find z-score of ↵: z
c
=-t
Compare z
0
to z
c
If samp l e test statistic lies at or beyond critical
values, reject H
0
.
If sample test st ati st i c lies between critical val-
ues, f
ail to reject H
0
. (Notation: t<z
0
<t)
Note: F
or each formula to find z-scores, if you can assume that x has a normal distribution, then any
sample size n will work. If you cannot assume this, use a sample size n 30.
csusm.edu/stemsc
XXXX
@csusm_stemcenter
Tel:
STEM SC (N): (760) 750-4101
STEM SC (S): (760) 750-7324
