San Jose
Water
Company
110 W. Taylor Street
San Jose, CA 95110-2131
March 29, 2019
California Public Utilities Commission
505 Van Ness Avenue
San Francisco, CA 94102
Advice Letter No. 532
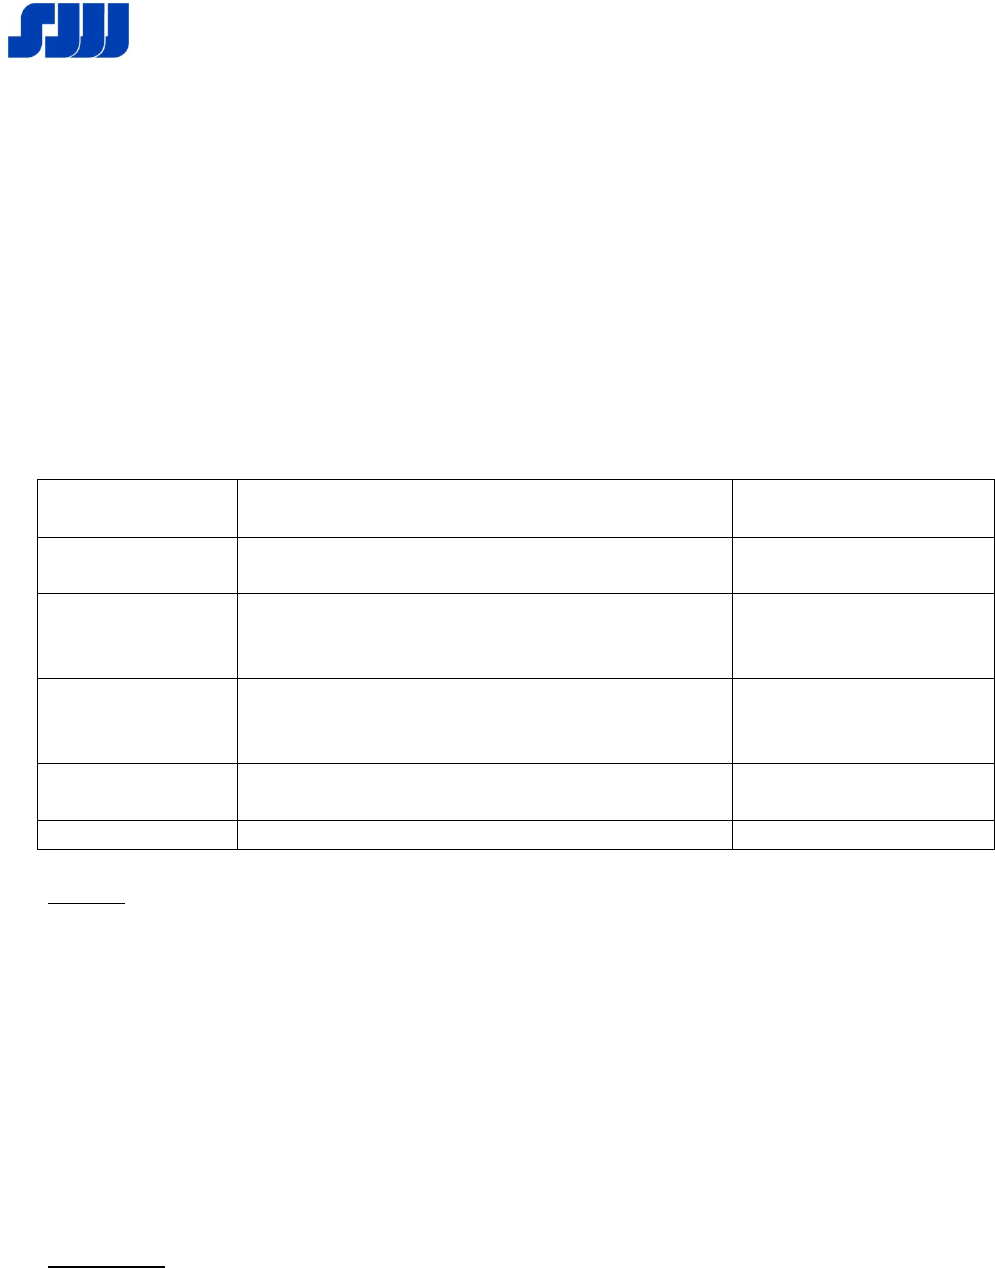
San Jose Water Company (U-168-W) (SJWC) hereby transmits for filing the following changes
in tariff schedules applicable to its service area and which are attached hereto:
Cal. P.U.C
Sheet No. Title of Sheet
Cancelling Cal.
P.U.C. Sheet No.
1971-W Schedule No. 1
General Metered Service (Continued)
1962-W
1972-W Schedule No. 1B
General Metered Service w/Automatic
Fire Sprinkler System (Continued)
1963-W
1973-W Schedule No. 1C
General Metered Service
Mountain District (Continued)
1974-W Schedule No. RW
Raw Water Metered Service (Continued)
1966-W
1975-W Table of Contents 1970-W
Purpose
This Advice Letter (AL) requests the authorization of the California Public Utilities Commission
(Commission) for SJWC to recover the $9,020,356 balance accumulated in the Water
Conservation Memorandum Account (WCMA) during the period January 1, 2018 through
December 31, 2018.
Pursuant to the Commission’s Standard Practice U-27-W, recovery of the accumulated balance is
requested via a 12-month quantity based surcharge of $0.1960 per ccf on all potable water usage
as the balance is greater than 2% but less than 5% of SJWC’s current annual authorized revenue
requirement of $376,180,000. This advice letter is designated as a Tier 3 Advice Letter. These
tariffs are submitted pursuant to General Order No. 96-B – Water Industry Rule 7.3.3(7).
Background
With California facing water shortfalls in the driest year in recorded state history, Governor
Edmund G. Brown Jr. proclaimed a State of Emergency on January 17, 2014, and directed state
CALIFORNIA PUBLIC UTILITIES COMMISSION
ADVICE LETTER NO. 532
Page 2
officials to take all necessary actions to prepare for these drought conditions. In response to the
Governor’s direction, on February 27, 2014, the Commision issued Resolution (Res.) W-4976.
In this Resolution, the Commission approved Drought Procedures for Water Conservation,
Rationing and Service Connection Moratoria (Drought Procedures) and required that all Class A
and B water utilities that had an existing Tariff Rule 14.1 activate the Rule within 30 days of the
Resolution effective date. The Drought Rules, in addition to providing steps to be taken when a
utility suffers from a water shortage, provided that a utility without a full revenue decoupling
Water Revenue Adjustment Mechanism request to add a memorandum account to track lost
revenue associated with reduced sales as a result of activating Rule 14.1. SJWC’s Rule 14.1
became effective March 31, 2014, via AL 456, and responded to both the Governor’s declaration
as well as a water use reduction target of 20% of 2013 usage established by our local wholesale
water supplier, the Santa Clara Valley Water District (SCVWD).
With Rule 14.1 in place, SJWC pursued an aggressive conservation campaign. Actions taken
include providing direct mailings to customers outlining the Rule 14.1 conservation measures in
effect and the State Water Resources Control Board’s Emergency Regulation to Control Water
Use during Droughts, many of which remain in effect today. Additionally, SJWC has increased
face-to-face conservation outreach by meeting directly with home owner associations,
neighborhood associations, trade associations, etc. SJWC has also increased leak repair activity
to reduce unaccounted for water.
On June 15, 2015, SJWC implemented Schedule 14.1 and Rule 14.1 as directed by the
Commission and approved in ALs 472/472A. Further, SJWC immediately activated Stage 3 –
Critical Water Reduction of that Rule in order to meet a 30% water use reduction goal
established by the SCVWD. Stage 3 consists of 11 different water use restrictions including but
not limited to a two day per week irrigation schedule and all current State restrictions. The
Schedule includes monthly drought allocations and drought surcharges for residential customers
and dedicated landscape services who do not meet the allocations. All drought surcharges
collected have been tracked in SJWC’s WCMA to offset lost revenues as allowed in the
approved Schedule 14.1 – Special Condition 6. In conjunction with implementing Schedule
14.1, SJWC also reached out to our Commercial and Municipal customer base offering free
water audits, presentations and tabling events to educate their staff as well as customized
conservation analysis of their business.
In light of improved water supply conditions in 2016, the State Water Resources Control Board
removed its mandated conservation targets for urban water suppliers and the SCVWD reduced
its water use reduction goal from 30% to 20% on July 1, 2016. SJWC sought and received
approval from the Commission to update the drought allocations to match the SCVWD’s new
water use reduction goal under Schedule 14.1 effective July 1, 2016, via AL 491.
CALIFORNIA PUBLIC UTILITIES COMMISSION
ADVICE LETTER NO. 532
Page 3
Effective February 1, 2017, SJWC received approval from the Commission to suspend the
drought allocations and surcharges under Schedule 14.1 via AL 505.
SJWC’s conservation response and the efforts of our customers have produced exemplary results
as summarized below when compared to the 2013 baseline year and surpassed the Governor’s
mandated reduction of 20% for the company and nearly achieved the SCVWD’s 30% water use
reduction target. The SCVWD continues to request a water use reduction target of 20% of 2013
usage from all of its retailers, while the State Water Resource Control Board has made several
water use restrictions mandatory.
• 2014 – 14% reduction (from March 31 through December 31)
• 2015 – 28% reduction
• 2016 – 29% reduction
• 2017 – 20% reduction
• 2018 – 22% reduction
Regulatory filings for the recovery of unrecovered fixed costs resulting from the drought
included the following.
AL 477, effective December 9, 2015, authorized recovery of the undercollected $4,258,794
balance in the Mandatory Conservation Revenue Adjustment Memorandum Account
(MCRAMA) for the period March 31 through December 31, 2014, in accordance with Res. W-
5071. In addition, AL 477 used the WCMA methodology previously authorized for water
utilities in Decision (D.) 90-08-055 and D.91-10-042 for calculating revenues as directed in Res.
W-5071.
AL 486, effective April 26, 2016, authorized the recovery of the undercollected $7,667,713
WCMA balance for the period of January 1 through December 31, 2015, as provided in Res. W-
5095. Additionally, as discussed above, the unrecovered fixed costs tracked in the WCMA was
offset by drought surcharges collected for the same period as authorized in SJWC’s Schedule
14.1 – Special Condition 6.
AL 508A/B, effective January 1, 2017, authorized the re-implementation of the 2014 MCRAMA
and 2015 WCMA surcharges which expired with significant undercollections remaining as
authorized in ALs 477 and 486 due to the successful conservation efforts.
The 2016 and 2017 WCMA balances were resolved in SJWC’s 2018 General Rate Case.
Unrecovered fixed costs tracked in the WCMA in 2016 and 2017 were offset by drought
surcharges collected in the same period and netted against other memorandum accounts as
provided in D.18-11-025.

CALIFORNIA PUBLIC UTILITIES COMMISSION
ADVICE LETTER NO. 532
Page 4
WCMA Under-collection
The unrecovered fixed cost recovery requested in this advice letter is calculated based on the
WCMA methodology approved by the Commission in Res. W-5071 on December 3, 2015.
WCMA calculations are provided in Attachment A.
As detailed in Attachment A, the total lost revenue of $8,935,385, which includes the required
20 basis point adjustment in SJWC’s ROE. Inclusion of interest at the 90-day commercial rate
provides a total WCMA under-collection of $9,020,356, which results in a surcharge of $0.1960
per ccf to be applied to all potable and raw water usage for a 12-month period or until recovered.
Recovery of the accumulated balance of the memorandum account is being requested in
accordance with Commission procedures as the balance has exceeded 2% of authorized revenue
for the prior calendar year. The memorandum account surcharge will result in an increase of
$2.19 per month, or approximately 2.26% for a customer with a 3/4-inch meter using 11 ccf per
month (Attachment B). SJWC earned its authorized Rate of Return for the WCMA period
requested for recovery in this filing (Attachment C).
Public notice of the offset rate adjustment is being completed by separate direct mailing to all
customers (Attachment D) in compliance with GO 96B General Rule 4.2 and Water Industry
Rule 3.1. This direct mailing is anticipated to begin on or about March 29, 2019, in order to
providesufficient time for responses or protests to be received within the 20-day protest period
and for the required minimum 30-day notice prior to the requested effective date of July 1, 2019.
Proof of mailing will be submitted to the Commission when the notification has been completed.
Effective Date
SJWC requests the proposed surcharge become effective July 1, 2019.
Protests and Responses
Anyone may respond to or protest this advice letter. A response does not oppose the filing but
presents information that may prove useful to the Commission in evaluating the advice letter. A
protest objects to the advice letter in whole or in part and must set forth the specific grounds on
which it is based. These grounds may include the following:
(1) The utility did not properly serve or give notice of the advice letter;
(2) The relief requested in the advice letter would violate statute or
Commission order, or is not authorized by statute or Commission
order on which the utility relies;
(3) The analysis, calculations, or data in the advice letter contain material
error or omissions;
CALIFORNIA PUBLIC UTILITIES COMMISSION
ADVICE LETTER NO. 532
Page 5
(4) The relief requested in the advice letter is pending before the
Commission in a formal proceeding;
(5) The relief requested in the advice letter requires consideration in a
formal hearing, or is otherwise inappropriate for the advice letter
process; or
(6) The relief requested in the advice letter is unjust, unreasonable, or
discriminatory (provided that such a protest may not be made where it
would require relitigating a prior order of the Commission).
A response or protest must be made in writing or by electronic mail and must be received by the
Water Division within 20 days of the date this advice letter is filed. The address for mailing or
delivering a protest is:
Tariff Unit, Water Division, 3
rd
floor
California Public Utilities Commission,
505 Van Ness Avenue
San Francisco, CA 94102
On the same date the response or protest is submitted to the Water Division, the respondent or
protestant shall send a copy of the protest by mail to us, addressed to:
Regulatory Affairs
San Jose Water Company
110 West Taylor Street
San Jose, CA 95110
Fax 408.279.7934
The advice letter process does not provide for any responses, protests or comments, except for
the utility’s reply, after the 20-day comment period.
In compliance with Paragraph 4.3 of General Order 96-B, a copy of this advice letter has been
mailed to all interested and affected parties as detailed in Attachment E.
SJWC currently has Advice Letter 531 pending before the Commission.
CALIFORNIA PUBLIC UTILITIES COMMISSION
ADVICE LETTER NO. 532
Page 6
This filing will not cause the withdrawal of service, nor conflict with other schedules or rules.
Very truly yours,
/S/ JOHN TANG
JOHN TANG
Vice President of Regulatory Affairs
Enclosure

SAN JOSE WATER COMPANY
ADVICE LETTER NO. 532
ATTACHMENT A
SAN JOSE WATER COMPAN
Y
(U-168-W)
ADV 532
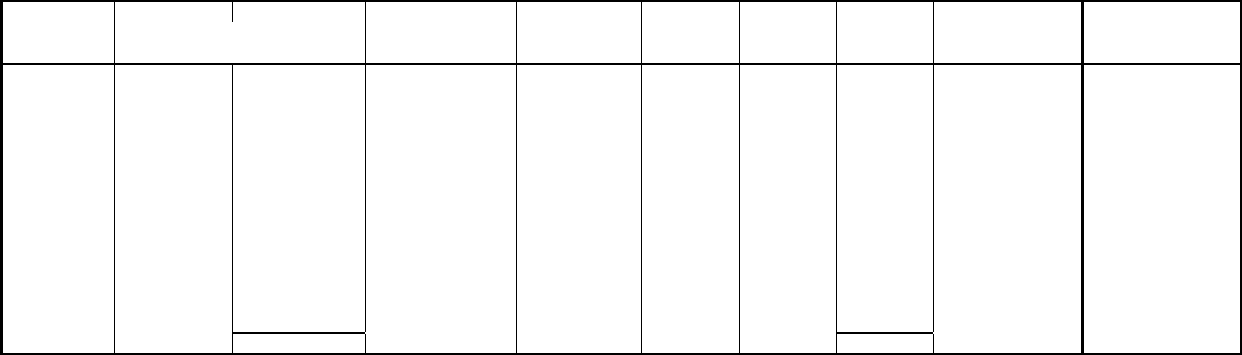
WATER CONSERVATION MEMORANDUM ACCOUNT
2018
Drought Surcharges are booked as liabilites 100.249010.427, 100.249020.427 and 100.249040.427 and related 101 accounts
Authorized in Advice Letter 479-A Schedule 14.1
Interest on memorandum account pursuant to D.94-06-033.
Month
Beginning
Balance
Monthly
Charges
Ending
Balance
Average
Balance
Fed. Res.
Com. Paper
3-month
Prorated
Monthly
Rate
Computed
Interest
Cumulative
Interest
Month End
Balance
2018
Jan $0 $362,470 $362,470 $181,235 1.59% 0.13% $236 $236 $362,706
Feb $362,706 $241,045 $603,752 $483,229 1.69% 0.14% $677 $913 $604,429
Mar $604,429 $102,517 $706,945 $655,687 1.90% 0.16% $1,049 $1,962 $707,994
Apr $707,994 ($701,727) $6,268 $357,131 2.00% 0.17% $607 $2,569 $6,875
May $6,875 ($1,650,603) ($1,643,728) ($818,427) 2.03% 0.17% ($1,391) $1,178 ($1,645,119)
Jun ($1,645,119) ($1,763,689) ($3,408,808) ($2,526,964) 2.08% 0.17% ($4,296) ($3,118) ($3,413,104)
Jul ($3,413,104) ($1,373,378) ($4,786,482) ($4,099,793) 2.12% 0.18% ($7,380) ($10,498) ($4,793,862)
Aug ($4,793,862) ($1,362,928) ($6,156,791) ($5,475,327) 2.12% 0.18% ($9,856) ($20,354) ($6,166,647)
Sep ($6,166,647) ($1,527,947) ($7,694,594) ($6,930,620) 2.19% 0.18% ($12,475) ($32,829) ($7,707,069)
Oct ($7,707,069) ($945,687) ($8,652,756) ($8,179,912) 2.31% 0.19% ($15,542) ($48,371) ($8,668,298)
Nov ($8,668,298) ($337,707) ($9,006,005) ($8,837,152) 2.45% 0.20% ($17,674) ($66,045) ($9,023,679)
Dec ($9,023,679) $22,249 ($9,001,430) ($9,012,555) 2.52% 0.21% ($18,926) ($84,971)
($9,020,356)
2018 Total ($8,935,385) ($84,971)
D.18-11-025 2019 Authorized Potable and Raw Metered Sales CCF 46,021,000
12 Month Surcharge per CCF ($0.1960)
D.16-06-004
2018
A
ttac
h
ment
A
Page 1 of 1
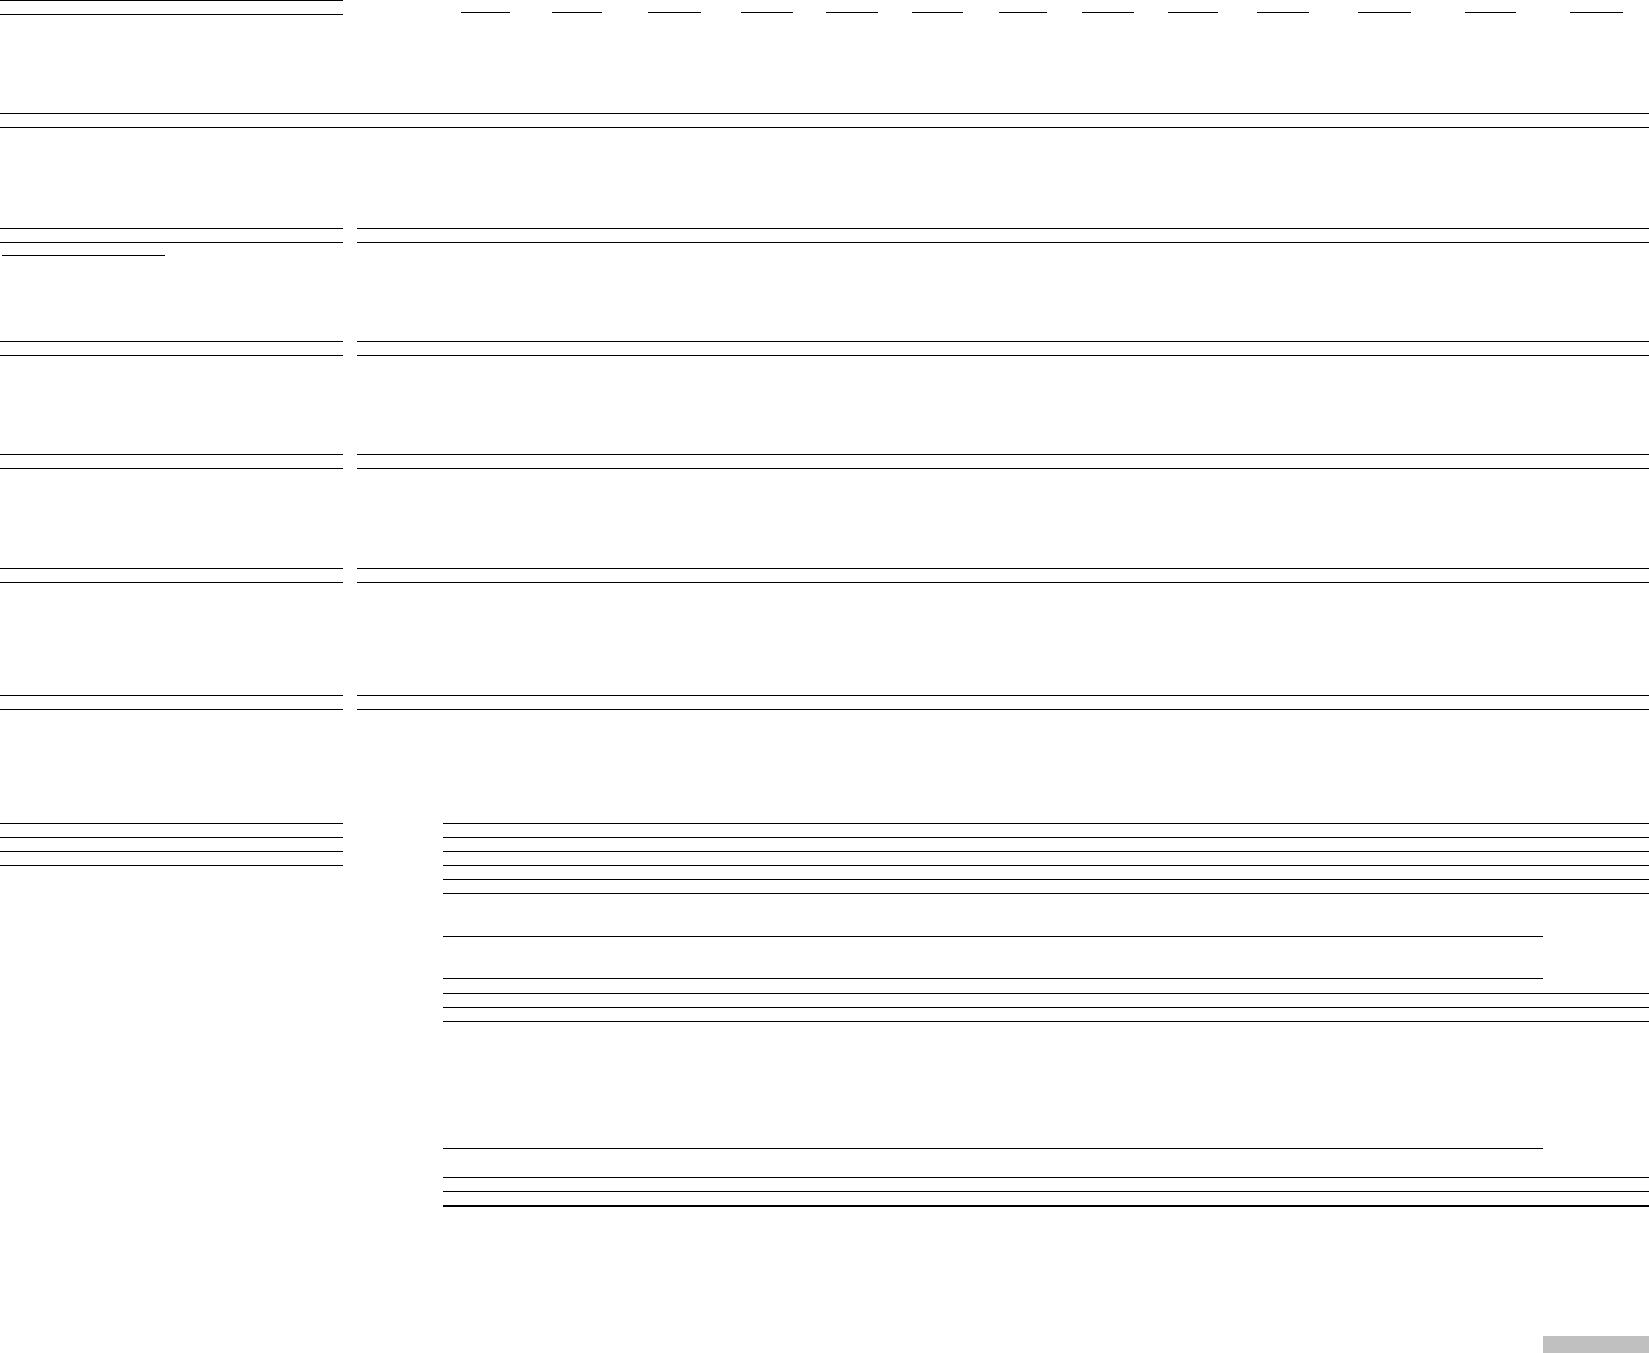
Water Conservation Memorandum Account
Twelve Months Ended December 31, 2018
Potable water
SALES DATA (CCF)
601.10 METERED RESIDENTIAL
JAN 2018 FEB 2018 MAR 2018 APR 2018 MAY 2018 JUN 2018 JUL 2018 AUG 2018 SEP 2018 OCT 2018 NOV 2018 DEC 2018 2018 Total
Actual Consumption (CCF) 1,958,272 1,617,982 1,604,456 1,500,483 1,651,111 2,056,920 2,740,314 2,541,484 2,843,080 2,491,190 2,624,592 2,244,476 25,874,360
Adopted Usage/Customer 146.6
Monthly Allocation - 3 Yr. Average Distribution 6.60% 5.35% 5.62% 5.68% 7.36% 8.70% 11.35% 10.39% 11.64% 9.92% 9.77% 7.64% 100.00%
Allocated Adopted CCF/Customer 9.67 7.85 8.24 8.32 10.79 12.75 16.63 15.23 17.06 14.54 14.32 11.21 146.60
Recorded # Customers 199,006 199,018 199,138 199,242 199,448 199,053 199,034 199,257 199,521 199,738 199,808 199,691
Normalized Adopted Sales 1,924,388 1,561,376 1,639,952 1,658,635 2,151,412 2,538,253 3,310,633 3,033,957 3,403,789 2,903,412 2,861,644 2,237,834 29,225,284
Difference Actual vs. Normalized Adopted Sales (CCF) 33,884 56,606 (35,495) (158,152) (500,301) (481,333) (570,318) (492,472) (560,710) (412,222) (237,052) 6,642 (3,350,924)
601.10 METERED BUSINESS
Actual Consumption (CCF) 1,201,156 1,168,834 1,057,162 1,102,563 1,174,769 1,446,909 1,642,845 1,684,236 1,582,018 1,633,706 1,489,708 1,432,422 16,616,329
Adopted Usage/Customer 858.3
Monthly Allocation - 3 Yr. Average Distribution 6.53% 6.65% 5.85% 7.04% 7.70% 9.62% 9.68% 10.33% 9.87% 9.74% 8.51% 8.48% 100.00%
Allocated Adopted CCF/Customer 56.04 57.11 50.24 60.40 66.07 82.56 83.10 88.68 84.71 83.58 73.06 72.77 858.30
Recorded # Customers 20,610 20,585 20,636 20,619 20,641 20,639 20,658 20,668 20,681 20,682 20,689 20,687
Normalized Adopted Revenue 1,155,074 1,175,586 1,036,654 1,245,402 1,363,805 1,703,883 1,716,597 1,832,891 1,751,795 1,728,510 1,511,471 1,505,343 17,727,011
Difference Actual vs. Normalized Adopted Sales (CCF) 46,082 (6
,752) 20,509 (142,838) (189,036) (256,974) (73,752) (148,655) (169,778) (94,804) (21,763) (72,921) (1,110,682)
601.20 METERED INDUSTRIAL
ACTUAL 16,825 16,703 16,470 18,700 19,538 21,044 19,795 21,111 19,355 22,788 18,241 20,152 230,721
ADP CCF/CUST 3,830.2
Monthly Allocation - 3 Yr. Average Distribution 6.30% 8.08% 6.77% 7.19% 8.83% 9.99% 8.07% 10.28% 8.18% 8.75% 9.20% 8.35% 100.00%
Allocated Adopted CCF/Customer 241.35 309.52 259.23 275.44 338.18 382.80 309.12 393.75 313.31 335.32 352.41 319.76 3,830
REC # CUST 53 54 52 52 51 51 52 52 54 54 54 54
NORMALIZED 12,792 16,714 13,480 14,323 17,247 19,523 16,074 20,475 16,919 18,107 19,030 17,267 201,951
Difference Actual vs. Normalized Adopted Sales (CCF) 4,033 (11) 2,990 4,377 2,291 1,521 3,721 636 2,436
4,681 (789) 2,885 28,771
601.30 METERED PUBLIC AUTHORITY
ACTUAL 82,950 82,793 90,038 89,191 202,527 302,129 344,704 335,121 330,521 280,556 217,748 120,309 2,478,588
ADP CCF/CUST 1,969.8
Monthly Allocation - 3 Yr. Average Distribution 2.8% 3.2% 3.4% 5.1% 10.3% 13.5% 14.4% 14.3% 13.1% 9.6% 6.6% 3.7% 100.00%
Allocated Adopted CCF/Customer 55.28 62.41 66.23 100.12 202.28 266.91 283.95 282.28 257.48 190.00 130.01 72.91 1,970
REC # CUST 1,310 1,310 1,310 1,311 1,310 1,309 1,307 1,307 1,306 1,305 1,305 1,305
NORMALIZED 72,413 81,755 86,756 131,253 264,984 349,380 371,121 368,945 336,269 247,945 169,665 95,141 2,575,627
Difference Actual vs. Normalized Adopted Sales (CCF) 10,537 1
,039 3,282 (42,061) (62,457) (47,251) (26,417) (33,824) (5,748) 32,611 48,083 25,168 (97,040)
603.10 Resale
ACTUAL 12,848 12,834 10,410 10,745 15,884 20,406 21,944 23,713 22,749 20,004 19,938 15,033 206,508
ADP CCF/CUST 10,062.5
Monthly Allocation - 3 Yr. Average Distribution 3.73% 4.03% 3.70% 4.80% 8.34% 10.76% 13.89% 12.36% 12.81% 11.95% 7.00% 6.63% 100.0%
Allocated Adopted CCF/Customer 375.51 405.13 371.96 483.36 839.25 1,082.52 1,397.73 1,243.34 1,289.15 1,202.74 704.63 667.19
10,063
REC # CUST 33 33 33 33 33 33 33 33 33 33 33 33
NORMALIZED 12,392 13,369 12,275 15,951 27,695 35,723 46,125 41,030 42,542 39,690 23,253 22,017 332,063
Difference Actual vs. Normalized Adopted Sales (CCF) 456 (535) (1,865) (5,206) (11,811) (15,317) (24,181) (17,317) (19,793) (19,686) (3,315) (6,984) (125,555)
609.00 RAW WATER SALES
ACTUAL 844 733 426 1,526 23,296 17,178 20,440 23,589 20,509 15,376 12,504 6,723 143,143
ADP CCF/CUST 3,500.0
Monthly Allocation - 3 Yr. Average Distribution 3.73% 4.03% 3.70% 4.80% 8.34% 10.76% 13.89% 12.36% 12.81% 11.95% 7.00% 6.63% 100.0%
Allocated Adopted CCF/Customer 130.611 140.916 129.377 168.124 291.914 376.530 486.166 432.468 448.400 418.343 245.088 232.064 3,500.000
REC # CUST 5 5 5 5 5 5 5 5 5 5 5 5
NORMALIZED 653.054 704.580 646.887 840.619 1,459.572 1,882.650 2,430.828 2,162.338 2,241.998 2,091.714 1,225.438 1,160.322 17,500
Difference Actual vs. Normalized Adopted S
ales (CCF) 191 28 (221) 686 21,837 15,295 18,009 21,426 18,267 13,284 11,278 5,563 125,643
609.00 OTHER SALES
ACTUAL 5,538 2,962 6,331 5,259 13,116 12,446 12,211 7,791 13,722 12,708 7,039 7,072 106,195
ADP CCF/CUST 424.5
Monthly Allocation - 3 Yr. Average Distribution 2.38% 3.98% 4.24% 4.03% 7.11% 8.23% 16.58% 10.14% 13.18% 11.59% 7.54% 11.01% 100.0%
Allocated Adopted CCF/Customer 10.10 16.91 18.00 17.09 30.19 34.93 70.37 43.04 55.94 49.22 32.01 46.73 424.53
REC # CUST 236 222 213 221 234 268 268 280 271 277 283 272 3,045
NORMALIZED 2,383 3,755 3,834 3,778 7,065 9,361 18,859 12,051 15,161 13,633 9,058 12,710 111,647
Difference Actual vs. Normalized Adopted Sales (CCF) 3,155 (793) 2,497 1,481 6,051 3,085 (6,648) (4,260) (1,439) (925) (2,019) (5,638) (5,452)
TOTAL SALES DIFFERENCE (CCF) 98,338 49,581 (8,303) (341,714) (733,427) (780,974) (679,586) (674,467) (736,763) (477,062) (205,575) (45,285) (4,535,238)
Total Quantity Vo
lumes 3,277,589 2,902,108 2,784,867 2,726,942 3,076,946 3,859,854 4,781,812 4,613,457 4,811,444 4,460,952 4,377,266 3,839,464 45,512,701
Quantity Rates
Effective date 1/1/2018 1/1/2018 1/1/2018 &3/22/18 3/22/2018 3/22/2018 3/22/2018 7/1/2018 7/1/2018 8/25/2018 8/25/2018 8/25/2018 8/25/2018
Uniform Rate App. to All Potable Water Excl. Raw $5.6482 $5.6482 $5.6211 $5.5670 $5.5670 $5.5670 $5.6222 $5.6222 $5.6660 $5.6660
$5.6660 $5.6660
Revenue Loss Excluding Raw Water $ 554,355 $ 279,884 $ (45,433) $ (1,906,137) $ (4,204,552) $ (4,432,832) $ (3,922,022) $ (3,912,450) $ (4,278,002) $ (2,778,301) $ (1,228,694) $ (288,104) $ (26,162,288)
Raw Water Rates per CCF $5.4186 $5.4186 $5.3915 $5.3374 $5.3374 $5.3374 $5.3926 $5.3926 $5.4464 $5.4464 $5.4464 $5.4464
Revenue Loss
Raw Water $1,035 $154 ($1,191) $3,659 $116,550 $81,635 $97,116 $115,544 $99,490 $72,350 $61,426 $30,298 $678,066
GROSS REVENUE GAIN (LOSS) $ 555,389 $ 280,038 $ (46,624) $ (1,902,478) $ (4,088,001) $ (4,351,196) $ (3,824,906) $ (3,796,907) $ (4,178,512) $ (2,705,951) $ (1,167,267) $ (257,807) $ (25,484,222)
GROSS REVENUE GAIN (LOSS) 0 $ 555,389 $ 280,038 $ (46,624) $ (1,902,478) $ (4,088,001) $ (4,351,196) $ (3,824,906) $ (3,796,907) $ (4,178,512) $ (2,705,951) $ (1,167,267) $ (257,807) $ (25,484,222)
Details of Variable Cos
t Reductions:
PURCHASED POWER 17,693 8,921 (1,494) (61,482) (131,960) (140,514) (122,273) (121,351) (132,560) (85,834) (36,988) (8,148) (815,989)
PURCHASED WATER 178,497 89,997 (15,072) (620,257) (1,331,270) (1,417,575) (1,343,250) (1,333,131) (1,456,264) (942,947) (406,334) (89,509) (8,687,115)
PUMP TAXES 110,450 55,688 (9,326) (383,800) (823,758) (877,162) (836,954) (830,648) (907,370) (587,532) (253,179) (55,771) (5,399,364)
LEASED WATER RIGHTS
- - - - - - - - - - - - -
Chemical Costs 940 474 (79) (3,267)
(7,012) (7,467) (6,498) (6,449) (7,044) (4,561) (1,966) (433) (43,363)
UNCOLLECTIBLES 1,088 549 (92) (3,782) (8,117) (8,643) (7,804) (7,745) (8,531) (5,524) (2,380) (524) (51,505)
LOCAL TAXES 1,787 901 (151) (6,209) (13,328) (14,192) (12,796) (12,700) (13,984) (9,055) (3,902) (860) (84,489)
Subtotal - Variable Cost Increase (Reduction) 310,456 156,529 (26,214) (1,078,798) (2,315,445) (2,465,553) (2,329,574) (2,312,024) (2,525,754) (1,635,453) (704,749) (155,245) (15,081,825)
20 BASIS PT. ADJ. * (117,536) (117,536) (122,927) (121,954) (121,954) (121,954) (121,954) (121,954) (124,811) (124,811) (124,811) (124,811) (1,467,012)
Total Adjustments to Gross Lost Revenue 192,919 38,993 (149,141) (1,200,752) (2,437,398) (2,587,507) (2,451,528) (2,433,978) (2,650,565) (1,760,264) (829,560) (280,056) ($16,548,837)
ADJUSTED NET REVENUE - OVER- (UNDER-) RECOVERY
362,470 241,045 102,517 (701,727) (1,650,603) (1,763,689) (1,373,378) (1,362,928) (1,527,947) (945,687) (337,707) 22,249 (8,935,385)
*Acutal Consumption taken fr
om JV 1
Raw Consumption is included in Resale Category in JV1
**Raw Consumption is taken from CC&B report "Monthly_Sales-
Raw
Aug 15 onward provided monthly from Customer Systems.
***Number of Raw Customers is taken from Rate Statistics by SA
Ty
pe (CMSA020A) provided by Customer Systems or Accounting.
SAN JOSE WATER COMPANY
ADVICE LETTER NO. 532
ATTACHMENT B
ADVICE LETTER 53
2
ATTACHMENT
B
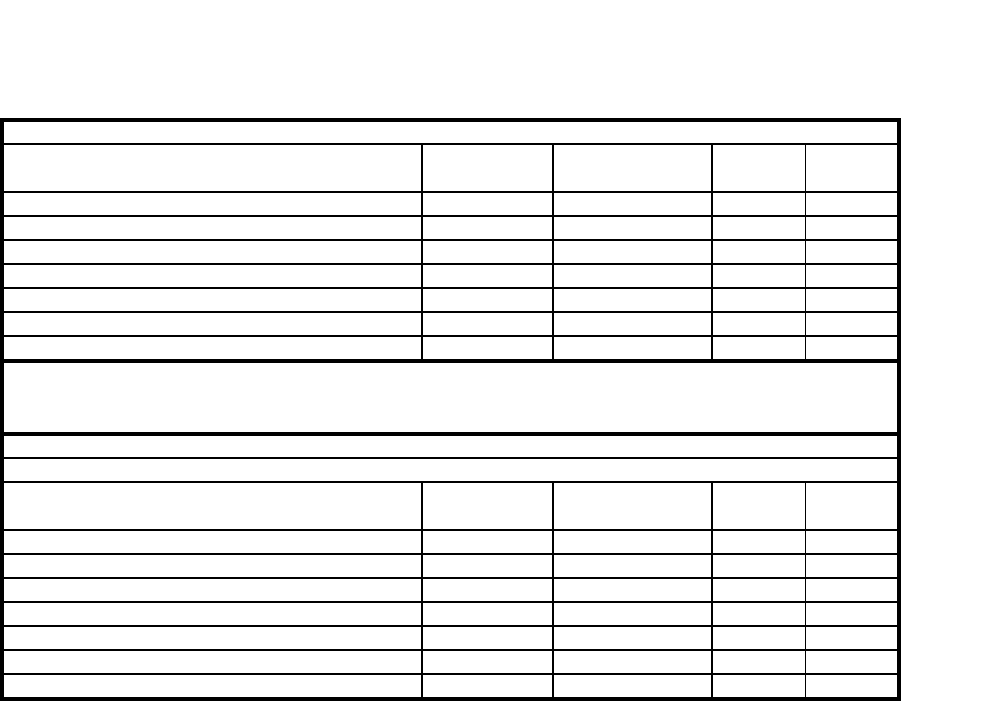
BILL COMPARISON
BILL COMPARISON UNIFORM RATES
Bill Comparison Uniform Rates 3/4-Inch Meter
Usage
(ccf)
Current Rates
AL 528A
Proposed Rates
AL 532 Increase Increase
5 $68.90 $69.89 1.44% $0.99
11 $101.67 $103.86 2.15% $2.19
15 $123.52 $126.50 2.41% $2.98
20 $150.83 $154.81 2.64% $3.97
30 $205.45 $211.42 2.90% $5.96
50 $314.70 $324.64 3.16% $9.94
100 $587.82 $607.69 3.38% $19.87
BILL COMPARISON RESIDENTIAL TIERED RATES
Tiered Rate Bill Comparison 3/4-Inch Meter
Usage
(ccf)
Current Rates
AL 528A
Proposed Rates
AL 532 Increase Increase
5 $64.02 $65.01 1.55% $0.99
Typical 11 $96.80 $98.98 2.26% $2.19
15 $118.64 $121.63 2.51% $2.98
20 $149.20 $153.17 2.66% $3.97
30 $220.02 $225.98 2.71% $5.96
50 $361.66 $371.60 2.75% $9.94
100 $715.78 $735.65 2.78% $19.87
SAN JOSE WATER COMPANY
ADVICE LETTER NO. 532
ATTACHMENT C

SAN JOSE WATER COMPANY
(
U-168-W
)
SUMMARY OF EARNINGS AND RATE OF RETURN
FOR THE TWELVE MONTHS ENDED December 31, 2018
($ Amounts in Thousands)
Authorized
Per
AL 524 Recorded Adjustment Pro-forma
Operating Revenue:
Operating Revenues $382,649 $363,277 $388,293
Other Water Revenues $0 $3,923 $3,923
Deferred Revenue on CIAC $487 $436 $487
Total Metered Revenue $383,136 $367,636 A $392,703
Operating Expense:
Purchased Water - Potable $98,526 $91,717 F $98,391
Purchased Water - Recycled $2,060 $2,680 F $2,769
Pump Taxes $61,390 $44,487 G $61,313
Purchased Power $8,969 $6,342 H $10,565
Operations & Maintenance $37,731 $41,101 D $37,731
Chemical $477 $663 I $478
Administrative & General $27,743 $37,013 D $27,743
Depreciation & Amortization $51,079 $51,001 D $51,619
Subtotal $287,973 $275,004 $290,609
Uncollectible $577 $374 B $594
Taxes Other Than Income $12,136 $13,420 C $13,385
Revenue Adjustment Balancing and Memo Acct $0 ($3,844) E $0
Total Operating Expense Before Income Taxes $300,687 $284,954 $304,588
Operating Revenue Before Income Taxes $82,449 $82,682 $88,116
State Income Tax $4,621 $4,095 J $5,569
Federal Income Tax $14,410 $9,635 J $16,463
Total Operating Expense $319,718 $298,684 $326,620
Net Operating Revenue
$63,419 $68,952 $66,083
Weighted Average Rate Base 829,563 864,933 864,933
Earned Rate of Return 7.64% 7.97% 7.64%
Authorized Rate of Return 7.64% K 7.64%

SAN JOSE WATER COMPAN
Y
(U-168-W)
WEIGHTED AVERAGE RATE BASE
FOR THE TWELVE MONTHS ENDED December 31, 2018
($ Amounts in Thousands)
Weighted Averages [2]:
Utility Plant $1,728,914
Reserve for Depreciation $539,630
Reserve for Amortization $520
Net Utility Plant 1,188,764
Adjustments:
Contributions in Aid of Construction $124,084
Total Tax Deferrals $155,104
Advances for Construction $72,824
Total Adjustments 352,012
Adjusted Net Utility Plant 836,752
Taxes on Contributions & Advances $8,897
Total Working Capital $19,284
Weighted Average Rate Base $864,933
[2] The weighted average is the sum of the first and last months balance divided by
two, plus the sum of the intervening eleven months, divided by twelve.
SAN JOSE WATER COMPANY
ADVICE LETTER NO. 532
ATTACHMENT D

SAN JOSE WATER COMPANY
Para más información o si necesita asistencia en español por favor llame al número (408) 279-7900.
NOTICE OF REQUESTED SURCHARGE IMPLEMENTATION
On March 29, 2019, San Jose Water Company (SJWC) filed Advice Letter No. 532 (AL
532) with the California Public Utilities Commission (CPUC) requesting authorization to
recover the balance accumulated in the Water Conservation Memorandum Account
(WCMA) during the period of January 1, 2018, through December 31, 2018.
The CPUC previously authorized SJWC to establish a WCMA to track unrecovered fixed
costs occurring during mandatory conservation, and that impacted our quantity revenue.
The under-collection was a result of water conservation measures established by the State
of California and the Santa Clara Valley Water District. During the period of January 1,
2018, through December 31, 2018, an under-collection of $9,020,356 was accumulated in
the WCMA. As directed by the CPUC’s Water Division, the under-collection will be
recovered via a quantity surcharge of $0.1960 per hundred cubic feet (ccf, equivalent to
748 gallons) for a period of 12 months from the date of CPUC approval. If approved,
the requested recovery would begin on or about July 1, 2019.
If the CPUC authorizes the requested surcharge, the resulting monthly bill for a typical
customer with a 3/4-inch meter using 11 ccfs per month will increase by $2.19 or
approximately 2.26%.
Protests and Responses
Any customer may respond to or protest this advice letter. A response does not oppose the
filing but presents information that may prove useful to the CPUC in evaluating the
advice letter. A protest objects to the advice letter in whole or in part and must set forth
the specific grounds on which it is based. These grounds may include the following:
(1) The utility did not properly serve or give notice of the advice letter;
(2) The relief requested in the advice letter would violate statute or CPUC order, or is not
authorized by statute or CPUC order on which the utility relies;
(3) The analysis, calculations, or data in the advice letter contain material error or
omissions;

(4) The relief requested in the advice letter is pending before the CPUC in a formal
proceeding;
(5) The relief requested in the advice letter requires consideration in a formal hearing, or
is otherwise inappropriate for the advice letter process; or
(6) The relief requested in the advice letter is unjust, unreasonable, or discriminatory
(provided that such a protest may not be made where it would require re-litigating a
prior order of the CPUC).
A response or protest must be sent in writing or by electronic mail. It must be
received by the Division of Water and Audits by April 18, 2019; 20 days from the
filing date of this advice letter. The address for mailing or emailing a response or
protest is:
California Public Utilities Commission
Tariff Unit, Division of Water and Audits
505 Van Ness Avenue – 3rd Floor
San Francisco, CA 94102
water[email protected]
On the same date the response or protest is submitted to the Water Division, the
respondent or protestant shall send a copy by mail or email to us, addressed to:
San Jose Water Company
Regulatory Affairs
110 West Taylor Street
San Jose, CA 95110
Fax (408) 279-7934
regulatoryaffairs@sjwater.com
The advice letter process does not provide for any responses, protests, or comments
except for the utility’s reply, after the 20-day comment period has closed.

AVISO DE IMPLEMENTACIÓN DEL CARGO ADICIONAL SOLICITADO
El 29 de marzo de 2019, San Jose Water Company (SJWC) presentó la carta de aviso
Advice Letter No. 532 (AL 532) ante la Comisión de Servicios Públicos de California
(CPUC) solicitando autorización para recuperar el saldo acumulado en la cuenta de orden
para la conservación del agua Water Conservation Memorandum Account (WCMA)
durante el periodo comprendido entre el 1 de enero de 2018 y el 31 de diciembre de 2018.
La CPUC autorizó previamente a SJWC establecer una WCMA para rastrear los gastos
fijos no recuperados registrados durante la conservación obligatoria, mismos que
afectaron nuestro ingreso por cantidad. La subrecaudación fue resultado de las medidas
de conservación de agua establecidas por el estado de California y el distrito Santa Clara
Valley Water District. Durante el período del 1 de enero de 2018 al 31 de diciembre de
2018, se acumuló una subrecaudación de $9,020,356 en la cuenta WCMA. Según lo
ordenado por la División del Agua (Water Division) de la CPUC, la subrecaudación se
recuperará vía un cargo adicional de $0.1960 por ciento de pies cúbicos (ccf, equivalente
a 748 galones) por un periodo de 12 meses a partir de la fecha de aprobación de la CPUC.
De aprobarse, la recuperación solicitada entraría en vigor el 1 de julio de 2019 o
alrededor de esa fecha.
Si la CPUC autoriza el cargo adicional solicitado, la factura mensual resultante para un
cliente típico con un medidor de ¾ de pulgada que consume 11 ccf al mes aumentará
$2.19 o aproximadamente 2.26%.
Desacuerdos y respuestas
Cualquier cliente puede responder a o estar en desacuerdo con esta carta de aviso. Una
respuesta no se contrapone a la presentación de esta solicitud pero aporta información
que podría resultar útil para la CPUC al momento de evaluar la carta de aviso. Un
desacuerdo objeta la carta de aviso, total o parcialmente, y debe plantear los motivos
específicos en los que se basa. Entre los motivos se pueden incluir los siguientes:
(1) La empresa de servicios públicos no entregó o notificó sobre la carta de aviso en
forma correcta;
Para más información o si necesita asistencia en español, por favor llame al número (408) 279-7900.
SAN JOSE WATER COMPANY
A V I S O A L P Ú B L I C O

(2) La compensación solicitada en la carta de aviso violaría el estatuto o la orden de la
CPUC, o no está autorizada conforme al estatuto u orden de la CPUC de los cuales
depende la empresa de servicios públicos;
(3) El análisis, cálculos o datos en la carta de aviso contienen errores u omisiones
considerables;
(4) La compensación solicitada en la carta de aviso está pendiente ante la CPUC en un
procedimiento formal;
(5) La compensación solicitada en la carta de aviso requiere considerarse en una
audiencia formal, o de alguna otra forma resulta inapropiada para el proceso de la
carta de aviso, o
(6) La compensación solicitada en la carta de aviso es injusta, irrazonable o
discriminatoria (salvo que dicho desacuerdo no se manifieste cuando requiriera
volverse a litigar una orden previa de la CPUC).
Deberá enviarse una respuesta o un desacuerdo por escrito o vía mensaje de correo
electrónico. La División de Agua y Auditorías (Division of Water and Audits) deberá
recibirlo antes del 18 de abril de 2019; 20 días contados a partir de la fecha de esta
carta de aviso. La dirección para enviar por correo postal o electrónico una respuesta o
un desacuerdo es:
California Public Utilities Commission
Tariff Unit, Division of Water and Audits
505 Van Ness Avenue – 3rd Floor
San Francisco, CA 94102
water[email protected]
La misma fecha en que la respuesta o el desacuerdo se presentan ante la División de
Agua, el que responde o presenta el desacuerdo deberá enviarnos por correo postal o
correo electrónico una copia del desacuerdo, dirigida a:
San Jose Water Company
Regulatory Affairs
110 West Taylor Street
San Jose, CA 95110
Fax (408) 279-7934
regulatoryaffairs@sjwater.com.
El proceso de la carta de aviso no contempla ninguna respuesta, desacuerdo o
comentario, salvo la respuesta de la empresa de servicios públicos, después del periodo
de comentarios de 20 días.
SAN JOSE WATER COMPANY
ADVICE LETTER NO. 532
ATTACHMENT E
SAN JOSE WATER COMPANY (U-168-W)
Advice Letter No. 532
Attachment E
Page 1 of 2
A copy of Advice Letter No. 532 has been sent to the following municipalities, water companies
and interested parties:
City of San Jose
Municipal Water Dept.
Attn: Jeffrey Provenzano
3025 Tuers Road
San Jose, CA 95121
California Water Service Co.
Attn: Regulatory Affairs
1720 North First Street
San Jose, CA 95112
City of Cupertino
10300 Torre Avenue
Cupertino, CA 95014
City of Campbell
70 North First Street
Campbell, CA 95008
Great Oaks Water Company
P.O. Box 23490
San Jose, CA 95153
Santa Clara Valley Water District
5750 Almaden Expressway
San Jose, CA 95118
County of Santa Clara
70 W. Hedding Street
San Jose, CA 95110
Mountain Springs Mutual Water Co.
17956 Greenwood Road
Los Gatos, CA 95033
San Jose Mercury News
Attn: Paul Rogers
4 N. Second Street, Suite 800
San Jose, CA 95113
Town of Los Gatos
Attn: Director of Public Works
110 E. Main Street
Los Gatos, CA 95032
City of Monte Sereno
Attn: Jessica Kahn, City Engineer
18041 Saratoga-Los Gatos Road
Monte Sereno, CA 95030
City of Santa Clara
1500 Warburton Avenue
Santa Clara, CA 95050
City of Milpitas
Attn: Utilities Engineering
455 East Calaveras Blvd.
Milpitas, CA 95035
City of Saratoga
Attn: Director of Public Works
13777 Fruitvale Avenue
Saratoga, CA 95070
Department of Water Resources
Safe Drinking Water Office, Room 804
1416 9
TH
Street
Sacramento, CA 95814
SAN JOSE WATER COMPANY (U-168-W)
Advice Letter No. 532
Attachment E
Page 2 of 2
Nina Hawk
Chief Operating Officer
Water Utility Enterprises
Santa Clara Valley Water District
5750 Almaden Expressway
San Jose, CA 95118
Gillette MutualWater Company
21976 Gillette Drive
Los Gatos, CA 95033
Redwood Estates Services Association
PO Box 591
Redwood Estates, CA 95044-0591
Big Redwood Park Water
& Improvement Assoc.
18522 Mt. View Avenue
Los Gatos, CA 95033
Villa Del Monte Mutual Water Company
P.O. Box 862
Los Gatos, CA 95031
Ridge Mutual Water Company
22316 Citation Drive
Los Gatos, CA 95033
Summitt West Mutual Water Company
P.O. Box 974
Los Gatos, CA 95031
Oakmount Mutual Water Company
P.O. Box 31536
Stockton, CA 95213
Brush & Old Well Mutual
Water Company
21105 Brush Road
Los Gatos, CA 95033
Bob Burke
Regulatory Liaison For The Six
Mutual Water Companies
420 Alberto Way, Unit 49
Los Gatos, Ca 95032
Stagecoach Mutual Water Co
21825 Stagecoach Road
Los Gatos, CA 95033
Pat Kearns, MD
7 W Central Ave
Los Gatos, CA 95030
Saratoga City Council Member
Rishi Kumar
13777 Fruitvale Avenue
Saratoga, CA 95070
WRATES
Rita Benton
18555 Ravenwood Drive
Saratoga, CA 95070
Saratoga Heights Mutual Water Company
P.O. Box 337
Saratoga, CA 95071
James Hunter
6475 Dwyer Street
San Jose, CA 95120
Raineri Mutual Water Company
P.O. Box 11
Los Gatos, CA 95031
Mt. Summit Mutual Water Co
P.O. Box 3416
Saratoga, CA 95070
………………………
………………………..
………………………..
………………………..
…………………….….
………………………..
………………………..
………………………..
………………………..
………………………..
(To be inserted by utility)
Advice No. 532
Dec. No.
Issued by
JOHN TANG
Vice President,
Regulatory Affairs
TITLE
(To be inserted by Cal. P.U.C.)
Date Filed
Effective
Resolution No.
SAN JOSE WATER COMPANY (U168W)
San Jose, California
I
(N)
(Continued)
Cal. P.U.C. Sheet No. 1971-W Revised
Cal. P.U.C. Sheet No. 1962-W Revised Canceling
Schedule No. 1
GENERAL METERED SERVICE
6. To amortize the under-collection in Balancing Accounts, a surcharge of $0.2961 per 100 cu.ft
is to be added to the Quantity rate shown for a 12 mo
nth period or until collected beginning with
the effective date of Advice Letter 528.
7. To amortize the under-collection of the Memorandum Accounts, a surcharge of $0.2954 per 100 cu.ft
is to be added to the Quantity rate shown for a 12 month period or until collected beginning with
the effective date of Advice Letter 528.
8. To refund prorated service charge rate changes for the period of June 1, 2011, through
Dec
ember 31, 2016, a one-time surcredit will be added to the bill as follows:
Surcredit:
For 5/8 x 3/4-inch meter $6.36
For
3/4-inch meter 6.36
For
1-inch meter 10.59
For
1-1/2-inch meter 21.17
For
2-inch meter 33.89
For
3-inch meter 63.55
For 4-inch meter 105.91
For 6-inch meter 211.83
For 8-inch meter 338.93
For
10-inch meter 487.21
9.
(N)
To amortize the under-collection in the 2018 WCMA, a surcharge of $0.1960 per 100 cu.ft
is to be added to the Quantity rate shown for a 12 month period or until collected beginning with
the effective date of Advice Letter 532.
………………………
………………………..
………………………..
………………………..
…………………….….
………………………..
(To be inserted by utility) Issued by (To be inserted by Cal. P.U.C.)
Advice No. 532
Dec. No.
JOHN TANG
Vice President,
Regulatory Affairs
TITLE
Date Filed
Effective
Resolution No.
SAN JOSE WATER COMPANY (U168W)
San Jose, California
(Continued)
(N)
Cal. P.U.C. Sheet No. 1972-W Revised
Cal. P.U.C. Sheet No. 1963-W Revised Canceling
Schedule No. 1B
GENERAL METERED SERVICE WITH
AUTOMATIC FIRE SPRINKLER SYSTEM
7. To amortize the under-collection in Balancing Accounts, a surcharge of $0.2961 per 100 cu.ft
is to be added to the Quantity rate shown for a 12 month period or until collected beginning with
the effective date of Advice Letter 528.
8. To amortize the under-collection of the Memorandum Accounts, a surcharge of $0.2954 per 100 cu.ft
is to be added to the Quan
tity rate shown for a 12 month period or until collected beginning with
the effective date of Advice Letter 528.
9. To refund prorated service charge rate changes for the period of June 1, 2011, through
De
cember 31, 2016, a one-time surcredit will be added to the bill as follows:
Surcredit:
For 5/8 x 3/4-inch meter
$6.36
For 3/4-inch meter
6.36
For 1-inch meter
10.59
For 1-1/2-inch meter
21.17
For 2-inch meter
33.89
For 3-inch meter
63.55
10. (N)To amortize the under-collection in the 2018 WCMA, a surcharge of $0.1960 per 100 cu.ft
is to be added to the Quantity rate shown for a 12 month period or until collected beginning with
the effective date of Advice Letter 532.
(To be inserted by utility) Issued by (To be inserted by Cal. P.U.C.)
Advice No. 532
Dec. No.
JOHN TANG
Vice President,
Regulatory Affairs
TITLE
Date Filed
Effective
Resolution No.
SAN JOSE WATER COMPANY (U168W)
San Jose, California
(Continued)
I
(N)
Cal. P.U.C. Sheet No. 1973-W Origial
Cal. P.U.C. Sheet No.Revised Canceling
Schedule No. 1C
GENERAL METERED SERVICE
Mountain District
12. (N)To amortize the under-collection in the 2018 WCMA, a surcharge of $0.1960 per 100 cu.ft
is to be added to the Quantity rate shown for a 12 month period or until collected beginning with
the effective date of Advice Letter 532.
………………………..
………………………..
………………………..
…………………….….
………………………..
………………………..
………………………..
………………………..
………………………..
(To be inserted by utility) Issued by (To be inserted by Cal. P.U.C.)
Advice No. 532 JOHN TANG Date Filed
Vice President, Effective
Dec. No. Regulatory Affairs Resolution No.
TITLE
SAN JOSE WATER COMPANY (U168W)
San Jose, California
(Continued)
I
(N)
Cal. P.U.C. Sheet No. 1974-W Revised
Cal. P.U.C. Sheet No. 1966-W Original Canceling
Schedule No. RW
RAW WATER METERED SERVICE
7. To amortize the under-collection in Balancing Accounts, a surcharge of $0.2961 per 100 cu.ft
is to be added to the Quantity rate shown for a 12 month period or until collected beginning with
the effective date of Advice Letter 528.
8. To amortize the under-collection of the Memorandum Accounts, a surcharge of $0.2954 per 100 cu.ft
is to be added to the Quantity rate shown for a 12 mo
nth period or until collected beginning with
the effective date of Advice Letter 528.
9. To refund prorated service charge rate changes for the period of June 1, 2011, through
Dec
ember 31, 2016, a one-time surcredit will be added to the bill as follows:
Surcredit:
For 3/4-inch meter $6.36
For 1-inch meter 10.59
For 1-1/2-inch meter 21.17
For 2-inch meter 33.89
For 3-inch meter 63.55
For 4-inch meter 105.91
For 6-inch meter 211.83
For 8-inch meter 338.93
For 10-inch meter 487.21
10. (N)To amortize the under-collection in the 2018 WCMA, a surcharge of $0.1960 per 100 cu.ft
is to be added to the Quantity rate shown for a 12 month period or until collected beginning with
the effective date of Advice Letter 532.
Cal. P.U.C. Sheet No. 1975-W Revised
Cal. P.U.C. Sheet No. 1970-W Revised Canceling
TABLE OF CONTENTS
The following listed tariff sheets contain all effective rates, rules
and regulations affecting the rates and
service of the Utility, together
with information relating thereto:
Subject Matter of Sheet
C.P.U.C.
Sheet No.
Title 1495-W
Table of Contents 1975-W, 1795-W, 848-W and 1906-W (T)
Preliminary Statement 919-W, 1303-W, 1699-W, 1700-W, 1702-W, 14
20-W,
1889-W, 1427-W, 1469-W, 1492-W, 1508-W, 1542-W, 1799-W, 1818-W, 1933-W and 1934-W
Service Area Map Locator 1266-W
Service Area Map Locator, Index 1589-W
Map of Areas With Special Pressure and Fire Flow Conditions 1590-W
Index to Map of Areas With
Special Pressure and
Fire Flow Conditions 1079-W, 1591-W
1082-W, 10
87-W and 1404-W
Rate Schedules:
Schedule No. 1, General Metered Service 1947-W, 1915-W and 1971-W (C)
Schedule No. 1B, General Metered
Service
With Automatic Fire Sprinkler System 1949-W, 1741-W, 1882-W and 1972-W
Schedule No. 1C, General Metered Service
Mountain District 1951-W, 1952-W, 1884-W, 1964-W and 1973-W
(C)
Schedule No. 4, Private Fire Service 1954-W and 1965-W
Schedule No. 9C, Construction and Other
Tempora
ry Metered Service 1118-W and 1094-W
Schedule No. 10R, Service to Employees 152-W
Schedule No. 14.1 Water Shortage Contingency Plan With
Staged Man
datory Reductions And Drought Surcharges
1668-W,1669-W,1780-W,1671-W,
1672-W,1673-W,1766-W, and 1820-W
Sched
ule No. RW, Raw Water Mete
red Service 1955-W, 1920-W and 1974-W
(C)
Schedule No. RCW, Recycled Water
Metered Service 1957-W, 1958-W and 1967-W
Schedule No. UF, Surcharge to Fund Public
U
tilities Commission, Reimbursement Fee 1969-W
Schedule No. WRAP, Water Rate Assistance Program 1904-W and 1211-W
List of Contracts and Deviations 1857-W
Rules:
No. 1 - Definitions 764-W and 976-W
No. 2 - Description of Service 525-W
No. 3 - Application for Service 351-W and 903-W
No. 4 - Contracts 352-W
No. 5 - Special Information Required on Forms 1936-W thru 1937-W
No. 6 - Establishment and Re-establishment of Credit 354-W
No. 7 - Deposits 355-W and 356-W
No. 8 - Notices 1054-W and 825-W
No. 9 - Rendering and Payment of Bills 996-W, 997-W and 1146-W
(To be inserted by utility)
Advice No. 532
Dec. No.
Issued by
JOHN TANG
TITLE
Vice President,
Regulatory Affairs
(To be inserted by Cal. P.U.C.)
Date Filed
Effective
Resolution No.
(Continued)
SAN JOSE WATER COMPANY (U168W)
San Jose, California
