March 2024
Hartwell Lake Draft Integrated Water
Supply Storage Reallocation Report and
Environmental Assessment and FONSI
South Carolina and Georgia
Appendix C: Climate Change Assessment
2
1.0 CLIMATE CHANGE ASSESSMENT
The US Army Corps of Engineers (USACE) Civil Works Program and its water resources
infrastructure – built and natural, structural and nonstructural – represent a tremendous
Federal investment that supports regional and national economic development, public health
and safety, and national ecosystem restoration goals.
The hydrologic and coastal processes underlying this water resources management
infrastructure are very sensitive to changes in climate and weather. Therefore, USACE has a
compelling need to understand and adapt to climate change and variability to continue
providing authorized performance despite changing conditions.
Engineering Construction Bulletin (ECB) No. 2018-14 (USACE ECB 2018) provides guidance
for incorporating climate change information in hydrologic analyses in accordance with the
USACE overarching climate change adaption policy. It calls for a qualitative analysis. The goal
of a qualitative analysis of potential climate threats and impacts to USACE hydrology-related
projects and operations is to describe the observed present and possible future climate threats,
vulnerabilities, and impacts of climate change specific to the study. This includes consideration
of both past (observed) changes as well as potential future (projected) changes to relevant
meteorological and hydrologic variables.
For more information about climate change impacts to water resources, see the overview
report, USGS Circular 1331 “Climate Change and Water Resources Management: A Federal
Perspective,” located at http://pubs.usgs.gov/circ/1331/, and also the USACE Responses to
Climate Change website at https://corpsclimate.us/.
The Hartwell Lake Draft Integrated Water Supply Storage Reallocation Study Report and
Environmental Assessment (IWSSRR/EA) prepared by the U.S. Army Corps of Engineers, Savannah
District (Corps), evaluated the feasibility of reallocating existing storage in Hartwell Lake to water
supply for four entities in the Hartwell Lake area.
Public Law 85-500, Title III, Water Supply Act of 1958, as amended (72 Stat. 319) (the Act) contains
the authority for the Corps to reallocate existing storage space to Municipal and Industrial (M&I) water
supply purposes. Section 301(b), of this Act states “…it is hereby provided that storage may be
included in any reservoir project surveyed, planned, constructed, or to be surveyed, planned, and/or
constructed… to impound water for present or anticipated future demand or need for municipal and
industrial water supply.” The Secretary of the Army may approve reallocations that do not seriously
affect other project purposes and that do not involve major structural or operational changes. If those
conditions are not met, the reallocation requires Congressional authorization.
To meet the storage reallocation requests, the Corps considered the three storage areas that reside in
the Hartwell Lake pool as alternative sources: flood storage, conservation storage, and inactive
storage. The Corps selected the conservation storage of Hartwell Lake as the most effective and
efficient water supply storage.
The study used Unimpaired Flow (UIF) data (1939-2013) developed and extended by GADNR
Environmental Protection Division (EPD) and other agencies for basin-wide modeling. HEC-
ResSim, a reservoir simulation model developed by the US Army Corps of Engineers was
used to simulate water supply withdrawals from the alternative reservoir pools to determine
changes in reservoir elevations, operations, and downstream impacts. The software simulates
3
reservoir operations for flood management, low flow augmentation and water supply for
planning studies, detailed reservoir regulation plan investigations, and real-time decision
support. HEC-ResSim model runs, an economic analysis, and an examination of
environmental impacts led to detailed investigation of alternative reservoir storage pools that
could be used for storage reallocation. The tentatively selected plan is reallocation of storage
from the Hartwell Lake conservation pool.
The study area extends from the upperbasin, where Duke Energy and Georgia power have a
series of smaller projects, to the fall-line where USACE has three significant water
management structures: Hartwell Dam, Richard B. Russell (RBR) Dam, and J. Strom
Thurmond (Thurmond) Dam. The Duke Energy projects were included in the modeling due to
a storage balance agreement between USACE and Duke. Reservoir elevations are affected
by releases from all regulating dams in the Savannah system and inflow from tributaries into
these pools.
Besides fluctuations in climate, stage and flow in the study area can be influenced by long-
term geomorphic change, changes to all three dam’s operating plans, and gage relocation.
Discharge can be influenced by changes in upstream water storage due to dam construction,
changes in land-use, and measurement techniques. These factors can make it difficult to
determine the role of climate change in affecting the hydrologic signal at the project scale. The
relevant question to answer at the project scale is whether there has been or will be changes
due to climate change and how these changes would impact the resilience of the existing
system of projects in terms of their ability to meet operating objectives for the multipurpose
authorizations.
1.1 Literature Review
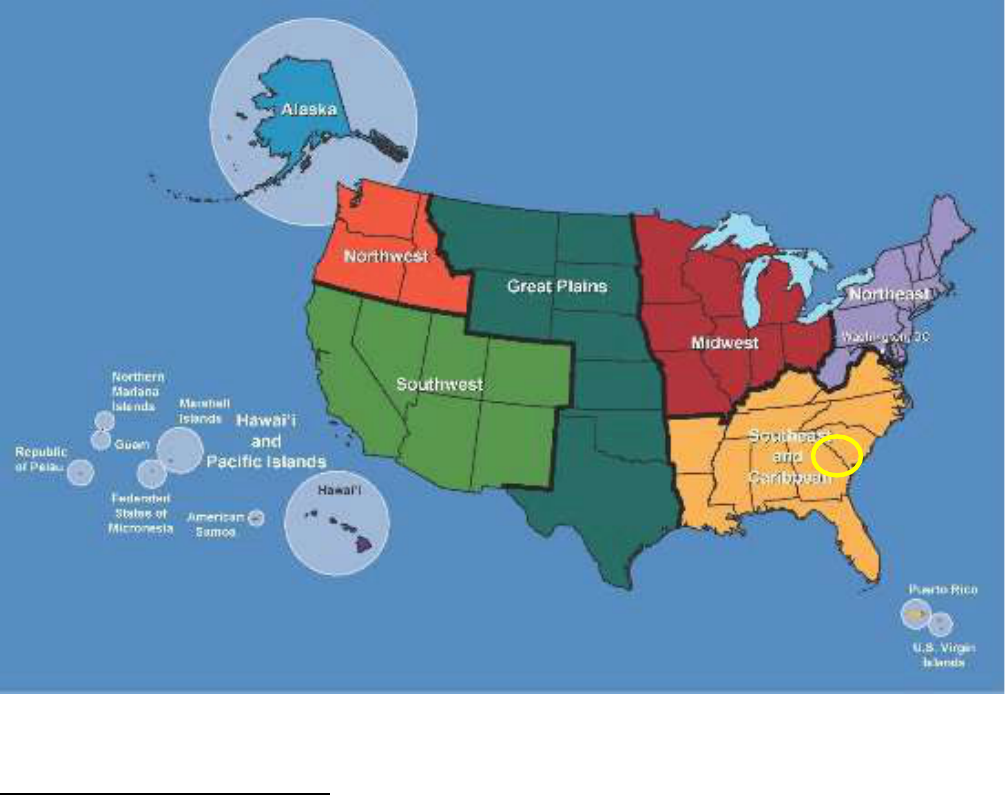
According to the Third National Climate Assessment, climate change is expected to intensify
current, observed trends in temperature and precipitation in the U.S., including the Southeast
region (Carter et al, 2014). Hartwell Dam, Richard B. Russell Dam, and J. Strom Thurmond
Dam are all located on Savannah River, on the border of Georgia and South Carolina, At
River mile 305, 275, 237.7 respectively. The project location relative to the Southeast region
is highlighted in Figure 1.
4
Figure 1. Regions identified as part of the 3
rd
National Climate Assessment – Approximate project area circled in yellow – Southeast region
is in light orange
Observed Temperature Trends
Georgia’s latitude and proximity to the warm waters of the Gulf of Mexico and the Atlantic
Ocean characterize the climate as long, hot, humid summers and short, mild winters. Over the
last 100 years, the Southeast’s observed, average annual temperatures have cycled between
warm and cool periods, but since 1970, temperatures have increased an average of 2°F. In
that time, the number of days above 95°F and nights above 75°F have been increasing, while
extremely cold days have been decreasing (Kunkel et al 2013).
Warmer temperatures have affected seasonal cycles. In the Southeast, the frost-free season
has already expanded on average by 6 days. Projections based on global climate models
suggest the trend toward a longer frost-free season is likely to continue. The southern freeze-
free zone will continue to move northward, displacing species requiring freezing (Walsh et al,
2014).
5
A positive, but mild, warming trend is identified within observed temperature records for most
of the area in the spring and summer. For the fall months, the southern portion of the area is
shown to be warming.
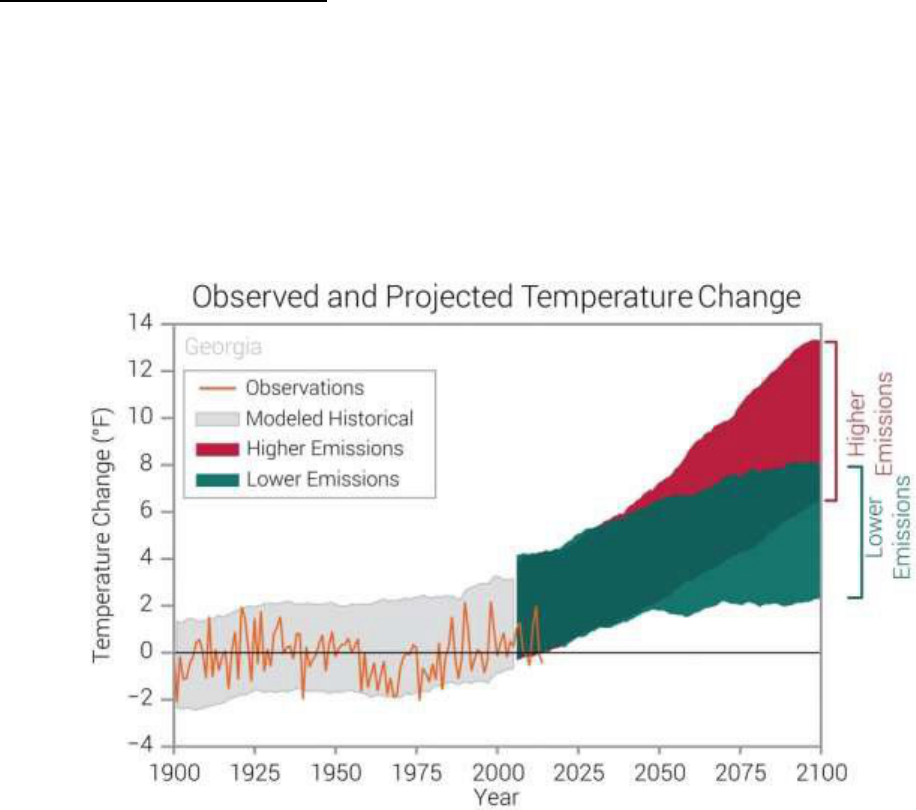
Projected Temperature Trends
Temperatures across the Southeast are projected to increase during this century as depicted
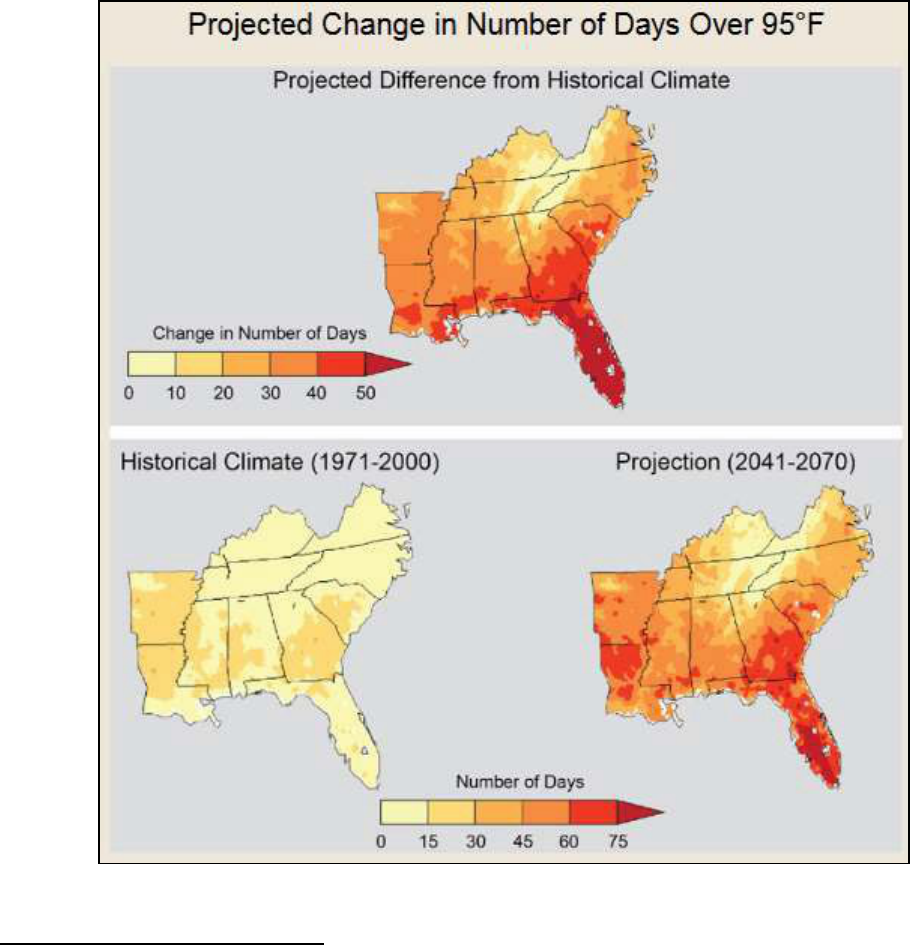
in Figures 2 and 3. Major consequences of warming include significant increases in the
number of hot days, 95°F and above (Carter et al, 2014). This increases evaporation and
decreases freezing events. Increased evaporation correlates to overall less elevation in the
reservoirs and less flow in the river, possibly exposing additional hazards around recreation
areas. Hartwell Dam, RBR Dam, and Thurmond Dam are located in the part of the region with
a projected increase in number of days above 95°F of approximately 45-60 days. Further,
climate change is expected to increase harmful algal blooms and several disease-causing
agents in inland waters, not previously problems in the region (Carter et al, 2014).
Figure 2: Georgia observed temperature change (orange line) and projected temperature change Source: CICS-NC/NOAA NCEI
6
Figure 3: Projected Change in Number of Days over 95°F (Source: NOAA NCDC/CICS-NC)
Observed Precipitation Trends
Georgia receives frequent precipitation throughout the year, ranging from upwards of 80
inches in the mountainous northeastern corner of the state to around 45 inches in the eastern
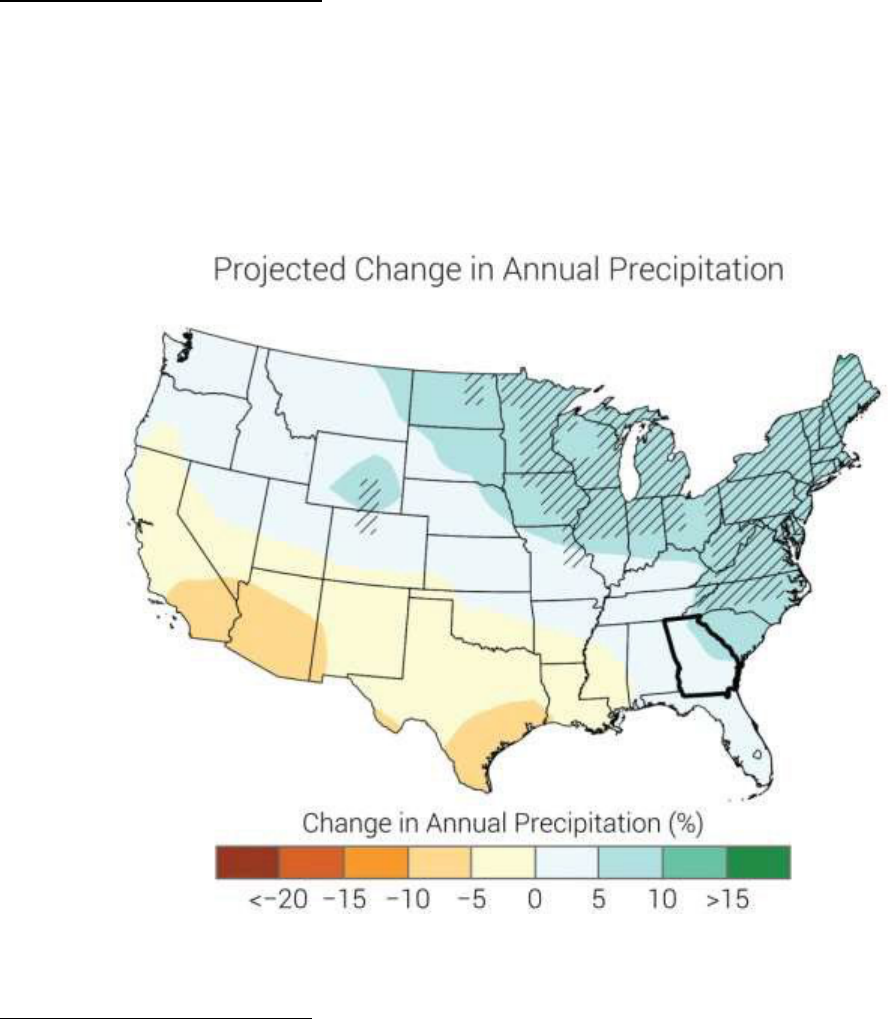
and central portions. Precipitation projections for Georgia are uncertain (Figure 4). Even if
average annual precipitation remains constant, higher temperatures will increase evaporation
rates and decrease soil moisture during dry spells, leading to greater drought intensity. This
could increase competition for limited water resources, which currently support large
population centers like the City of Augusta, and others that are contracted to pull water from
the reservoirs.
The Eastern portion of the Southeast has observed drier conditions whereas the rest of the
region has experienced wetter conditions. Daily and five-day observed rainfall intensities have
increased (Ingram et al 2013), but summers have been either increasingly dry or extremely
wet, which is indicative of the variability of the climate in the Southeast (Kunkel et al 2013).
Linear trends in observed annual precipitation indicate a -2 to -5% reduction in precipitation in
7
the upper Savannah River Basin and a +2 to +5% increase in precipitation in the lower
Savannah River Basin (McRoberts and Nielsen-Gammon, 2011). The Southeast has seen a
27% increase in heavy precipitation events (defined as the heaviest 1% of all daily events)
since 1900 (Karl et al 2009) and is projected to see a varied increase in storm severity and in
the frequency of severe storms in the future.
Projected Precipitation Trends
The frequency and intensity of precipitation is projected to increase more across the northern
portion of the region and show less of an increase in the southern part of the Southeast region.
As can be seen in Figure 4, precipitation is projected to increase throughout Georgia, however,
these changes are small relative to the natural variability in this region. Seasonal differences in
precipitation will have a significant effect on many hydrologic processes. Soil moisture, critical
for vegetation and agriculture, is determined in part by precipitation and temperature, which
drives evapotranspiration (ET). Soil moisture fluctuates seasonally and has been observed to
be decreasing over time in the Southeast (Hay et al 2011, Zhang and Georgakakos 2011).
Figure 4: Climate model projections of changes (%) in annual precipitation for the middle of the 21st century compared to the late 20th
century under a higher emissions pathway. Source: CICS-NC, NOAA NCEI, and NEMAC.
Observed Streamflow Trends
Studies of trends and non-stationarities in streamflow datasets collected over the past century
have been performed throughout the continental U.S., some of which include the South
Atlantic-Gulf Region. With the exception of two stations in Florida, the vast majority of stations
distributed throughout the region showed no significant trend in streamflow in either direction

8
(USACE, 2015).
In contrast to the findings described above, Kalra et al. (2008) found statistically significant
negative trends in annual and seasonal streamflow for a large number of stream gages in the
South Atlantic-Gulf Region, analyzed in aggregate, for the historical period 1952 – 2001
(USACE, 2015). A study by Patterson et al. (2012) also observed a “transition” period
occurring around 1970, as well as identified significant decreasing trends in streamflow in the
South Atlantic-Gulf Region for the period 1970 – 2005. Results were mixed for an earlier time
period (1934 – 1969), with some decreasing and some increasing trends (USACE, 2015).
While several studies contradict each other in terms of observed streamflow trends in the
Southeast Region, overall a mild downward trend in mean streamflow in the Southeast Region,
particularly since the 1970s, has been identified by multiple authors.
Projected Streamflow Trends
A number of global and national scale studies have attempted to project future changes in
hydrology, relying primarily on a combination of GCMs and macro-scale hydrologic models.
These studies include projections of potential hydrologic changes in the South Atlantic-Gulf
Region. Thomson et al. (2005) applied two GCMs, across a range of varying input
assumptions, in combination with the macro-scale Hydrologic Unit Model to quantify potential
changes in water yield across the United States. For the South Atlantic-Gulf Region,
contradictory results are generated by the two GCMs. For the same set of input assumptions,
one model predicts significant decreases in water yield, the other projects significant increases
in water yield (USACE, 2015). No clear consensus has been found in projected streamflow
changes in the South Atlantic-Gulf Region. Some studies point toward mild increases in flow,
while other studies point toward mild decreases in projected streamflow.
Summary
There is strong agreement in the literature that temperature for the Southeast region, and the
entire country, will increase over the next century. The studies generally agree on an increase
in mean annual air temperature of approximately 2 to 4 °C by the latter half of the 21st century
for the South Atlantic-Gulf Region (USACE, 2015). Projections for precipitation events and
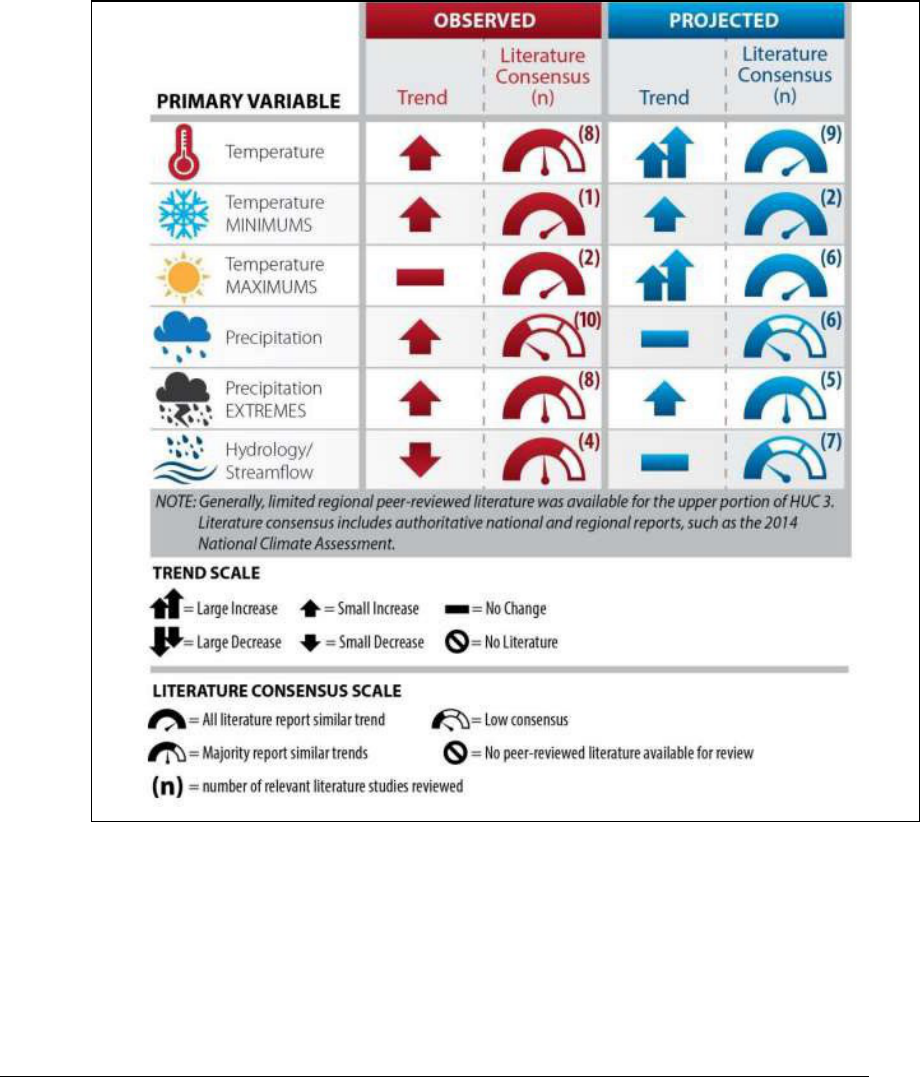
hydrology are less certain than temperature projections for the Southeast Region. Figure 5
shows a summary matrix of observed and projected climate trends and projections for the
HUC 03, which is the South Atlantic-Gulf Region, where Hartwell Dam, RBR Dam, and
Thurmond Dam are located.
9
Figure 5: Summary Matrix of Observed and Projected Climate Trends and Literary Consensus (Source: USACE Climate Change Assessment
for Water Resources Region 03).
The Southeast is also vulnerable to flooding caused by sea level rise. While sea-level rise is
expected for the Southeast Region, the IWSSRR/EA focus projects are several hundred miles
inland of the coast and therefore will not be impacted by the effects of sea level rise. The
elevations in the study area are considerably higher than the 50 foot NAVD88 threshold which
necessitates considering sea level change as part of the analysis.
Precipitation and Temperature Trend Assessment Specific to the State of Georgia
A study conducted by Binita, Shepherd and Gaither in 2015 sought to quantify the state of
Georgia’s vulnerability to climate change using an integrated approach which takes into
account socioeconomic conditions, as well as changing biophysical conditions. The Binita,
Shepherd and Gaither study found that temperature trends observed within the study area are
consistent with trends observed throughout the Southeast Region. Temperatures have been
10
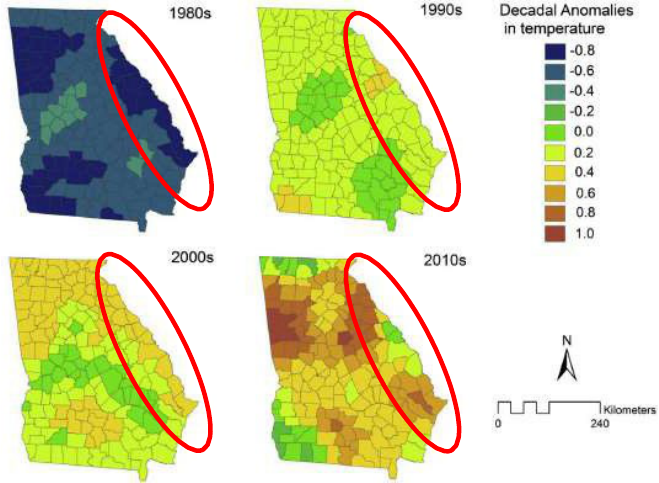
increasing in recent decades. As can be seen in Figure, 6, between 1975 and 1984 there was
a period of cooling in the region, but greater anomalies in temperature reflecting a warming
trend have been observed in the decades since then.
Figure 6. Historic Temperature Trends in the State of Georgia. Study area circled in red. “Anomalies in decadal temperature in 1980s
(1975-1984), 1990s (1985-1994), 2000s (1995-2004), and 2010s (2005-2012) compared to the 30-year climate normal (1971-2000).
Gradation of brown color code indicates positive temperature anomaly while blue gradation indicates negative temperature anomaly
(Binita, Shepherd & Gaither 2015).”
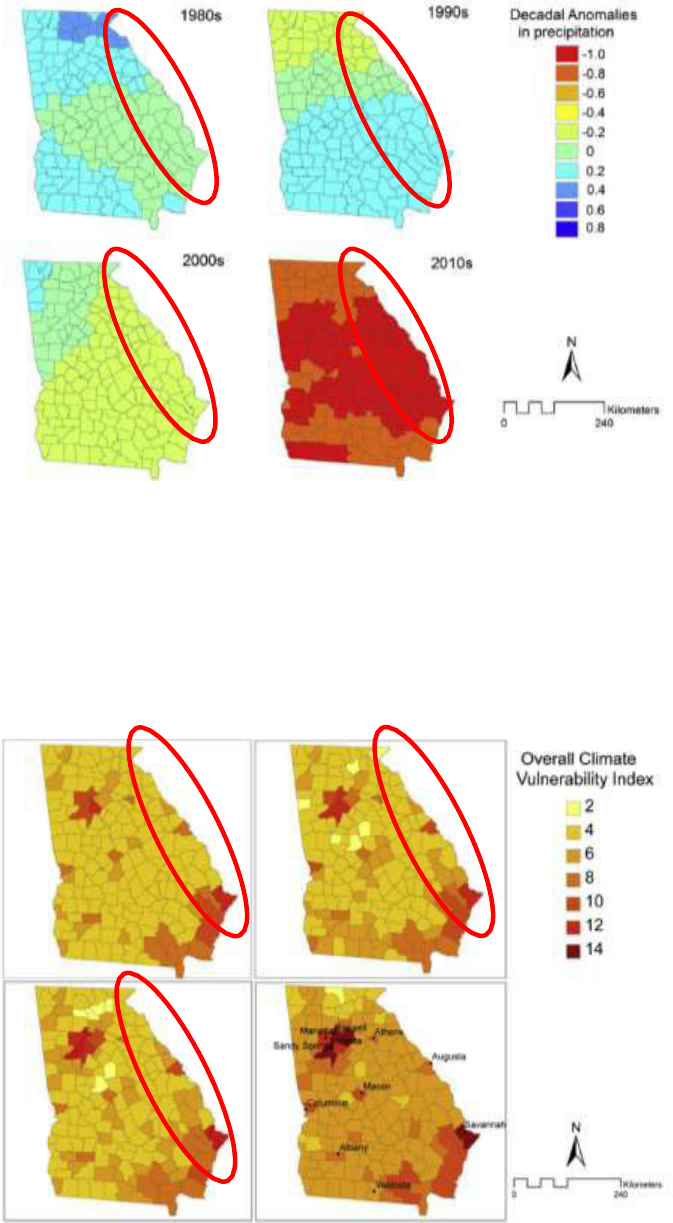
As indicated within Figure 7, Georgia has been experiencing drier conditions. There has been
an increase in the number of moderate to severe droughts between 2000 and present. The
Binita, Shepherd and Gaither (2015) paper also indicates that the state of Georgia has been
experiencing more flood events in recent decades.
11
Figure 7. Historic Precipitation Trends in the State of Georgia. Study area circled in red. “Anomalies in decadal precipitation in 1980s
(1975-1984), 1990s (1985-1994), 2000s (1995-2004), and 2010s (2005-2012) compared to the 30-year climate normal (1971-2000).
Gradation of blue color code indicates positive precipitation anomaly, that is, increase in precipitation while red gradation indicates
negative precipitation anomaly, that is, decrease in precipitation (Binita, Shepherd & Gaither 2015).”
In addition to evaluating hydroclimatic variables to assess climate change vulnerability, Binita,
Shepherd & Gaither (2015) also evaluated changing social and land cover conditions in
Georgia to identify which portions of the state are likely most vulnerable to climate change
impacts. The results of their vulnerability assessment are displayed in Figure 8.
Figure 8. Overall climate vulnerability index derived by combing the climate change vulnerability index and geographic vulnerability.
Gradation of red indicates high overall climate vulnerability (Binita, Shepherd & Gaither 2015).” Study area circled in red.
12
1.2 First Order Statistical Analysis: Trends in Streamflow & Climate Change at a Regional Scale
The USACE Climate Hydrology Assessment Tool was used to investigate potential future
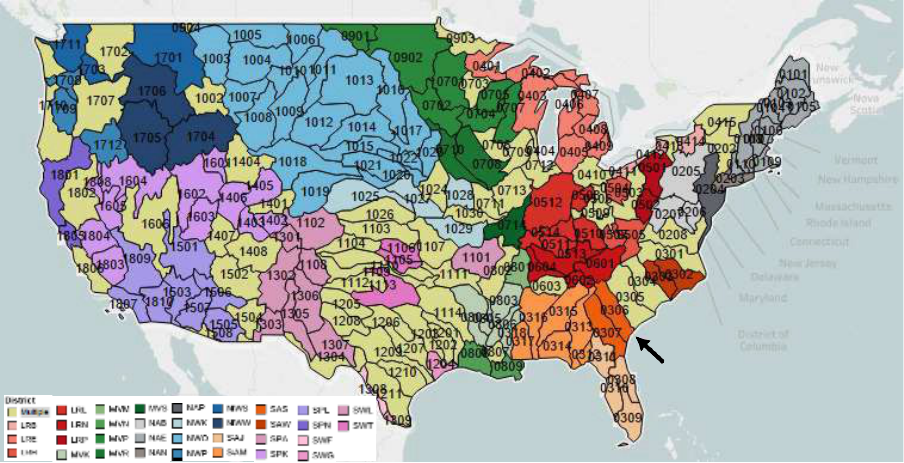
trends in streamflow for HUC 0306, the Ogeechee-Savannah watershed. Figure 9 below
shows the location of the project area relative to the HUC04 watershed delineations.
Figure 9: Reference Map of HUC 4 Watersheds by District. The Ogeechee-Savannah is highlighted by the black arrow.
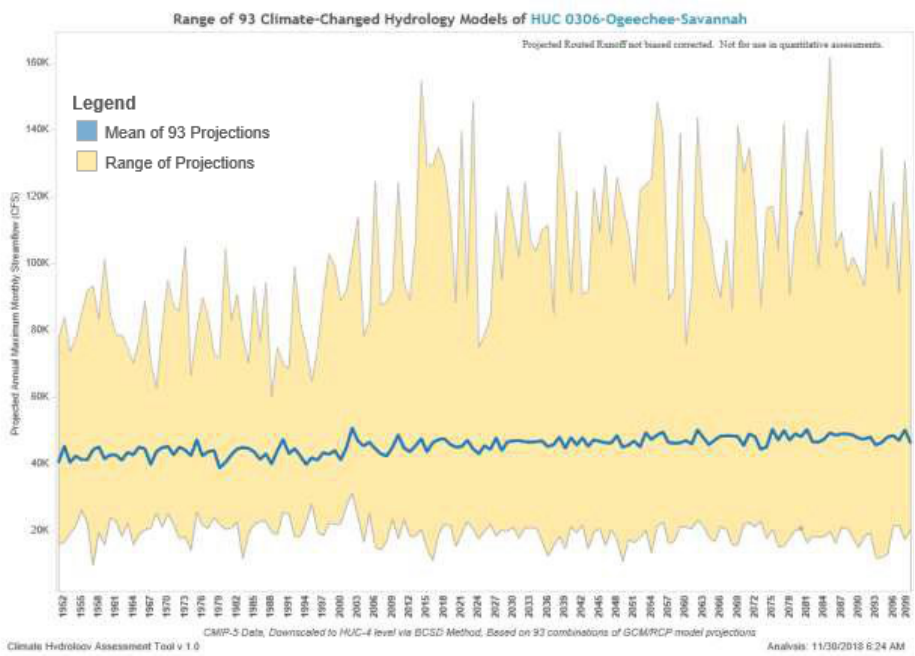
Figure 10 displays the range of projected annual maximum monthly streamflows computed
from 93 different climate changed hydrologic model runs for the period of 1951-2099. Climate
Changed hydrology output is generated using various greenhouse gas emission scenarios
(RCPs) and global circulation models (GCM) to project precipitation and temperature data into
the future. These meteorological outputs are spatially downscaled using the BCSD statistical
method and then inputted in the U.S. Bureau of Reclamation’s Variable Infiltration Capacity
(VIC) precipitation-runoff model to generate a streamflow response. The VIC model represents
unregulated basin conditions. This is relevant because the Ogeechee-Savannah basin is
impacted by regulation. As expected for this type of qualitative analysis, there is considerable,
but consistent spread in the projected annual maximum monthly flows. The spread in the
projected annual maximum monthly flows is indicative of the high degree of uncertainty
associated with projected, climate changed hydrology.
13
Figure 10: Range of Projected Annual Maximum Monthly Streamflow among Ensemble of 93 Climate-Changed Hydrology Models, HUC
306 Ogeechee-Savannah.
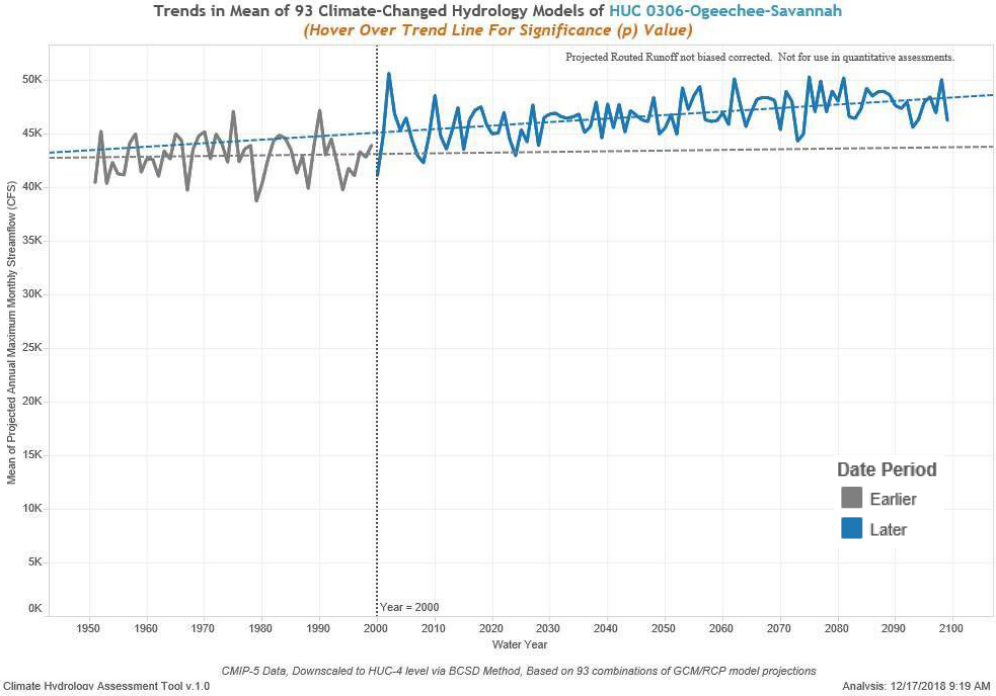
There is no statistically significant trend in the data modeled using GCM inputs for the hindcast
period (1951-1999). There is a statistically significant (p-value <0.0001) increasing trend in the
mean projected annual maximum monthly streamflow for 2000-2099(AMMS; Figure 11). The
p-value is for the linear regression fit drawn; a smaller p-value indicates greater statistical
significance. There is no recommended threshold for statistical significance, but typically 0.05
is used as this is associated with a 5% risk of a Type I error or a false positive. This finding
suggests that there is potential for AMMS to increase in the future in the study area, relative to
the current conditions.
14
Figure 11: Mean Projected Annual Maximum Monthly Streamflow, HUC 306 Ogeechee-Savannah.
1.3 Screening Level Vulnerability Assessment to Climate Change Impacts
The USACE Watershed Climate Vulnerability Assessment Tool (VA Tool) was used to
compare the relative vulnerability to climate change of the HUC 0306, Ogeechee-Savannah
watershed, to all HUC 04 watersheds across the continental United States (CONUS). The tool
facilitates a screening level, comparative assessment of how vulnerable a given HUC 04
watershed is to the impacts of climate change. The tool can be used to assess the vulnerability
of a specific USACE business line such as “Ecosystem Restoration” to projected climate
change impacts. Assessments using this tool help to identify and characterize specific climate
threats and particular sensitivities or vulnerabilities, at least in a relative sense, across regions
and business lines. The tool can be found on https://maps.crrel.usace.army.mil/apex/f?p=170 .
The three (4) USACE business lines relevant to the IWSSRR/EA study are Recreation, Water
Supply, Hydropower, and Flood Risk Reduction. The tool uses the Weighted Order Weighted
Average (WOWA) method to represent a composite index of how vulnerable a given HUC 04
watershed (Vulnerability Score) is to climate change specific to a given business line.
WOWA stands for “Weighted Ordered Weighted Average,” which reflects the aggregation
approach used to get the final score for each HUC. After normalization and standardization of
indicator data, the data are weighted with “importance weights” determined by the Corps (the
first “W”). Then, for each HUC-epoch-scenario, all indicators in a business line are ranked
according to their weighted score, and a second set of weights (which are the OWA weights),”
are applied, based on the specified ORness level. This yields a single aggregate score for
15
each HUC-epoch-scenario called the WOWA score. WOWA indicator contributions are
calculated after the aggregation to give a sense of which indicators dominate the WOWA score
at each HUC. Further information regarding indicators can be found in Table 1.
Indicators considered within the WOWA score for Recreation (Table 3) include: two indicators
of flood flow, runoff elasticity (ratio of streamflow runoff to precipitation), short-term variability in
hydrology, change in sediment load, drought severity, two indicators of flood magnification
(indicator of how much high flows are projected to change overtime), and change in low runoff.
Indicators considered within the WOWA score for Water Supply (Table 4) include: change in
sediment load, long-term variability in hydrology, short-term variability in hydrology, runoff
elasticity (ratio of streamflow runoff to precipitation), and drought severity.
Indicators considered within the WOWA score for Flood Risk Reduction (Table 5) include:
long-term variability in hydrology, runoff elasticity (ratio of streamflow runoff to precipitation),
two indicators of flood magnification (indicator of how much high flows are projected to change
overtime), and the acres of urban area within the 500-year floodplain.
When assessing future risk projected as a result of climate change, the USACE VA Tool
makes an assessment for two 30-year epochs of analysis centered at 2050 and 2085. These
two periods were selected to be consistent with many of the other national and international
analyses. The tool assesses how vulnerable a given HUC 04 watershed is to the impacts of
climate change for a given business line using climate changed hydrology based on a
combination of projected climate outputs from the general climate models (GCMs) and
representative concentration pathway (RCPs) resulting in 100 traces per watershed per time
period. The top 50% of the traces by flow magnitude is called the “wet” subset of traces and
the bottom 50% of the traces is called the “dry” subset of traces. Meteorological data projected
by the GCMs is translated into runoff using the VIC macroscale hydrologic model.
Because projected, climate changed meteorology and hydrology is used to compute indicator
variables there is a significant amount of uncertainty in the data used to generate vulnerability
scores. Many of the indicators included in the VA Tool rely on an ensemble of GCMs to
capture some of the uncertainty inherent in climate projections. Some of this uncertainty is
revealed by the tool by presenting separate results for each of the scenario-epoch
combinations rather than presenting a single aggregate result.
For this assessment the default, National Standards Settings are used to carry out the
vulnerability assessment.

16
Table 1: Descriptions for indicators used in the IWSSRR/EA Vulnerability Tool analysis.
Indicator Short Name
Indicator Name
Large Values = High
Vulnerability
Indicator Description
Data Sources
Last
Updated
8 AT RISK FRESHWATER PLANT
% of freshwater plant
communities at risk
Yes
% of wetlands & riparian plant
communities that are at risk of
extinction, based on remaining number
& condition, remaining acreage, threat
severity, etc.
NatureServe - Explorer (customized
dataset). Data were obtained from
Jason McNees at NatureServe,
1101 Wilson Blvd., 15th Floor
Arlington, VA 22201 via email on
July 31, 2009
Feb-2016
65L MEAN ANNUAL RUNOFF
Mean annual runoff
(local)
No
Mean runoff: average annual runoff,
excluding upstream freshwater inputs
(local).
Data calculated from interagency
CMIP5 GCM - BCSD - VIC dataset
(2014)
Sep-2014
95 DROUGHT SEVERITY
Drought Severity Index
Yes
Greatest precipitation deficit: The most
negative value calculated by
subtracting potential
evapotranspiration from precipitation
over any 1-, 3-, 6-, or 12-month period.
Data calculated from interagency
CMIP5 GCM - BCSD - VIC dataset
(2014)
Jul-2015
156 SEDIMENT
Change in sediment
load due to change in
future precipitation
Yes
The ratio of the change in the sediment
load in the future to the present load.
CDM
Feb-2016
175L ANNUAL COV
Annual CV of
unregulated runoff
(local)
Yes
Long-term variability in hydrology:
ratio of the SD of annual runoff to the
annual runoff mean. Excludes upstream
freshwater inputs (local).
Data calculated from interagency
CMIP5 GCM - BCSD - VIC dataset
(2014)
Sep-2014
221C MONTHLY COV
Monthly CV of runoff
(cumulative)
Yes
Measure of short-term variability in the
region's hydrology: 75th percentile of
annual ratios of the SD of monthly
runoff to the mean of monthly runoff.
Includes upstream freshwater inputs
(cumulative).
Data calculated from interagency
CMIP5 GCM - BCSD - VIC dataset
(2014)
Sep-2014
277 RUNOFF PRECIP
% change in runoff
divided by % change in
precipitation
Yes
Median of: deviation of runoff from
monthly mean times average monthly
runoff divided by deviation of
precipitation from monthly mean times
average monthly precipitation.
Data calculated from interagency
CMIP5 GCM - BCSD - VIC dataset
(2014) using method of
Sankarasubramanian & Vogel
2001 WRR 37(6)1771-1781
Feb-2015
297 MACROINVERTEBRATE
Macroinvertebrate
index of biotic
condition
No
The sum (ranging from 0-100) of scores
for six metrics that characterize
macroinvertebrate assemblages:
taxonomic richness, taxonomic
composition, taxonomic diversity,
feeding groups, habits, pollution
tolerance.
USEPA - Wadeable Streams
Assesment (WSA) (Stream Water
Benthic Macroinvertebrate
Metrics)
Feb-2016
568C FLOOD MAGNIFICATION
Flood magnification
factor (cumulative)
Yes
Change in flood runoff: ratio of
indicator 571C (monthly runoff
exceeded 10% of the time, including
Data calculated from interagency
CMIP5 GCM - BCSD - VIC dataset
(2014)
Sep-2014
568L FLOOD MAGNIFICATION
Flood magnification
factor (local)
Yes
Change in flood runoff: Ratio of
indicator 571L (monthly runoff
exceeded 10% of the time, excluding
upstream freshwater inputs) to 571L in
base period.
Data calculated from interagency
CMIP5 GCM - BCSD - VIC dataset
(2014)
Sep-2014
570L 90PERC EXCEEDANCE
Low flow (monthly
flow exceeded 90% of
time; local)
No
Low runoff: monthly runoff that is
exceeded 90% of the time, excluding
upstream freshwater inputs (local).
Data calculated from interagency
CMIP5 GCM - BCSD - VIC dataset
(2014)
Sep-2014
571C 10PERC EXCEEDANCE
Flood flow (monthly
flow exceeded 10% of
time; cumulative)
Yes
Flood runoff: monthly runoff that is
exceeded 10% of the time, including
upstream freshwater inputs
(cumulative).
Data calculated from interagency
CMIP5 GCM - BCSD - VIC dataset
(2014)
Sep-2014
571L 10PERC EXCEEDANCE
Flood flow (monthly
flow exceeded 10% of
time; local)
Yes
Flood runoff: monthly runoff that is
exceeded 10% of the time, excluding
upstream freshwater inputs (local).
Data calculated from interagency
CMIP5 GCM - BCSD - VIC dataset
(2014)
Sep-2014
590 URBAN 500YRFLOODPLAIN
AREA
Acres of urban area
within 500-year
floodplain
Yes
Acres of urban area within the 500-year
floodplain.
(1)
FEMA - 500 year Flood Zones
(2)
EPA - Integrated Climate & L&
Use Scenarios (ICLUS)
Jan-2011
700C LOW FLOW REDUCTION
Low flow reduction
factor (cumulative)
No
Change in low runoff: ratio of indicator
570C (monthly runoff exceeded 90% of
the time, including upstream
freshwater inputs) to 570C in base
period.
Data calculated from interagency
CMIP5 GCM - BCSD - VIC dataset
(2014)
Sep-2014

17
The results of the USACE VA Tool analysis of the five business lines in the HUC 306
Ogeechee-Savannah watershed are found in Table 2. Within Table 2, a comparison can be
made between the Ogeechee-Savannah watershed’s WOWA scores, the CONUS Range of
WOWA scores, and the South Atlantic Division- USACE (SAD) range of WOWA scores. The
SAD is compromised of the states of Florida, Alabama, Georgia, South Carolina, North
Carolina, and Delaware, as well as a portion of Eastern Mississippi (see figures below). The
Ogeechee-Savannah watershed is not considered vulnerable to the impacts of climate change
for the ecosystem restoration, recreation, water supply and flood risk reduction business lines
(does not falls within the top 20% of vulnerability scores) relative to the other 201 HUC 04
watersheds in the CONUS.
Table 2: Projected Vulnerability (WOWA Score) comparison chart.
Summary of Vulnerability
Business Line
Scenario -
Epoch
WOWA Score
Range Nationally
Range SAD
Recreation
Dry
2050
59.17
57.05 - 74.39
58.65 - 61.20
Dry
2085
68.19
57.42 - 82.23
62.53 - 76.96
Wet
2050
57.67
57.67 - 85.65
57.67 - 60.40
Wet
2085
57.23 56.67 - 83.62 56.67 - 66.63
Water Supply
Dry
2050
46.57
43.70 - 73.54
43.70 - 46.57
Dry
2085
60.70
46.91 - 79.27
50.13 - 60.70
Wet
2050
55.98
49.86 - 80.34
53.78 - 56.03
Wet
2085
58.03 49.42 - 81.82 56.56 - 60.68
Flood Risk Reduction
Dry
2050
43.81
35.15 - 70.08
41.53 - 67.07
Dry
2085
44.20
35.66 - 69.10
41.93 - 68.18
Wet
2050
47.73 39.80 - 92.85 46.76 - 70.46
Wet
2085
48.65 40.86 - 86.71 47.65 - 71.78
Hydropower
Dry
2050
62.351
59.47 - 86.29
61.95 - 62.77
Dry
2085
68.981
60.30 - 87.74
61.87-78.2
Wet
2050
65.67
61.07 – 88.02
63.53 – 66.38
Wet
2085
67.72 62.49 – 90.28
65.76-68.53

18
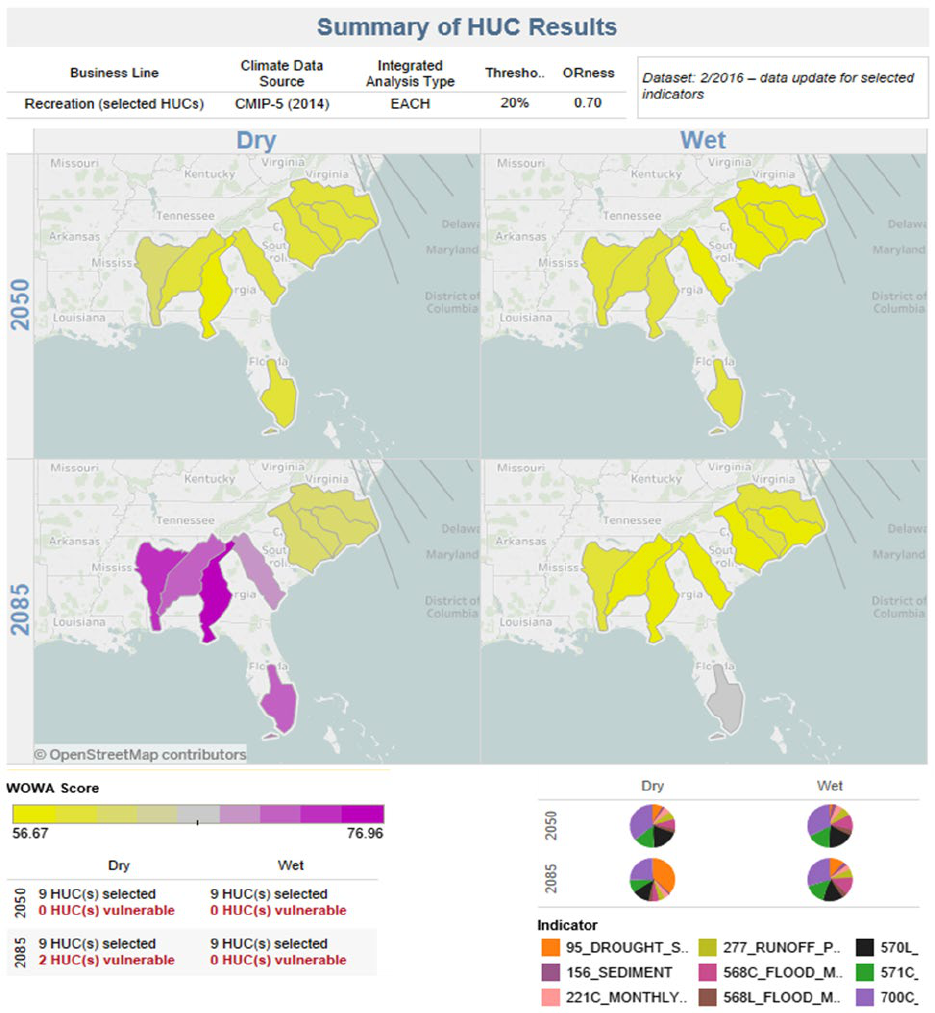
Relative to the other HUC 04 watersheds in SAD, the Ogeechee-Savannah watershed is
relatively less vulnerable to the impacts of climate change on recreation for both the wet and
dry subsets of traces (Figure 13). For the Ogeechee-Savannah watershed, the major drivers
of the recreation vulnerability score are, “Low Flow Reduction”, the local and cumulative “90%
Exceedance” (Table 3). “Drought Severity” is a major driver of the computed recreation
vulnerability score in the 2085 dry subset of traces.
Table 3: Indicators associated with Recreation and their contribution to the WOWA scores.
Recreation
Dry Scenario
Indicator #
2050
Value
2050 % Score
2085 Value
2085 % Score
% Change
571C 90PERC EXCEEDANCE FLOW 8.47 14.31 6.01 8.81 -29.07
570L 90PERC EXCEEDANCE FLOW
12.25
20.70
8.75
12.83
-28.56
277 RUNOFF PRECIP (Elasticity)
3.13
5.29
2.96
4.33
-5.56
221C MONTHLY COV (Flow
variability)
2.25
3.81
2.12
3.11
-6.03
156 SEDIMENT LOAD
0.89
1.51
0.75
1.11
-15.70
95 DROUGHT SEVERITY
4.07
6.88
27.00
39.59
563.25
568C FLOOD MAGNIFICATION
5.37
9.07
3.85
5.64
-28.32
568L FLOOD MAGNIFICATION
1.35
2.28
1.25
1.84
-6.89
700C LOW FLOW REDUCTION
21.39
36.15
15.51
22.74
-27.52
Wet Scenario
Indicator #
2050
Value
2050 % Score
2085 Value
2085 % Score
% Change
571C 90PERC EXCEEDANCE
8.95
15.53
8.87
15.50
-0.95
570L 90PERC EXCEEDANCE
12.09
20.97
11.81
20.64
-2.29
277 RUNOFF PRECIP (Elasticity)
4.35
7.55
4.18
7.31
-3.88
221C MONTHLY COV (Flow
variability)
2.91
5.05
1.69
2.95
-42.08
156 SEDIMENT LOAD
1.61
2.79
2.88
5.04
79.54
95 DROUGHT SEVERITY
0.49
0.85
2.20
3.84
349.86
568C FLOOD MAGNIFICATION
6.45
11.18
6.58
11.49
1.98
568L FLOOD MAGNIFICATION
2.10
3.64
1.27
2.22
-39.57
700C LOW FLOW REDUCTION
18.71
32.44
17.75
31.01
-5.14
19
Recreation
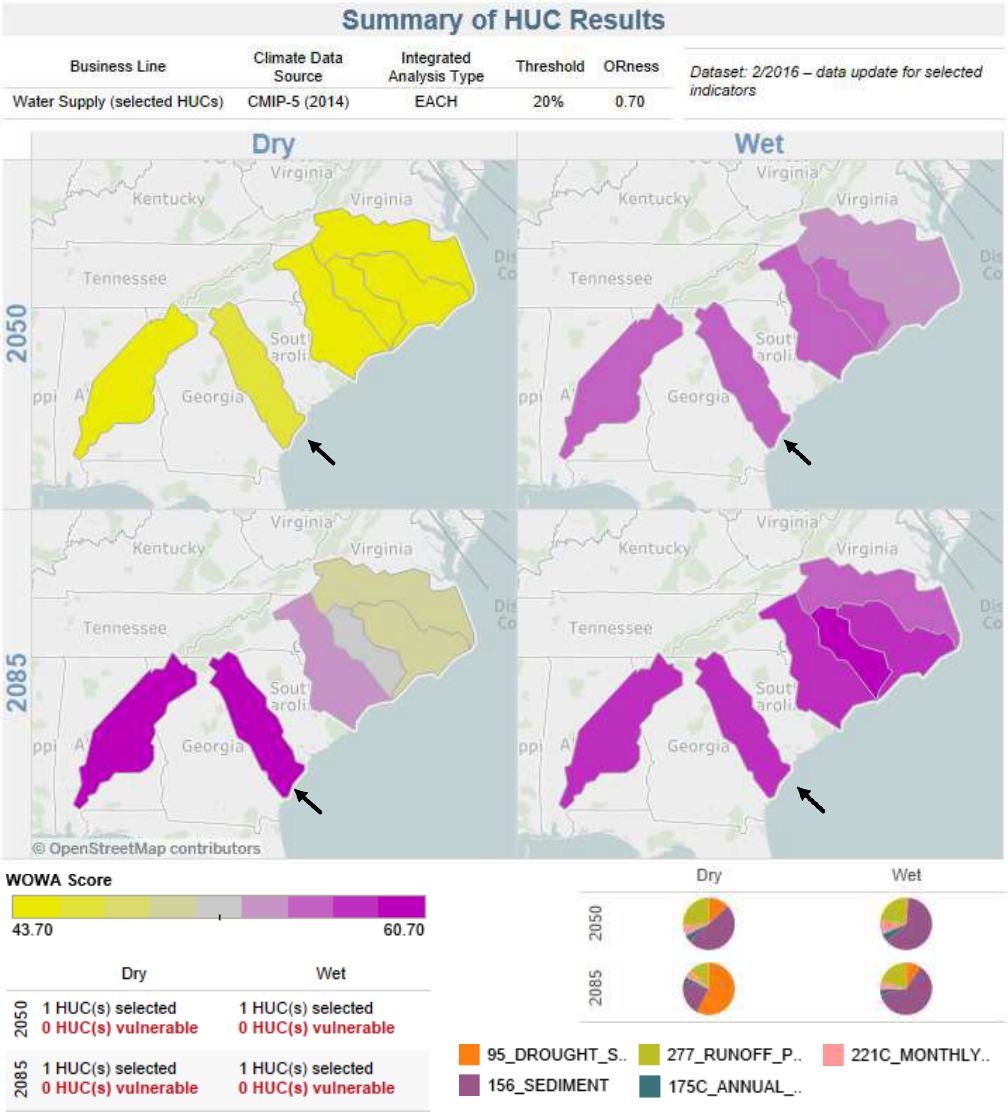
Figure 12: Results of the USACE climate vulnerability analysis for the Water Supply WOWA score of the Ogeechee-Savannah watershed
(highlighted by the black arrow) compared to SAD.

20
Relative to the other HUC 04 watersheds in SAD, the Ogeechee-Savannah watershed is
relatively more vulnerable to the impacts of climate change on water supply for both the wet
and dry subsets of traces (Figure 13). For the Ogeechee-Savannah watershed, the major
drivers of the computed water supply vulnerability score are, “Sediment Load” and the “Runoff
Elasticity.” For the 2085 dry subset of traces, “Drought Severity” also contributes significantly
to the vulnerability score (Table 4).
Table 4: Indicators associated with Water Supply and their contribution to the WOWA scores.
Water Supply
Dry Scenario
Indicator #
2050 Value
2050 % Score
2085 Value
2085 % Score
% Change
156 SEDIMENT LOAD
23.55
50.57
13.21
21.76
-43.91
175C ANNUAL COV (Flow
Variability)
1.89
4.07
1.78
2.93
-6.01
221C MONTHLY COV (Flow
Variability
3.07
6.60
3.02
4.98
-1.61
277 RUNOFF PRECIPITATION
(Elasticity)
12.00
25.77
7.71
12.70
-35.76
95 DROUGHT SEVERITY
6.05
13.00
34.97
57.62
477.80
Wet Scenario
Indicator #
2050 Value
2050 % Score
2085 Value
2085 % Score
% Change
156 SEDIMENT LOAD
34.62
61.84
36.00
62.03
3.99
175C ANNUAL COV (Flow
Variability)
2.84
5.08
1.79
3.09
-36.83
221C MONTHLY COV (Flow
Variability
4.73
8.45
2.90
5.00
-38.68
277 RUNOFF PRECIPITATION
(Elasticity)
12.91
23.07
11.99
20.66
-7.17
95 DROUGHT SEVERITY 0.88 1.57 5.35 9.22 509.96
21
Water Supply
Figure 13: Results of the USACE climate vulnerability analysis for the Water Supply WOWA score of the Ogeechee-Savannah watershed
(highlighted by the black arrow) compared to SAD.

22
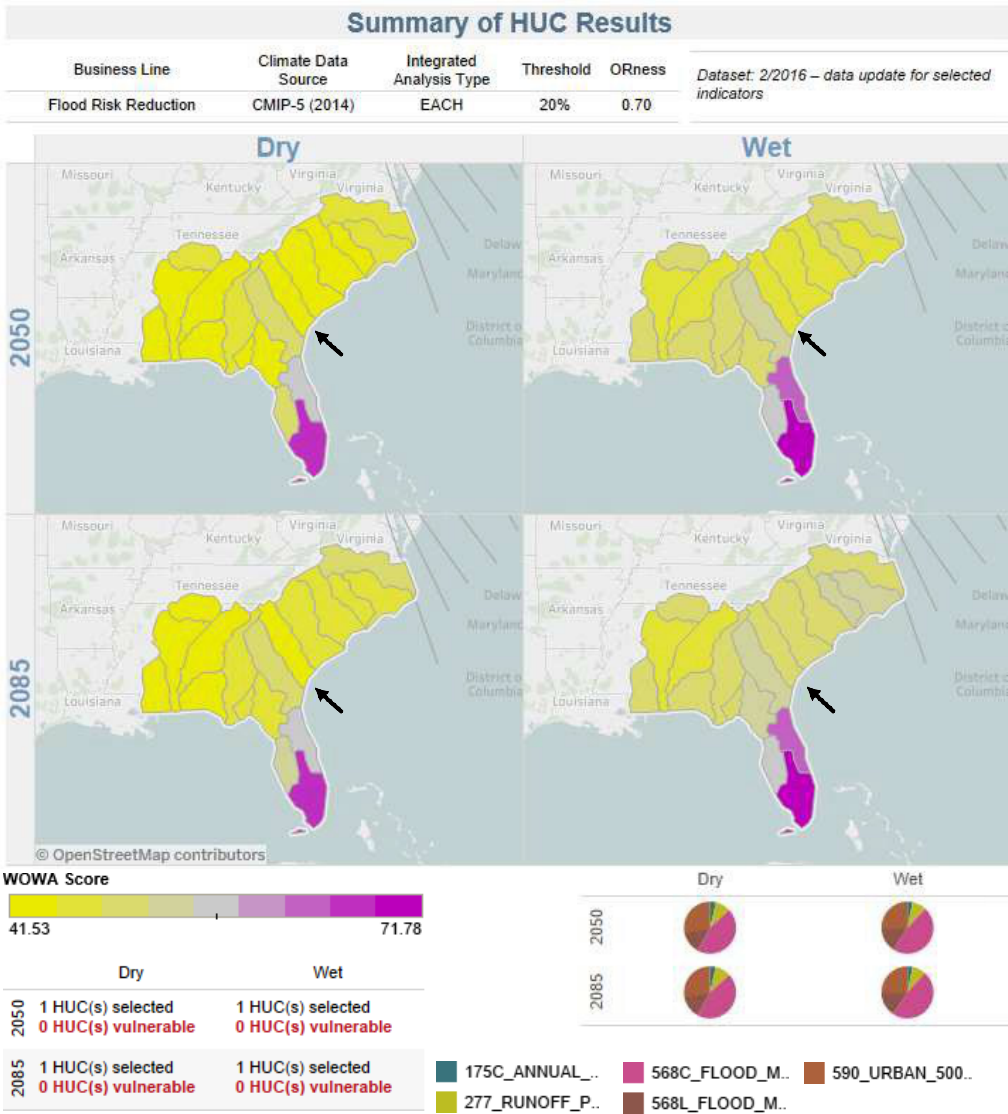
Relative to the other HUC 04 watersheds in SAD, the Ogeechee-Savannah watershed is
relatively less vulnerable to the impacts of climate change on Flood Reduction for both the wet
and dry subsets of traces (Figure 14). For the Ogeechee-Savannah watershed, the major
drivers of the computed flood risk reduction vulnerability score are, local and cumulative “Flood
Magnification”, and the “Urban 500 YR Floodplain Area” (Table 5).
Table 5: Indicators associated with Flood Risk Reduction and their contribution to the WOWA scores.
Flood Risk Reduction
Dry Scenario
Indicator #
2050 Value
2050 % Score
2085 Value
2085 % Score
% Change
175C ANNUAL COV (Flow
Variability)
1.66
3.79
1.62
3.66
-2.47
277 RUNOFF PRECIPITATION
(Elasticity)
4.10
9.35
4.20
9.51
2.61
568C FLOOD MAGNIFICATION
19.51
44.55
19.74
44.66
1.17
568L FLOOD MAGNIFICATION
6.41
14.62
6.48
14.66
1.17
590 URBAN 500YR FLOODPLAIN
AREA
12.13 27.69 12.16 27.51 0.23
Wet Scenario
Indicator #
2050 Value
2050 % Score
2085 Value
2085 % Score
% Change
175C ANNUAL COV (Flow
Variability)
1.54
3.23
1.57
3.23
1.96
277 RUNOFF PRECIPITATION
(Elasticity)
4.20
8.80
4.09
8.41
-2.67
568C FLOOD MAGNIFICATION
22.48
47.09
23.21
47.71
3.26
568L FLOOD MAGNIFICATION
7.38
15.46
7.62
15.66
3.26
590 URBAN 500YR FLOODPLAIN
AREA
12.13 25.42 12.16 24.99 0.23
23
Flood Risk Reduction
Figure 14: Results of the USACE climate vulnerability analysis for the Flood Risk Reduction WOWA score of the Ogeechee-Savannah
watershed (highlighted by the black arrow) compared to SAD

24
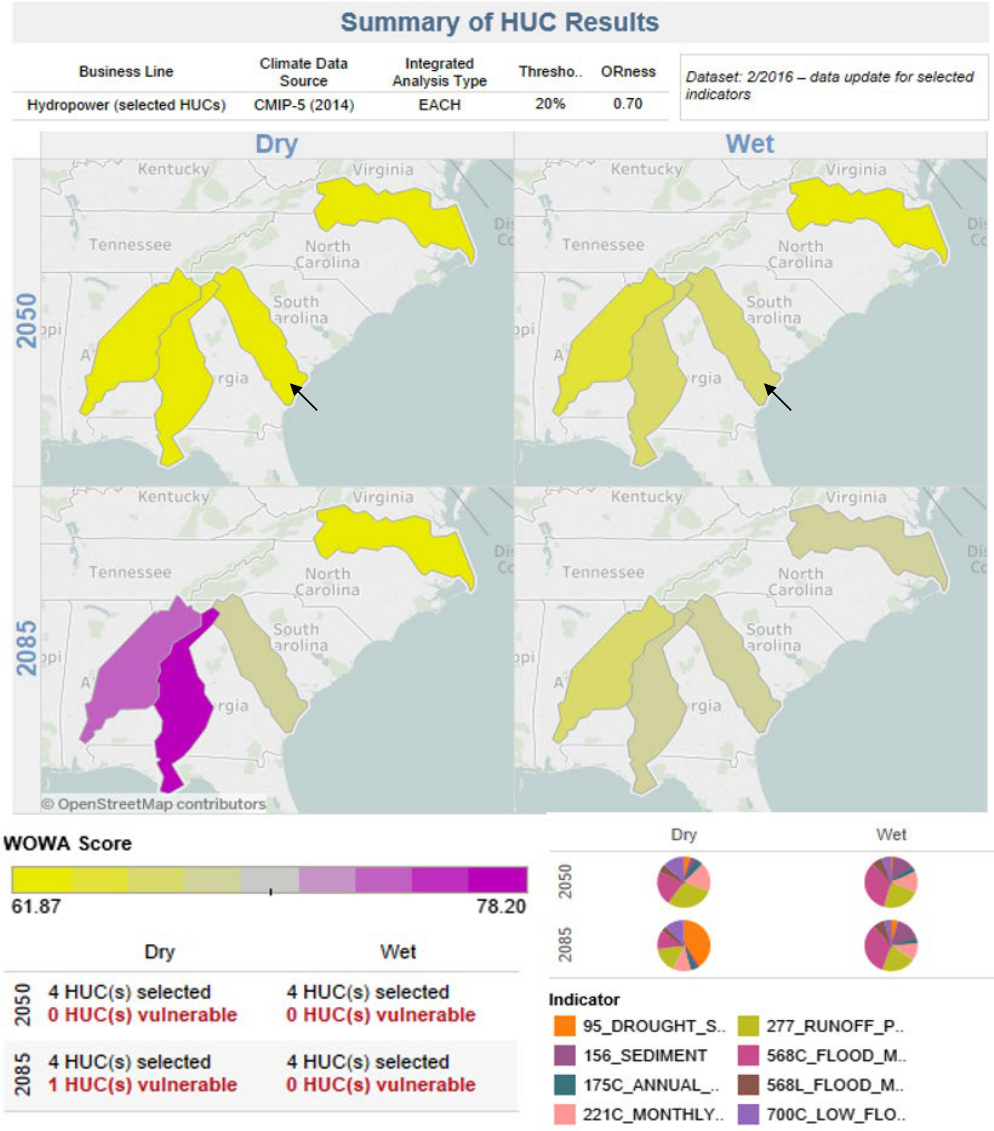
Relative to the other HUC 04 watersheds in SAD, the Ogeechee-Savannah watershed is
relatively less vulnerable to the impacts of climate change on Hydropower for both the wet and
dry subsets of traces (Figure 15). For Ogeechee-Savannah watershed, the major drivers of the
computed Hydropower vulnerability score are, local and cumulative “Flood Magnification”, and
the “Drought Severity” (Table 6).
Table 6: Indicators associated with Flood Risk Reduction and their contribution to the WOWA scores.
Hydropower
Dry Scenario
Indicator #
2050 Value
2050 % Score
2085 Value
2085 % Score
% Change
156_SEDIMENT
2.204
3.54
1.336
1.94
-39.4
175C ANNUAL COVERAGE
4.323
6.93
2.852
4.13
-34.03
221C MONTHLY COVERAGE
10.028
16.08
6.926
10.04
-30.94
277_PRECIP RUNOFF
20.03
32.12
13.90
20.15
-30.59
568C_FLOOD MAGNIFICATION
13.76
22.07
9.42
13.65
-31.57
568L_FLOOD MAGNIFICATION
3.054
4.90
2.090
3.03
-31.57
700C_LOW FLOW REDUCTION
7.38
11.84
5.14
7.45
-30.43
95_DROUGHT SEVERITY
1.57
2.51
27.32
39.61
1643.52
Wet Scenario
Indicator #
2050 Value
2050 % Score
2085 Value
2085 % Score
% Change
156_SEDIMENT
10.07
15.33
10.98
16.21
9.04
175C ANNUAL COVERAGE
2.29
3.49
2.34
3.45
1.96
221C MONTHLY COVERAGE
7.31
11.12
7.23
10.68
-1.03
277_PRECIP RUNOFF
15.69
23.89
15.27
22.55
-2.67
568C FLOOD MAGNIFICATION
21.62
32.92
22.33
32.97
3.26
568L FLOOD MAGNIFICATION
4.80
7.31
4.96
7.32
3.26
700C_LOW FLOW REDUCTION
3.38
5.14
3.20
4.73
-5.10
95_DROUGHT SEVERITY
0.52
0.80
1.41
2.09
AA169.93
25
Hydropower
Figure 15: Results of the USACE climate vulnerability analysis for the Hydropower WOWA score of the Ogeechee-Savannah
watershed (highlighted by the black arrow) compared to SAD
26
1.4 Summary and Conclusions
Based on the results of the USACE Vulnerability Assessment Tool, relative to the other 201
HUC04 watersheds in the continental United States, the Ogeechee-Savannah watershed isn’t
highly vulnerable (top 20% of CONUS watersheds) to the impacts of climate change on any of
the four business lines evaluated (Recreation, Water Supply, Flood Risk Reduction, or
Hydropower). The results of the vulnerability assessment do not imply that the Ogeechee-
Savannah watershed will not be impacted by climate change, but rather that climate change
will have comparatively less of an impact in the Ogeechee-Savannah watershed relative to its
impact on other HUC04 watersheds in the U.S. Climate change could affect the operating
objectives of the recommended alternative both negatively and positively. How climate change
will impact the reservoirs is complex. None of the evaluated project alternatives would be
impacted positively or negatively more so, than another by climate change effects.
A review of climate change literature specific to the region suggests a strong trend towards
warmer climate and a less pronounced trend towards more extreme precipitation in the future.
Temperature trends within the state of Georgia are consistent with trends observed throughout
the region. The state of Georgia is likely to experience more extremes in the future in terms of
both increased precipitation and droughts.
Projected climate changed hydrology for the Savanah Basin indicates that streamflow could
potentially increase in the future. Two annual instantaneous peak streamflow gages,
representative of both regulated and unregulated watershed conditions, were evaluated for
site specific trends and nonstationarities. The regulated gage showed two instances of
nonstationarity: one in 1950 and one in 1998. The 1950 nonstationarity is attributed to the
construction of J. Strom Thurmond Dam. Compared to the period of record prior to 1950,
the flow record post-construction of the dam has a significantly lower mean and less
variability.
The nonstationarity detected in 1950 is only flagged within the regulated record.
Both the regulated and unregulated records contain a nonstationarity detected in 1998. The
1998 nonstationarity coincides with the onset of a severe, prolonged drought in the Savannah
River Basin. The mean annual instantaneous peak streamflow decreased when the periods of
record prior to and post 1998 are compared. If the dataset is separated into statistically
homogenous subsets of flow data prior to the J. Strom Thurmond Dam, and post the 1998
nonstationarity, there is not an overall, statistically significant, monotonic trend in the annual
instantaneous peak streamflow record for the Savannah River at Augusta. An assessment was
carried out to see if trends are apparent within water temperature records in the study area, but
no trend was found
It is unlikely that changes in flow rates and variability over time will be operationally significant
due to the large impact the three reservoirs have on flow rates in the project area. The
Tentatively Selected Plan (TSP) for the IWSSRR/EA is Alternative 2; Alternative 2 addresses
reallocation of storage from the Hartwell Lake conservation pool for water supply. Because the
Corps reservoir projects are operated based on the Reservoir Regulation Manual and the
2012 Drought Contingency Plan, the prescribed minimum flows downstream of JST Dam will
continue to be met. With the additional water supply withdrawals from the Conservation Pool,
that pool would be slightly lower during a drought than with the No Action Alternative. Average
27
pool levels at Hartwell and Thurmond are projected 0.06 feet lower and 0.01 feet lower at
Russell with the new water supply withdrawals than without. Because the Corps reservoir
projects are operated based on the Reservoir Regulation Manual and the 2012 Drought
Contingency Plan, the prescribed minimum flows downstream of JST Dam will continue to be
met.
The USACE developed the Savannah River Basin Drought Management Plan (DMP) in 2012.
This addressed the effects of the District’s water control management activities on the
impoundments it manages and the downstream portion of the river. This document assisted
the States of Georgia and South Carolina in their drought contingency planning and water
management responsibilities for the Savannah River Basin. USACE uses elevation based
triggers to respond to different levels of drought severity. All alternatives considered would be
impacted by climate change in a similar manner. In order for the project to adversely
compound the impacts of climate change on the study area, significant increases or decreases
in precipitation would have to occur- beyond what could be managed by these upstream
projects. Based on the literature review, first order statistical analysis and the vulnerability
assessment it is unlikely that changes of this magnitude will occur within the next 100 years.
For this reason, resilience measures for climate change are not suggested to be included in
the recommended alternative, Alternative 2, during the planning phase.
28
1.5 Citations
Binita, KC, J.M. Sheperd, C.J. Gaither, (2015). Climate change vulnerability assessment in
Georgia. Applied Geography, 62, 62-74.
Carter, L. M., J. W. Jones, L. Berry, V. Burkett, J. F. Murley, J. Obeysekera, P. J. Schramm,
and D. Wear, 2014: Ch. 17: Southeast and the Caribbean. Climate Change Impacts in the
United States: The Third National Climate Assessment, J. M. Melillo, Terese (T.C.) Richmond,
and G. W. Yohe, Eds., U.S. Global Change Research Program, 396-417. doi:10.7930/J0N-
P22CB.
Frankson, R., K. Kunkel, L. Stevens, B. Stewart, W. Sweet, and B. Murphey, 2017: Georgia
State Climate Summary. NOAA Technical Report NESDIS 149-GA, 4 pp.
Friedman, D., J. Schechter, Sant-Miller, A.M., C. Mueller, G. Villarini, K.D. White, and B.
Baker. (2018), US Army Corps of Engineers Nonstationarity Detection Tool User Guide. US
Army Corps of Engineers: Washington, DC.
Hay, L. E., Markstrom, S. L., & Ward-Garrison, C. (2011). Watershed-scale response to
climate change through the twenty-first century for selected basins across the United States.
Earth Interactions, 15(17), 1-37.
Ingram, K. T., Dow, K., Carter, L., Anderson, J., & Sommer, E. K. (Eds.). (2013). Climate of the
Southeast United States: Variability, Change, Impacts, and Vulnerability (pp. 1-342).
Washington, DC, USA: Island Press.
Karl, T. R., Melillo, J. M., Peterson, T. C., & Hassol, S. J. (Eds.). (2009). Global climate change
impacts in the United States. Cambridge University Press.

29
Kunkel, K. E., Karl, T. R., Easterling, D. R., Redmond, K., Young, J., Yin, X., & Hennon, P.
(2013). Probable maximum precipitation and climate change. Geophysical Research Letters,
40(7), 1402-1408.
McLeod A.I. (2011). Kendall: Kendall rank correlation and Mann-Kendall trend test. R package
version 2.2. https://CRAN.R-project.org/package=Kendall
McRoberts, D. B., & Nielsen-Gammon, J. W. (2011). A new homogenized United States
climate division precipitation data for analysis of climate variability and change. J. Appl.
Meteor, 1151(50), 1187-1199.
R Core Team (2018). R: A language and environment for statistical computing. R Foundation
for Statistical Computing, Vienna, Austria. URL https://www.R-project.org/.
USACE (2015). Recent US Climate Change and Hydrology Literature Applicable to US Army
Corps of Engineers Missions – South Atlantic-Gulf Region 03. Civil Works Technical Report,
CWTS 2015-03, USACE, Washington, DC
USACE (2016). Climate Hydrology Assessment Tool – PROD. USACE,
http://corpsmapu.usace.army.mil/cm_apex/f?p=313:2:0::NO Accessed December,
2018.USACE (2016).
USACE (2016). US Army Corps of Engineers Nonstationarity Detection Tool. USACE Climate
Preparedness and Resilience. http://corpsmapu.usace.army.mil/cm_apex/f?p=257:2:0::NO.
Accessed December, 2018.
USACE (2017). Guidance for Detection of Nonstationarities in Annual Maximum Discharges.
Technical Letter No. 1100-2-3
USACE (2018). USACE Screening-Level Climate Change Vulnerability Assessment (VA).
USACE, https://maps.crrel.usace.army.mil/apex/f?p=201:2:5978400392056::NO::: Accessed
December, 2018.
USACE ECB (2018). Guidance for Incorporating Climate Change Impacts to Inland Hydrology in Civil
Works Studies, Designs, and Projects,
Engineering and Construction Bulletin, No. 2018-14.
Surface-Water Annual Statistics for Georgia, National Water Information System: Web
Interface. Accessed 06 December, 2018. https://nwis.waterdata.usgs.gov/ga/nwis/annual/
Walsh, J., D. Wuebbles, K. Hayhoe, J. Kossin, K. Kunkel, G. Stephens, P. Thorne, R. Vose, M.
Wehner, J. Willis, D. Anderson, S. Doney, R. Feely, P. Hennon, V. Kharin, T. Knutson, F.
Landerer, T. Lenton, J. Kennedy, and R. Somerville, 2014: Ch. 2: Our Changing Climate.
Climate Change Impacts in the United States: The Third National Climate Assessment, J. M.
Melillo, Terese (T.C.) Richmond, and G. W. Yohe, Eds., U.S. Global Change Research
Program, 19-67. doi:10.7930/J0KW5CXT.
Zhang, F., & Georgakakos, A. P. (2011). Climate and hydrologic change assessment for
Georgia. Georgia Institute of Technology.
