
International Journal of Science and Research (IJSR)
ISSN (Online): 2319-7064
Index Copernicus Value (2015): 78.96 | Impact Factor (2015): 6.391
Volume 6 Issue 3, March 2017
www.ijsr.net
Licensed Under Creative Commons Attribution CC BY
Skeletal Maturity Indicators - Review Article
Dr. Swapnil J. Korde
1
, Dr. Pallavi Daigavane
2
, Dr. Sunita Shrivastav
3
1
PG, Student Department of Orthodontics, Sharad Pawar Dental College Sawangi (Meghe) Wardha
2
Reader, Department of Orthodontics, Sharad Pawar Dental College Sawangi (Meghe) Wardha
3
Professor and Head, Department of Orthodontics, Sharad Pawar Dental College Sawangi (Meghe) Wardha
Abstract: Growth biologically and histologically is a composite of morphogenetic and histogenetic changes occurring continuously
over a period in response to genetic coding and environmental influence. It is one of the most myriad variations and plays an important
role in the etiology of malocclusion and also in the evaluation of diagnosis, treatment planning retention and stability of any case. In
this review, various methods currently used as skeletal maturity indicators have been discussed.
Keywords: Cervical vertebrae maturation indicators, hand and wrist radiographs, middle phalanx of third finger, skeletal maturity
indicators, canine calcification
1. Introduction
Every individual matures according to his or her own
biological clock. Different authors had reported different
methods in an attempt to determine the best indicator of
maturity. These include height
1,2,3
weight
4
chronological
age;
4,5,6
sexual maturation
5
frontal sinus
7
biological age or
physiological age; hand-wrist maturity;
2,08,09,10,11-13
cervical
vertebrae
14,15,16,17
dental eruption; dental calcification
stages
18,19,20,21
and recently introduced biomarkers.
22-29
An understanding of growth events is of primary importance
in the practice of clinical orthodontics. Maturational status
can have considerable influence on diagnosis, treatment
goals, treatment planning, and the eventual outcome of
orthodontic treatment. Clinical decisions regarding the use
of extra oral traction forces, functional appliances, extraction
versus nonextraction treatment, or orthognathic surgeries
are, at least partially, based on growth considerations.
Prediction of both the times and the amount of active
growth, especially in the craniofacial complex, would be
useful to the orthodontist.
30
Growth modulation procedures,
which bring about changes in the skeletal base such as the
use of extra oral orthopedic forces or functional appliances,
are suggested to be initiated during active growth periods.
These active growth periods have to be objectively assessed
for both the timing and the amount of active growth vector
or direction of growth. Maturational status of an individual
can be best evaluated relative to different stages of
physiologic maturity rather than evaluating it with
chronologic age because the latter is not a reliable indicator.
Physiologic maturity is best- estimated by the maturation of
one or more tissue systems, such as somatic, sexual, skeletal,
and dental maturity. Amongst the given indicators,
chronological age is considered to be an easy parameter to
assess expected amount of growth and development.
Chronological age
Birth date by calendar determines chronological age. Wide
individual variation lies in timing of pubertal growth spurt
with respect to chronological age. Therefore, thus,
chronological age cannot be considered as a reliable
indicator for the evaluation of maturity status of a
child.
02,31,32
This has led to the concept of Biological age or
physiological age.
Biological age or physiological age
The physiological age of a person is determined by the
degree of maturation of the different tissue systems.
18
Physiological age can be estimated by maturational status of
somatic, sexual, skeletal, and dental system.
Somatic maturity
An annual growth increment in height or weight determines
the somatic maturity.
02
Measurement of height represents
general growth of the skeleton. Average age of onset of
stature growth for females and males of approximately 10
and 12 years, respectively, with the peak coming later in
both sexes.
05
Height, therefore, might represent a skeletal
measure that can be used to predict the timing of the facial
growth spurt and needs further exploration.
Sexual maturation
Sexual maturation involves using secondary sex
characteristics to predict the individual maturational status.
Tanner had given separate sexual maturity ratings for boys
and girls which consists of five stages of sexual maturity
with stage 1 being the least mature (preadolescent) and stage
5 being the most mature (adult). In boys, Tanner Sexual
Maturity Ratings assesses pubic hair (amount, coarseness,
color and location), penile length and breadth, scrotal
development and testicular size. In girls, tanner sexual
maturation rating assesses breast development (size and
morphology) and pubic hair (location, color, morphology,
quantity). Prediction of sexual maturity requires a physical
examination, and hence use of sexual maturity as maturation
marker is limited in the orthodontic set up. Serial recording
of voice change in boys can be used as a measurement of
maturity but as mentioned above it requires a serial
recording, not practical in orthodontic clinics.
05
Menarche is
an important predictor of maturation in females.
09
Once
menstruation begins, the growth spurt is usually near
completion
Skeletal maturation
Certain bones in the body demonstrate an organized event of
ossification. Degree of ossification in these bones
Paper ID: ART20163727
361

International Journal of Science and Research (IJSR)
ISSN (Online): 2319-7064
Index Copernicus Value (2015): 78.96 | Impact Factor (2015): 6.391
Volume 6 Issue 3, March 2017
www.ijsr.net
Licensed Under Creative Commons Attribution CC BY
determines skeletal maturation. These changes can be seen
radiologically. The hand, foot, knee, elbow, shoulder, and
hip, cervical vertebrae can be used to assess skeletal age of
an individual. Skeletal maturity assessment involves visual
inspection of the developing bone and their initial
appearance, sequential ossification, and related changes in
shape and size. Thus, the skeletal maturity indicators provide
an objective diagnostic evaluation of stage of maturity in an
individual.
2. Pubertal/Adolescent Growth Spurt
The timing of recognition of the last and important growth
spurt that is, the pubertal growth spurt is important in
percept of orthodontics. It is during this growth phase, the
somatic growth rate is at its maximum. Every growth spurt
has definite onset, accelerating phase, peak of the growth
spurt, decelerating phase, end of the growth spurt. The
duration of this growth spurt is short in females around 3-4
years compared to males in which it extends 4-5 years. The
girls have an earlier onset of puberty whereas in the boys,
late onset is seen. The accelerating phase may last for 2
years on average. After 3 4 years of the end of this growth
spurt, the active growth ceases.
33-36
3. Assessment of Timing of Adolescent Growth
Spurt
The timing of the growth spurt can be assessed by
chronological age, skeletal age, physiologic age, and dental
age. The chronological age is not reliable as variability is the
rule of growth pattern. In most of the conditions, skeletal age
is assessed to pinpoint identify the different phases of the
growth spurt. A number of methods are available to assess
the skeletal maturity of an individual in orthodontic practice
which are broadly classified as follows:
A. Radiological
1. Special radiographs:
Use of hand-wrist radiographs: This is the most common
method and widely accepted method.
16,37,38-40
2. Lateral cephalograms:
Use of cervical vertebrae on a lateral cephalogram.
14,16
Use of frontal sinus using lateral cephalogram.
41
3. Orthopantomogram (OPG)/intraoral periapical:
Use of different stages of tooth development
14,18,19,42-44
B. Biochemical
Recent biochemical method in saliva and serum are the
23,45-
53
A. Insulin-like growth factor (IGF) growth hormone (GH),
B. Creatinine,
C. Alkaline phosphatase (ALP).
The review of the literature shows a vast ore on this topic.
These studies or reviews are related to methods of
assessment, correlation between different methods,
correlation between skeletal age and dental age and
chronological, etc.
Radiological
Hand wrist radiographs
The hand wrist radiograph is considered to be the most
standardized method of skeletal assessment. Assessment of
skeletal maturation using hand wrist radiograph as an index
based upon time and sequence of appearance of carpal bones
and certain ossification events has been reported by many
investigators. A number of methods have been described to
assess the skeletal maturity using hand-wrist
radiographs.
37,16,38-40
The following are the most commonly
used methods:
A. Atlas Method by Greulich and Pyle.
B. Biork, Grave and Brown Method modified by Schopf in
1978.
C. Fishman‟s skeletal maturity indicators.
D. Hägg and Taranger Method.
E. Singers Method.
Amongst all, Atlas Method by Greulich and Pyle is a
comparative method whereas all the other methods are
individualized methods. All of these methods rely on the
stage of the development of the epiphysis over the diaphysis.
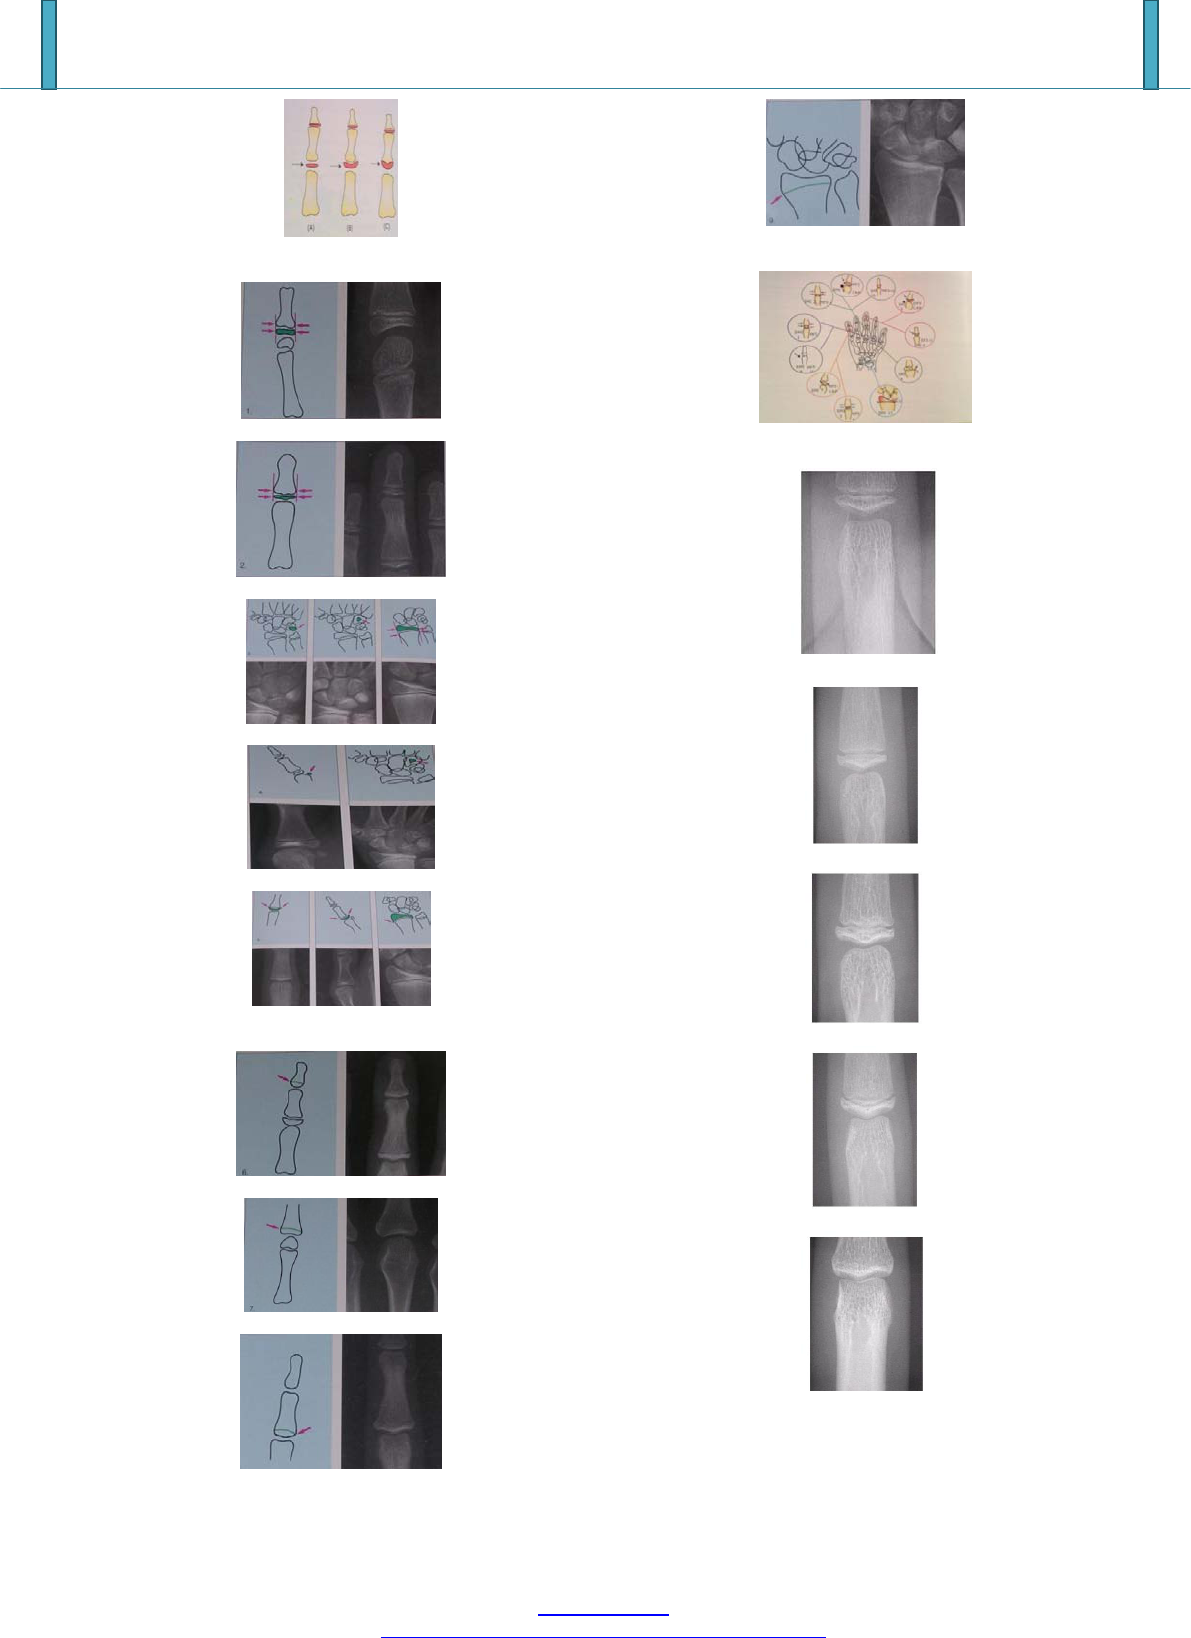
Usually, all the methods depend on the assessment of the
following stages in ossification of phalanges:
Stage 1: The epiphysis and diaphysis are equal (Sign
convention „=‟).
Stage 2: The epiphysis caps the diaphysis by surrounding it
like a cap (cap).
Stage 3: Fusion occurs between the epiphysis and diaphysis
(U-Union).
Greulich and Pyle Method [1959]
55
:
Greulich and Pyle published an atlas containing the pictures
of standard hand wrist radiographs.In that they had given
ideal pictures of hand wrist radiograph for different
chronological age, and for each sex.Each photograph in atlas
representative of particular skeletal age.Patient radiograph is
matched with photographs in atlas.It involves comparing a
hand wrist film with standard of same sex and nearest
chronological age.The film then compared with adjacent
standards.Both older and younger than the one which is of
the nearest chronological age. Close one are chosen.
Bjork Grave and Brown [1976]
55
They divide maturation process of bone of hand between
ages 9 to 17 years into 9 stages,
Each stage represent level of skeletal maturity.
Total 14 ossification points were used
Development stage assessed according to relation between
epiphyses and diaphysis.
Stages-
First stage: ( Males 10.6 y , Females 8.1 y ) (Fig 2)
PP2- stageThe epiphysis and diaphysis are equal .Occurs
approximately 3 yrs before the peak of pubertal growth
spurts
Second stage:( Males 12 y , Females 8.1 y ) (Fig 3)
MP3 –stageThe epiphysis and diaphysis are equal.Just
before beginning of pubertal growth spurts
Third stage: ( Males 12.6 y , Females 9.6 y ) (Fig 4)
Pisi- stage = visible ossification of the pisiforme
Paper ID: ART20163727
362

International Journal of Science and Research (IJSR)
ISSN (Online): 2319-7064
Index Copernicus Value (2015): 78.96 | Impact Factor (2015): 6.391
Volume 6 Issue 3, March 2017
www.ijsr.net
Licensed Under Creative Commons Attribution CC BY
H1- stage = ossification of the hamular process of the
hamatum
R- stage = The epiphysis and diaphysis are equal.
Stageoccure 6 month b4
Fourth stage: ( Males 13 y , Females 10.6 y ) (Fig 5)
S = First mineralization of the ulnar sesamoid bone
H2- Progressive ossification of the hamular process of the
hamatum marks the beginning of growth spurt
Fifth stage: ( Males 14 y , Females 11 y )MP3 CAP (Fig 6)
The diaphysis is covered by cap shaped epiphysisThis stage
marks the peak of pubertal growth spurt
Sixth stage: ( Males 15 y , Females13 y ) (Fig 7)
DP3u : Visible union of epiphysis and diaphysis. Indicates
the end of pubertal growth spurt
Seventh stage: ( Males 15.9 y , Females13.3 y ) (Fig 8)
PP3u : Visible union of epiphysis and diaphysis.Occurs One
year after growth spurt. Little growth potential is remaining
Eighth stage:( Males 15.9 y , Females13.9 y ) (Fig 9)
MP3u : Visible union of epiphysis and diaphysis
Ninth stage: ( Males 18.5 y , Females 16y ) (Fig 10)
R u : Visible union of epiphysis and diaphysis of radius. End
of Active growth
FISHMAN SKELETAL MATURITY INDICATOR
[1982]
55
He made use of anatomical site on thumb, third finger, fifth
finger, and radius.The system uses 11 anatomical sites, all of
which exhibit consistency in time of onset of ossification
covering entire period of adolescent growth period.
Stages (Fig 11)
S.M.I. 1 PP3=
Third finger shows equal width of epiphysis with diaphysis
S.M.I.2 MP3=
Width of epiphysis equal to that of diaphysis in middle
phalanx of third finger
Appears during onset of prepubertal growth velocity
S.M.I.3 MP5=
Width of epiphysis equal to that of diaphysis in middle
phalanx of fifth finger
S.M.I. 4 S
Appearance of adductor sesamoid of thumb.Become visible
during period of very rapid growth velocity
S.M.I.5 DP3cap
Capping of epiphysis over diaphysis is seen in distal phalanx
of third finger.Peak height velocity
S.M.I. 6 MP3cap
Capping of epiphysis over diaphysis is seen in middle
phalanx of third finger.Become visible during period of very
rapid growth
Stage 7 MP5cap
Capping of epiphysis over diaphysis is seen in middle
phalanx of fifth finger.Peak height velocity
Stage 8 DP3U
Fusion of epiphysis over the diaphysis is seen in distal
phalanx of third finger.Time interval of decelerating growth
rate
Stage 9 PP3
Fusion of epiphysis over the diaphysis is seen in distal
phalanx of third finger
Stage 10 MP3u
Fusion of epiphysis and diaphysis is seen in middle phalanx
of third finger.Time interval of decelerating growth rate
Stage 11 R U
Fusion of epiphysis and diaphysis is seen in radius.Growth
completed
Hagg and Taranger Method
42
In 1982 they carried out longitudinal study on 212 Swedish
children. Skeletal development from hand wrist radiographs
is analyzed by taking annual radiographs between age of 6
and 18 years. The assessment is done for Ulnar Sesamoid of
metacarpophylangeal (S) joint of first finger and certain
specified stages of the three epiphyseal bones: middle
phalanges and distal phalanges of third finger (MP3 and
DP3) and distal epiphysis of radius (R).HAGG and
TARANGER 1982 made following findings concerning the
relationship in time between the various pubertal events:-
Girls: if menarche has occurred PHV has been attain and
growth rate is decelerating. If menarche has not occurred
growth rate may be decreasing but has not yet reached the
level of the end of pubertal growth spurts
Boys:-if a boy has prepubertal voice most probably the
PHV has not yet been reached
If the voice change has begun the boys is in pubertal
growth spurts
If the boy has a male voice the growth rate has begun to
decelerate.
No boy will reach the end of pubertal spurt without having
male voice.
Middle phalanx-
MP3-F: (Fig 12)
The epiphysis is as wide as metaphysis.
Stage attained before onset of PHV
Stage indicate more than 80%of pubertal growth remaining.
MP3-FG: (Fig.13)
The epiphysis is as wide as metaphysis
Distinct medial and /or lateral border of epiphysis forming a
line of demarcation at right angle to distal border
Stage indicates the accelerating slop of pubertal growth spurt
MP3-G: (Fig.14)
Sides of epiphysis thickened and cap its metaphysis forming
sharp edge at one or both sides
Stage is attaining at about peak height of pubertal growth
spurts.
MP3-H: (Fig 15)
Stage is characterized by beginning of fusion epiphysis and
metaphysis. This stage indicated by decelerating slope of
PHV but before end of growth spurt.
MP3-I(Fig. 16)
This stage is characterized by completion of fusion of
epiphysis and metaphysis.This is attained at end of growth
spurt,
Third finger distal phalanx
DP3-I (Fig. 17)
Fusion of epiphysis and metaphysis completed. Indicates the
decelerating period of pubertal growth spurts. Means end of
peak height velocity.
Paper ID: ART20163727
363

International Journal of Science and Research (IJSR)
ISSN (Online): 2319-7064
Index Copernicus Value (2015): 78.96 | Impact Factor (2015): 6.391
Volume 6 Issue 3, March 2017
www.ijsr.net
Licensed Under Creative Commons Attribution CC BY
Distal Epiphysis of Radius (R)
R-I:
Fusion of epiphysis and metaphysis on radius has begun.
Stage R-i is attained one year before or at end of pubertal
growth spurt.
R-IJ:
Fusion almost completed
R-J: complete fusion of epiphysis and metaphysis
R-IJ, R-J:( Fig. 18) are not attained before the end of
pubertal growth spurts
Rajgopal and Kansal in 2005
54
modified the stages of MP3
MP3-F stage: (Fig. 19)Start of the curve of pubertal growth
spurt.
Epiphysis is as wide as metaphysis.
Ends of epiphysis are tapered and rounded.
Metaphysis shows no undulation.
Radiolucent gap (representing cartilageous epiphyseal
growth plate) between epiphysis and metaphysis is wide.
MP3-FG stage: (Fig 20)Acceleration of the curve of
pubertal growth spurt.
Epiphysis is as wide as metaphysis.
Distinct medial and/or lateral border of epiphysis forms line
of demarcation at right angle to distal border.
Metaphysis begins to show slight undulation.
Radiolucent gap
MP3-G stage: (Fig. 21)Maximum point of pubertal growth
spurt.
Sides of epiphysis have thickened and cap its metaphysis,
forming sharp distal edge on one or both sides.
Marked undulations in metaphysis give it “Cupid‟s bow”
appearance.
Radiolucent gap between epiphysis and metaphysis is
moderate.
MP3-H stage: (Fig. 22)Deceleration of the curve of pubertal
growth spurt.
Fusion of epiphysis and metaphysis begins.
One or both sides of epiphysis form obtuse angle to distal
border.
Epiphysis is beginning to narrow.
Slight convexity is seen under central part of metaphysis.
Typical “Cupid‟s bow” appearance of metaphysis is absent,
but slight undulation is distinctly present.
Radiolucent gap between epiphysis and metaphysis is
narrower.
MP3-HI stage: (Fig. 23)Maturation of the curve of pubertal
growth spurt.
Superior surface of epiphysis shows smooth concavity.
Metaphysis shows smooth, convex surface, almost fitting
into reciprocal concavity of epiphysis.
No undulation is present in metaphysis.
Radiolucent gap between epiphysis and metaphysis is
insignificant.
MP3 I Stage(Fig.24)
End of pubertal growth spurt
1. Fusion of epiphysis and metaphysis complete.
2. No radiolucent gap exists between metaphysis and
epiphysis.
3. Dense, radiopaque epiphyseal line forms integral part of
proximal portion of middle phalanx.
Singers Methode [1980]
55
Julian Singer in 1980 proposed system of hand wrist
radiographic assessment. It helps the clinician to rapidly
determine maturational status of adolescent patient. This
system has six stages.
Stage
Characteristic feature
Relation of epiphysis and diaphysis
Inference
Stage 1 (early)
1.Absence of pisiform 2.absence of hook of
hamate
Epiphysis of proximal phalanx of
second finger being narrower than
its diaphysis
1year before beginning of peak
pubertal growth
Stage 2
(prepubertal)
1.Initial ossification of hook of hamate
2.Initial ossification of pisiform
PP2=
Just beginning of pubertal
growth spurt.
Mandibular growth potential is
possible
Stage 3
(pubertal onset)
1.Begining of calcification of ulnar sesamoid
2.Increased calcification of hook of hamate and
pisiform
Increased width of epiphysis of
proximal phalanx of second finger
Onset of pubertal growth spurt.
Stage 4
(pubertal)
calcified ulnar sesamoid
MP3 cap
Accelerating phase of pubertal
growth spurt
Stage 5
(pubertal
deceleration)
Fully calcified ulnar sesamoid
1.DP3-U
2.Radius and ulna not fully fused
with respect to shaft
This stage represent that period
of growth when orthodontic
treatment might be completed
and patient is on retention
therapy
Stage 6
No remaining growth sites
R-U
Growth completed
4. Lateral Cephalograms
Skeletal Maturation Evaluation Using Cervical Vertebrae
Cervical Vertebrae maturational indicator(CVMI) given by
Lamparski
15
in 1965.
The primary objective of the author was to create a method
of evaluating the skeletal maturation of the orthodontic
patient with the cephalometric radiograph that is routinely
taken with pretreatment records. Correlations were made
between cervical vertebrae maturation and the skeletal
maturation of the hand-Wrist.
Paper ID: ART20163727
364

International Journal of Science and Research (IJSR)
ISSN (Online): 2319-7064
Index Copernicus Value (2015): 78.96 | Impact Factor (2015): 6.391
Volume 6 Issue 3, March 2017
www.ijsr.net
Licensed Under Creative Commons Attribution CC BY
Lamparski studied changes in size and shape of cervical
vertebrae to create maturational standards for the cervical
vertebrae. Six categories of cervical vertebrae skeletal
maturation could be defined, and the following observations
were made for each category.
5. Stages of Cervical Vertebrae Maturation
Indicator
Stage 1 / Category 1
All inferior borders of the bodies of C2, C3 and C4 are
flat.
The Superior borders are strongly tapered posterior to
anterior region.
Very significant amount of adolescent growth expected.
Stage 2 / Category 2
A concavity has developed in the inferior borders of C2
and C3.
The anterior vertical height of the bodies has increased.
C3 and C4 are more rectangular in shape.
Significant amount of adolescent growth expected.
Stage 3 / Category 3
Distinct concavities have developed in the inferior border
of the C2 and C3.
C4 starts developing concavity in lower border of body.
Moderate amount of growth expected.
Stage 4/Category 4
C3 and C4 are nearly square in shape.
Distinct concavities in lower borders of C2, C3 and C4.
Small amount of growth expected.
Stage 5 / Category 5
C3 and C4 are square in shape.
Accentuated concavities are formed in C2, C3 and C4
Insignificant amount of growth expected.
Stage 6 / Category 6
C3 and C4 are increased in Vertical height and are higher
than they are wide.
All concavities have deepened.
Adolescent growth is completed.
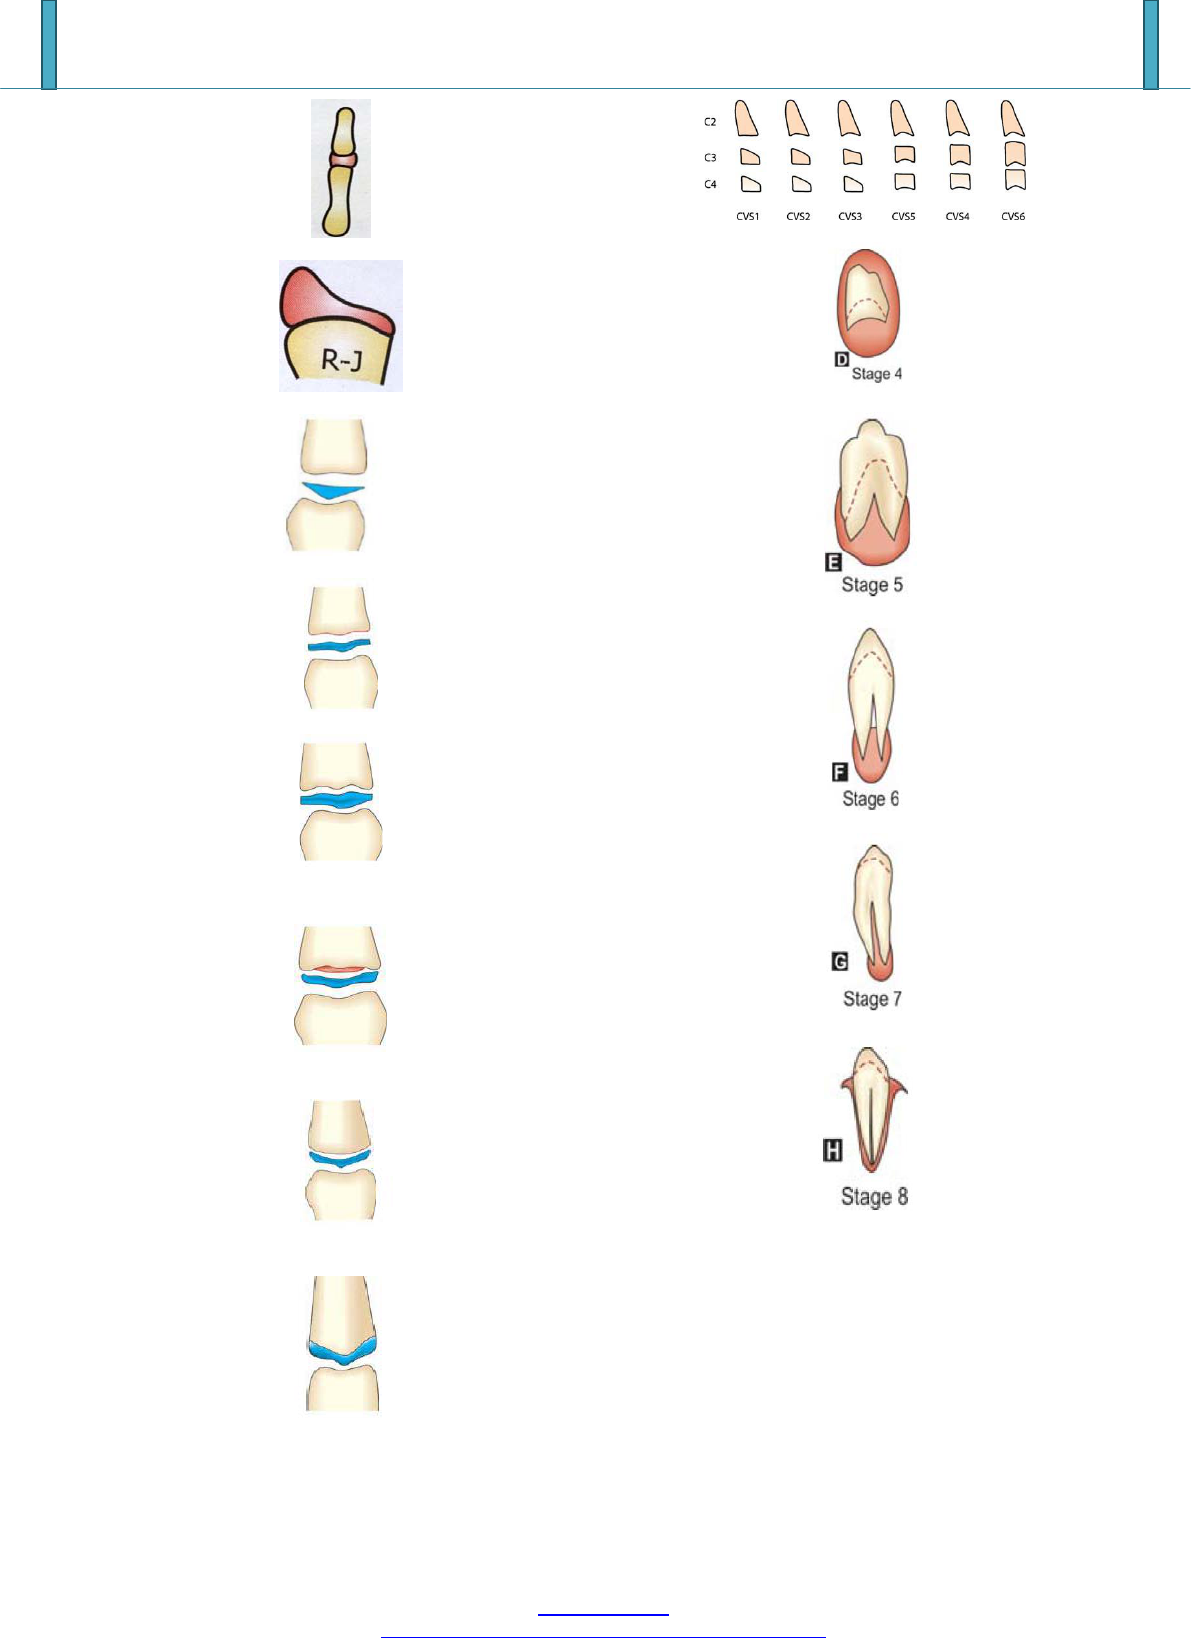
Later, Hassel and Farman in 1995
16
used the cervical
vertebrae and developed a system of skeletal maturation
determination. Later, this was modified by Baccettiet al.
2005
28
. The shapes of the cervical vertebrae were seen to
differ to teach level of skeletal development. This
provided a means to determine the skeletal maturity of a
person and thereby determine whether the possibility of
potential growth existed. The shapes of the vertebral
bodies of C3 and C4 changes from wedge shape to
rectangle followed by square shape. In addition, they
became taller as skeletal maturity progressed. The inferior
vertebral borders were flat when immature and became
concave with maturity. The curvatures of the inferior
vertebral borders seem to appear sequentially from C2 to
C3 to C4 as the skeleton matures. The concavities become
more distinct as the person matures.
14,16
Hassel and Farman in 1995
16
found the correlation
between skeletal maturity indicators seen in hand wrist
radiograph and cervical maturity indicators in lateral
cephalogram.
Category 1 was called INITIATION. This corresponded to
a combination of SMI 1 and 2. At this stage, adolescent
growth was just beginning and 80% to 100% of adolescent
growth was expected. Inferior borders of C2, C3, and C4
were flat at this stage. The vertebrae were wedge shaped,
and the superior vertebral borders were tapered from
posterior to anterior.
Category 2 was called ACCELERATION.This
corresponded to a combination of SMI 3 and 4. Growth
acceleration was beginning at this stage, with 65% to 85% of
adolescent growth expected. Concavities were developing
in the inferior borders of C2 and C3. The inferior border of
C4 was flat. The bodies of C3 and C4 were nearly
rectangular in shape.
Category 3 was called TRANSITION.This corresponded to
a combination of SMI 5 and 6. Adolescent growth was still
accelerating at this stage toward peak height velocity, with
25% to 65% of adolescent growth expected
10
Distinct
concavities were seen in the inferior borders of C2 and C3.
A concavity was beginning to develop in the inferior border
of C4. The bodies of C3 and C4 were rectangular in shape.
Category 4 was called DECELERATION.This
corresponded to a combination of SMI 7 and 8. Adolescent
growth began to decelerate dramatically at this stage, with
10% to 25% of adolescent growth expected. Distinct
concavities were seen in the inferior borders of C2, C3, and
C4. The vertebral bodies of C3 and C4 were becoming
squarer in shape.
Category 5 was called MATURATION.This corresponded
to a combination of SMI 9 and 10. Final maturation of the
vertebrae took place during this stage, with 5% to 10% of
adolescent growth expected. More accentuated concavities
were seen in the inferior borders of C2, C3, and C4. The
bodies of C3 and C4 were nearly square to square in shape.
Category 6 was called COMPLETION.This corresponded
to SMI 11. Growth was considered to be complete at this
stage. Little or no adolescent growth was expected. Deep
concavities were seen in the inferior borders of C2, C3, and
C4. The bodies of C3 and C4 were square or were greater in
vertical dimension than in horizontal dimension. Bacetti et al
in 2005
28
modified the stages given by Hassel and
Farman
16
(Fig. 25)
Cervical stage 1- The lower borders of all the three
vertebrae (C2-C4) are flat. The bodies of both C3 and C4 are
trapezoid in shape (the superior border of the vertebral body
is tapered from posterior to anterior). The peak in
mandibular growth will occur on average 2 years after this
stage.
Cervical stage 2- A concavity is present at the lower border
of C2 (in four of five cases, with the remaining subjects still
showing a cervical stage 1). The bodies of both C3 and C4
Paper ID: ART20163727
365

International Journal of Science and Research (IJSR)
ISSN (Online): 2319-7064
Index Copernicus Value (2015): 78.96 | Impact Factor (2015): 6.391
Volume 6 Issue 3, March 2017
www.ijsr.net
Licensed Under Creative Commons Attribution CC BY
are still trapezoid in shape. The peak in mandibular growth
will occur on average 1 year after this stage.
Cervical stage 3- Concavities at the lower borders of both
C2 and C3 are present. The bodies of C3 and C4 may be
either trapezoid or rectangular horizontal in shape. The peak
in mandibular growth will occur during the year after this
stage.
Cervical stage 4- Concavities at the lower borders of C2,
C3, and C4 now are present. The bodies of both C3 and C4
are rectangular horizontal in shape. The peak in mandibular
growth has occurred within 1 or 2 years before this stage.
Cervical stage 5 -The concavities at the lower borders of C2,
C3, and C4 still are present. At least one of the bodies of C3
and C4 is squared in shape. If not squared, the body of the
other cervical vertebra still is rectangular horizontal. The
peak in mandibular growth has ended at least 1 year before
this stage.
Cervical stage 6 -The concavities at the lower borders of C2,
C3, and C4 still are evident. At least one of the bodies of C3
and C4 is rectangular vertical in shape. If not rectangular
vertical, the body of the other cervical vertebra is squared.
The peak in mandibular growth has ended at least 2 years
before this stage.
6. Intraoral Radiographs/OPG
Tooth Mineralization - An Indicator of Skeletal Maturity
Dental maturity can be determined by the stage of tooth
eruption or the stage of tooth formation. Tooth formation is
proposed as more reliable criteria for determining dental
maturation. The ease of recognition of dental development
stages, together with the availability of periapical or
panoramic radiographs in most orthodontic and dental
practices are practical reasons for attempting to assess the
physiologic maturity without resorting to hand wrist
radiographs. Various researchers have carried out extensive
work to correlate the dental age and skeletal age. It is
believed that stages of root formation and mineralization
have a close relationship with the skeletal maturation of an
individual. Relationships between the stages of tooth
mineralization of the mandibular canine appear to correlate
better with ossification stages than do the other teeth. Some
of the dental indicators for skeletal maturity were put
forward by Chertkow and Fatti
43
based on the mineralization
of the lower canine. Nolla‟s
19
stage of calcification was
utilized by some workers to correlate with skeletal maturity.
Goldstein and Tanner have described a similar method based
on third molar. If a strong association exists between skeletal
maturity and dental calcification stages, the stages of the
dental calcification might be used as a first level diagnostic
tool to estimate the timing of the pubertal growth spurt.
Relationships between the stages of tooth mineralization of
the mandibular canine appear to correlate better with
ossification stages than do the other teeth.
Demirjlan’s Stages of Dental Calcification (1973)
18
Demirjian developed a method for estimating dental
maturity or dental age using radiological appearances of the
mandibular teeth i.e. from incisors to molars. Each tooth was
rated according to the developmental criteria. (Amount of
dentinal deposit, shape changes of pulpal chamber, etc)
Rather than changes in size. Eight stages i.e. from A to H
were defined from first appearance of calcified points to the
closure of apex.
18,19,42,43,45
Panoramic radiographs were used because they are easier to
make than intra oral radiographs in young and nervous
children and they give less radiation for full mouth
radiograph and picture of the mandible region produced is
little distorted. Though there is 3% to 10% enlargement of
the mandible (Sapoka and Demirjian 1971) this is not a
serious drawback, because the rating system is based on
shape criteria rather than on absolute lengths.
Canine calcification stages starts from stage D to H
Stage D (Fig. 26)
The crown formation is completed down to the cemento-
enamel junction.
The superior border of the pulp chamber has a definite
curved form, being concave towards the cervical region.
The projection of the pulp horn, if present, gives an
outline shaped like an umbrella top.
Beginning of root formation is seen in the form of a
Spicule.
Stage E (Fig. 27)
The walls of pulp chamber now form straight lines, whose
continuity is broken by the presence of the pulp horn,
which is larger in the previous stage.
The root length is less than the crown height.
Stage F (Fig. 28)
The walls of the pulp chamber now form a more or less
isosceles triangle. The apex ends is funnel shape.
The root length is equal to or greater than the crown
height.
Stage G (Fig. 29)
The walls of the root canal are now parallel.
Its apical end is still partially open.
Stage H (Fig. 30)
The apical end of root canal is completely closed.
The periodontal membrane has a uniform width around
the root and the apex.
7. Conclusion
Growth maturation stages are important for proper timing
and treatment management. Various methods are present of
which skeletal and physiologic/biochemical methods are
reliable for the clinical references. The review also suggests
that more simplified noninvasive methods can be considered
as additional diagnostic tool to avoid exposure to radiation.
Paper ID: ART20163727
366
International Journal of Science and Research (IJSR)
ISSN (Online): 2319-7064
Index Copernicus Value (2015): 78.96 | Impact Factor (2015): 6.391
Volume 6 Issue 3, March 2017
www.ijsr.net
Licensed Under Creative Commons Attribution CC BY
Figure 1: Stages in ossification of phalanges
Figure 2: First stage: ( Males 10.6 y , Females 8.1 y )
Figure 3: Second stage (Males 12y, Females 8.1 y)
Figure 4: Third stage: (Males 12.6y, Females 9.6y)
Figure 5: Fourth stage: (Males 13y, Females 10.6 y)
Figure 6: Fifth stage: (Males 14y, Females 11y)MP3 cap
Figure 7: Sixth stage (Males 15y, Females13y)
Figure 8: Seventh stage (Males 15.9y, Females13.3y)
Figure 9: Eighth stage (Males 15.9 y, Females13.9 y)
Figure 10: Ninth stage: (Males 18.5y, Females 16y)
Figure 11: Stages
Figure 12: MP3 F stage by Hagg and Taranger
Figure 13: MP3 FG stage by Hagg and Taranger
Figure 14: MP3 G stage by Hagg and Taranger
Figure 15: MP3 H stage by Hagg and Taranger
Figure 16: MP3 I stage by Hagg and Taranger
Paper ID: ART20163727
367
International Journal of Science and Research (IJSR)
ISSN (Online): 2319-7064
Index Copernicus Value (2015): 78.96 | Impact Factor (2015): 6.391
Volume 6 Issue 3, March 2017
www.ijsr.net
Licensed Under Creative Commons Attribution CC BY
Figure 17: DP-3 I stage by Hagg and Taranger
Figure 18: R-J stage by Hagg and Taranger
Figure 19: MP3-F stage modification by
Figure 20: MP3-FG stage modification by
Figure 21: MP3-G stage modification by Rajgopal and
Kansal
Figure 22: MP3-H stage modification by Rajgopal and
Kansal
Figure 23: MP3-HI stage modification by Rajgopal and
Kansal
Figure 24: MP3-I stage modification by Rajgopal and
Kansal
Figure 25: CVMI Stages
Figure 26: Mandibular Canine calcification stages stage D
Figure 27: Mandibular Canine calcification stages stage E
Figure 28: Mandibular Canine calcification stages stage F
Figure 29: Mandibular Canine calcification stages stage G
Figure 30: Mandibular Canine calcification stages stage H
References
[1] Hunter CJ. The Correlation Of Facial Growth With
Body Height And Skeletal Maturation At Adolescence.
The Angle Orthodontist. 1966;36(1):44-54.
[2] Björk A, Helm S. Prediction Of the age of maximum
puberal growth in body height. Angle Orthod.
1967;37:134-43.
[3] Pancherz H, Hägg U. Dentofacial orthopedics in
relation to somatic maturation. An analysis of 70
consecutive cases treated with the Herbst appliance. Am
J Orthod 1985;88:273-87.
Paper ID: ART20163727
368

International Journal of Science and Research (IJSR)
ISSN (Online): 2319-7064
Index Copernicus Value (2015): 78.96 | Impact Factor (2015): 6.391
Volume 6 Issue 3, March 2017
www.ijsr.net
Licensed Under Creative Commons Attribution CC BY
[4] Green LJ. Interrelationship among height, weight and
chronological, dental and skeletal age. Angle Orthod
1961;31:189-93.
[5] Hagg U, Taranger J. maturation indicators and pubertal
growth spurt. Am J Orthod Dentofacial Orthop
1982;53:97-106
[6] Fishman LS. Chronological versus skeletal age, an
evaluation of craniofacial growth. Angle Orthod
1979;49:181-9.
[7] Ruf S, Pancherz H. Development of the frontal sinus in
relation to somatic and skeletal maturity. A
cephalometric roentgenographic study at puberty.Eur J
Orthod 1996;18:491-7.
[8] Hägg U, Taranger J. Skeletal Stages of the hand and
wrist as indicators of the pubertal growth spurt.
ActaOdontol Scand. 1980;38:178-200.
[9] Mir CF, Nebbe B, Major PW. Use of Skeletal
Maturation Based on Hand Wrist Radiographanalysis as
Predictor of Facial Growth: A Systematic Review.
Angle Orthod.2004;74:118-124.
[10] Fishman LS.radiographic evaluation of skeletal
maturation- A clinically oriented method based on hand
wrist films. Angle Orthod.1982;52
[11] Todd TW. Atlas of Skeletal Maturation (Hand), St.
Louis: Mosby; 1937.
[12] Pyle SI. Skeletal maturation: Hand-wrist radiographic
assessment. In: Broadbent BH Sr, Broadbent BH Jr,
editors. Bolton Standards of Dentofacial Developmental
Growth, St. Louis: CV Mosby, 1975.
[13] Tanner JM, Whitehouse RH, Cameron N, Marshall WA,
Healy MJ, Goldstein H. Assessment of Skeletal
Maturity and Prediction of Adult Height (Tw2 Method),
London: Academic Press; 1983.
[14] Baccetti T, Franchi L, McNamara JA. The Cervical
Vertebral Maturation (CVM) Method For the
Assessment Of Optimal Treatment Timing In
Dentofacial Orthopedics. Seminars In Orthodontics.
2005;11(3):119-29.
[15] Lamparski D G. Skeletal age assessment utilizing
cervical vertebrae. 1972 Master of Science Thesis.
University of Pittsburg.
[16] Hassel B, Farman AG. Skeletal maturation evaluation
using cervical vertebrae. Am J Orthod Dentofacial
Orthop 1995;107:58-61
[17] Baccetti T, Franchi L, McNamara JA Jr. An improved
version of the cervical vertebral maturation (CVM)
method for the assessment of mandibular growth. Angle
Orthod 2002;72:316-23.
[18] Demirjian A, Goldstein H, Tanner JM. A New system
of dental age assessment. Hum Biol. 1973;45(2):211-27.
[19] Nolla C. The Development of permanent teeth: J Dent
Child 1960.
[20] Demirjian A, Goldstein H. New systems for dental
maturity based on seven and four teeth. Ann Hum Biol
1976;3:411-21.
[21] Demisch A, Wartmann P. Calcification of the
mandibular third molar and its relation to skeletal and
chronological age in children. Child Dev 1956;27:459-
73.
[22] Himes JH, Huang Z, Haas JD, Rivera R, Pineda O.
Serum alkaline phosphatase activity and skeletal
maturation in Guatemalan adolescents. Ann Hum Biol
1993;20:39-46.
[23] G, Baccetti T, Contardo L, Di Lenarda R. Gingival
crevicular fluid alkaline phosphatase activity as a non-
invasive biomarker of skeletal maturation.
OrthodCraniofac Res 2011;14:44-50.
[24] Fraher LJ. Biochemical markers of bone
turnover.ClinBiochem 1993;26:431-2.
[25] Argente J, Barrios V, Pozo J, Muñoz MT, Hervás F,
Stene M, et al. Normative data for insulin-like growth
factors (IGFs), IGF-binding proteins, and growth
hormone-binding protein in a healthy Spanish pediatric
population: Age- and sex-related changes. J
ClinEndocrinolMetab 1993;77:1522-8.
[26] Ishaq RA, Soliman SA, Foda MY, Fayed MM. Insulin-
like growth factor I: A biologic maturation indicator.
Am J Orthod Dentofacial Orthop 2012;142:654-61.
[27] Gupta S, Jain S, Gupta P, Deoskar A. Determining
skeletal maturation using insulin-like growth factor I
(IGF-I) test. ProgOrthod 2012;13:288-95.
[28] Srinivasan B, Premkumar S. Assessment of serum
dehydroepiandro-steronesulphate in subjects during the
pre-pubertal, pubertal, and adult stages of skeletal
maturation. Eur J Orthod 2012;34:447-51.
[29] Perinetti G, Baccetti T, Di Leonardo B, Di Lenarda R,
Contardo L. Dentition phase and chronological age in
relation to gingival crevicular fluid alkaline phosphatase
activity in growing subjects. ProgOrthod 2011;12:100-
6.
[30] Szulc P, Seeman E, Delmas PD. Biochemical
measurements of bone turnover in children and
adolescents. OsteoporosInt 2000;11:281-94.
[31] Baccetti T, Franchi L, De Toffol L, Ghiozzi B, Cozza P.
The diagnostic performance of chronologic age in the
assessment of skeletal maturity.ProgOrthod 2006;7:176-
88.
[32] Petrovic A, Stutzmann J, Lavergne J. Mechanism of
craniofacial growth and modus operandi of functional
appliances: A cell-level and cybernetic approach to
orthodontic decision making. In: Carlson DS, editor.
Craniofacial Growth Theory and Orthodontic
Treatment. Monograph No. 23, Ann Arbor: Craniofacial
Growth Series, Center for Human Growth and
Development, University of Michigan; 1990. p. 13-74.
[33] Baccetti T, McGill JS, Franchi L, McNamara JA Jr,
Tollaro I. Skeletal effects of early treatment of Class III
malocclusion with maxillary expansion and face-mask
therapy. Am J Orthod Dentofacial Orthop
1998;113:333-43.
[34] Franchi L, Baccetti T, McNamara JA Jr. Shape-
coordinate analysis of skeletal changes induced by rapid
maxillary expansion and facial mask therapy. Am J
Orthod Dentofacial Orthop 1998;114:418-26.
[35] Baccetti T, Franchi L. Updating cephalometrics through
morphometrics: thin-plate spline analysis of craniofacial
growth/treatment changes, in McNamara JA Jr (ed):
Growth Modification: What Works, What Doesn‟t, and
Why. Monograph No.35, Craniofacial Growth Series.
Ann Arbor, MI, Center for Human Growth and
Development, University of Michigan, 1999, p. 257-
273.
[36] Enlow D, Hans M. Essentials of facial growth.
Philadelphia. W.B. Saunders; 1996, p. 65-72.
Paper ID: ART20163727
369

International Journal of Science and Research (IJSR)
ISSN (Online): 2319-7064
Index Copernicus Value (2015): 78.96 | Impact Factor (2015): 6.391
Volume 6 Issue 3, March 2017
www.ijsr.net
Licensed Under Creative Commons Attribution CC BY
[37] Greulich WW, Pyle SI. Radiographic Atlas Of Skeletal
Development Of the Hand And Wrist : Stanford
University Press; 2 edition; 1959.
[38] Brown T, Barrett MJ, Grave KC. Facial growth and
skeletal maturation at adolescence. Dan Dent J
1971;75:1121-2.
[39] Hägg U, Taranger J. Maturation indicators and the
pubertal growth spurt. Am J Orthod 1982;82:299-309.
[40] Fishman LS. Radiographic evaluation of skeletal
maturation. A clinically oriented method based on hand-
wrist films. Angle Orthod 1982;52:88-112
[41] Ruf S, Pancherz H. Development of the frontal sinus in
relation to somatic and skeletal maturity. A
cephalometric roentgenographic study at puberty.Eur J
Orthod 1996;18:491-7.
[42] Tanner JM, Whitehouse RH, Marshall WA, BS
C.Prediction Of adult height, bone age, and occurrence
of menarche, at age 4 To 16 With allowance for
midparental height. Arch Dis Child. 1975;50:14-26.
[43] Chertkow S, Fatti P. The relationship between tooth
mineralization and early radiographic evidence of the
ulnar sesamoid. Angle Orthodont. 1979;49:181-189.
[44] Coutinho S, Buschang PH, Miranda F. Relationships
between mandibular canine calcification stages and
skeletal maturity. Am J Orthod Dentofacial Orthop
1993;104:262-8.
[45] Fraher LJ. Biochemical markers of bone
turnover.ClinBiochem 1993;26:431-2.
[46] Argente J, Barrios V, Pozo J, Muñoz MT, Hervás F,
Stene M, et al. Normative data for insulin-like growth
factors (IGFs), IGF-binding proteins, and growth
hormone-binding protein in a healthy Spanish pediatric
population: Age- and sex-related changes. J
ClinEndocrinolMetab 1993;77:1522-8.
[47] Ishaq RA, Soliman SA, Foda MY, Fayed MM. Insulin-
like growth factor I: A biologic maturation indicator.
Am J Orthod Dentofacial Orthop 2012;142:654-61.
[48] Gupta S, Jain S, Gupta P, Deoskar A. Determining
skeletal maturation using insulin-like growth factor I
(IGF-I) test. ProgOrthod 2012;13:288-95.
[49] Perinetti G, Paolantonio M, D‟Attilio M, D‟Archivio D,
Tripodi D, Femminella B, et al. Alkaline phosphatase
activity in gingival crevicular fluid during human
orthodontic tooth movement. Am J Orthod Dentofacial
Orthop 2002;122:548-56.
[50] Insoft M, King GJ, Keeling SD. The measurement of
acid and alkaline phosphatase in gingival crevicular
fluid during orthodontic tooth movement. Am J Orthod
Dentofacial Orthop 1996;109:287-96.
[51] Szulc P, Seeman E, Delmas PD. Biochemical
measurements of bone turnover in children and
adolescents. OsteoporosInt 2000;11:281-94.
[52] NameetaKaur, Reena R. Kumar, Miglani A. IGF – I: A
legitimete skeletal maturity indicator. J Indian
OrthodSoc 2010;25-32.
[53] Juul A, Bang P, Hertel NT, Main K, Dalgaard P,
Jørgensen K, et al. Serum insulin-like growth factor-I in
1030 healthy children, adolescents, and adults: Relation
to age, sex, stage of puberty, testicular size, and body
mass index. J ClinEndocrinolMetab 1994;78:744-52.
[54] Rajagopal R, Kansal S. A comparison of modified Mp3
stages and cervical vertebrae as growth indicators. J.
Clin Orthod.2002;36:398-406
[55] Premkumar S. Textbook of craniofacial growth; 1
st
edition ; New Delhi ; Jaypee Brothers Medical
Publishers (P) LTD.
Paper ID: ART20163727
370
