DBChEx: Interactive Exploration of
Data and Schema Change
Tobias Bleifuß
Hasso Plattner Institute
University of Potsdam
tobias.b[email protected]
Leon Bornemann
Hasso Plattner Institute
University of Potsdam
leon.bor[email protected]
Dmitri V. Kalashnikov
AT&T Labs – Research
Felix Naumann
Hasso Plattner Institute
University of Potsdam
Divesh Srivastava
AT&T Labs – Research
ABSTRACT
Data exploration is a visually-driven process that is often
used as a first step to decide which aspects of a dataset
are worth further investigation and analysis. It serves as
an important tool to gain a first understanding of a dataset
and to generate hypotheses. While there are many tools for
exploring static datasets, dynamic datasets that change over
time still lack effective exploration support.
To address this shortcoming, we present our innovative
tool Database Change Explorer (DBChEx) that enables ex-
ploration of data and schema change through a set of ex-
ploration primitives. Users gain valuable insights into data
generation processes and data or schema evolution over time
by a mix of serendipity and guided investigation. The tool is
a server-client application with a web front-end and an un-
derlying database that stores the history of changes in the
data and schema in a data model called the change-cube.
Our demonstration of DBChEx shows how users can inter-
actively explore data and schema change in two real-world
datasets, IMDB and Wikipedia infoboxes.
1. INTRODUCTION
Data changes. This undeniable fact has led to the devel-
opment of numerous methods and systems to manage and
document changes to data. However, only recently the drop-
ping prices of hard drive storage rendered it possible to now
also keep all or at least a large portion of historical data
for analysis of its changes. The nature of changes reveal
rich insights that cannot be found in a static version of the
dataset and can serve many purposes, such as summariza-
tion, compression, future prediction, provenance, or pattern
discovery.
Imagine a data scientist Alice who has gathered a number
of historical dumps of a dataset. She has only recently joined
This article is published under a Creative Commons Attribution License
(http://creativecommons.org/licenses/by/3.0/), which permits distribution
and reproduction in any medium as well allowing derivative works, pro-
vided that you attribute the original work to the author(s) and CIDR 2019.
9th Biennial Conference on Innovative Data Systems Research (CIDR ‘19)
January 13-16, 2019 , Asilomar, California, USA.
the organization, but she possesses domain knowledge and
a rough understanding of the current state of the dataset.
While analyzing the dataset, a set of questions arose that
only the history of changes to the dataset can answer. For
example: Am I right to assume that attribute X is constant?
How old are the entities in table Y? When were they last
updated? Do the changes to entities of table Z correlate?
However, answering those questions using existing tools is a
tedious task, especially if the historic dumps originate from
different systems and use different legacy schemata.
Even if the dumps are all in the same relational format, the
problem of how to access the previous versions still persists.
A simple line-wise difference is easy to compute, but often
lacks the necessary semantic meaning. Alice cannot simply
load those multiple dumps in a DBMS, because this would
cause naming conflicts and even if she can avoid that by,
e.g., defining different namespaces in the same database, she
would still store highly redundant data.
The queries to actually identify the change would also be
non-trivial and probably inefficient, as one would have to
join a large number of different relations. Due to the com-
plexity and poor performance, Alice quickly loses interest
and she is less creative than she could be: she writes ad-hoc
queries, executes them, waits for their completion, reconsid-
ers her assumptions, writes ad-hoc queries, . . . If she did
not face all of those issues, but had a suitable tool for ex-
ploration of changes, she would have quickly come up with
new questions that she did not think of before. For example,
the exploration might hint at seasonal behavior or periodic-
ity that she did not consider and can now analyze with the
appropriate tools.
Alice’s issues are part of a larger research problem on
how to recognize, explore, and evaluate change in data and
schema. We have published a comprehensive vision paper
on change exploration [2], which touches on many areas that
aim, among others, to capture, explore, categorize, and pre-
dict changes in databases. We have also taken initial steps to
make parts of this vision a reality. For example, we track ob-
jects in databases over time to understand their changes at
a finer level. In addition, for an overview of the large num-
ber of changes, we developed a framework to map change
histories to time series and cluster those time series [3]. We
have also begun to take advantage of these insights, such as
investigating on how historical changes can help with prob-
lems such as the automatic discovery of dependencies and

constraints. However, these steps are just small parts that
all fit under the big umbrella of our vision, which we are
implementing as part of our project “J
J
anus”
1
.
In this paper, we present an innovative tool that imple-
ments several aspects of this vision to support Alice in her
exploration of change: the Database Change Exploration
(DBChEx) tool. DBChEx allows Alice to interactively ex-
plore change data. The goal is to provide an easy, interactive
way to obtain a high-level understanding of how a dataset
changes over time. By physically implementing exploration
primitives and operators from our vision, DBChEx allows
users to:
• Interactively browse, filter, and group changes to rows,
columns, values or entire tables
• View statistics and excerpts of the change data, such
as its volatility and temporal distribution: a dualis-
tic approach that synchronizes visual and statistical
exploration that complement each other
• Mine changes, such as clustering changes according to
their temporal behavior
• Feed exploration findings back into the process through
a closed-loop approach
• Save the exploration history as bookmarks
• Export excerpts of the data for further inspection out-
side of the tool
In the next section we describe the general ideas behind
change exploration with DBChEx. Then follows a more de-
tailed description of the implementation of DBChEx includ-
ing its architecture in Section 3. The demonstration in Sec-
tion 4 shows how to use this implementation to discover
interesting changes in two different datasets. Before we con-
clude in Section 6, we give a brief overview of related work
in Section 5.
2. CHANGE EXPLORATION
As a data model to represent changes, DBChEx uses the
notion of change-cubes [2], which are characterized as fol-
lows:
Definition 1. A change c is a quadruple of the form
htimestamp, id, property, valuei or in brief ht, id, p, vi. We call
a set of changes a change-cube C = {c
1
, . . . , c
n
}. Among
the changes, combinations of (t, id, p) are unique.
A change ht, id, p, vi describes that at a certain point in
time t (When?) the property p (Where? ) of an entity with
the stable identifier id (What? ) was changed to the new
value v (How?). The uniqueness constraint allows each en-
tity/property combination to have only one value at a point
in time. This value is valid until the chronologically next
change with the same entity/property combination. Dele-
tions of properties are modeled through setting its value to
the Null-value (⊥).
This format is flexible enough to handle changes in both
data and schema, and general enough to integrate data from
various different formats or domains. Thus, the DBChEx
tool serves the exploration of changes from various sources of
data, individually and jointly to reveal correlations between
those changes. During the demonstration of DBChEx we
show how Wikipedia infobox data and IMDB movie data
changes over time.
1
https://www.ianvs.org
Table 1: Exploration primitives on the change-cube.
Operator Description
sort sorts the changes within a change-cube
slice filters the changes in a (set of) change-cube(s)
split groups changes and splits the cube accordingly
union unions multiple change-cubes into one
rank sorts (a set of) change-cubes
prune filters change-cubes by threshold
top selects change-cubes by relative position
To enable the fine-grained exploration of change-cubes, we
define a set of exploration primitives on top of our change-
cube model. Table 1 gives an overview of the primitives
defined on sets of change-cubes. For a more formal defini-
tion of those exploration primitives, we refer to our vision
paper [2]. Because the defined operators are closed, we can
compose them and we call such a composition of operators
an operator sequence. An example of such an operator se-
quence is split
p
◦ rank
|distinct v|
◦ top
5
, which results in a
change-cube for each of the top five properties in the num-
ber of different values. In our tool it usually takes the user
just a click to add, edit, or remove new operators from the
current operator sequence.
Change exploration requires access not only to the cur-
rent dataset, but also to its (at least partial) history. First,
nearly all modern databases store some sort of log file or
are able to back up snapshots. In addition, a surprising
number of major public-domain datasets contain data that
reflect their change over time as well, such as Wikipedia,
IMDB, Musicbrainz, and DBLP. These projects release their
data history at different levels of granularity. Although fine-
granular changes are preferable, the change-cube format is
also suitable for capturing changes from a series of snap-
shots, such as provided by IMDB. We hope that advances
in research on change exploration will illustrate the great
benefits of analyzing data histories; and that, in turn, will
encourage more and more data owners to maintain those
histories in the first place and also make them available.
Populating the change-cube is a problem that also re-
quires good tooling support. However, it is not the focus
of DBChEx, which assumes an already populated change-
cube, even if it only is by a simple transformation. We
already have change-cubes for the four sources mentioned
above and are working on tooling to support more. These
transformations from data sources to change-cubes can be
relatively generic in the beginning, because the user may not
know and understand the previous schemata.
The simplest, but not ideal, way to translate relational
data into this model is to view each row of a table as an
entity and treat the key as a stable identifier. All other
columns become properties of this entity with the column
name serving as a property identifier. A schema change
can, however, cause much more change records than actually
necessary. If columns and thus properties from one revision
to the next no longer exist precisely the same way, they
have to be deleted for each individual entity (set to ⊥) and
possibly others have to be added. This is the case even if
the actual data values may not have changed at all.
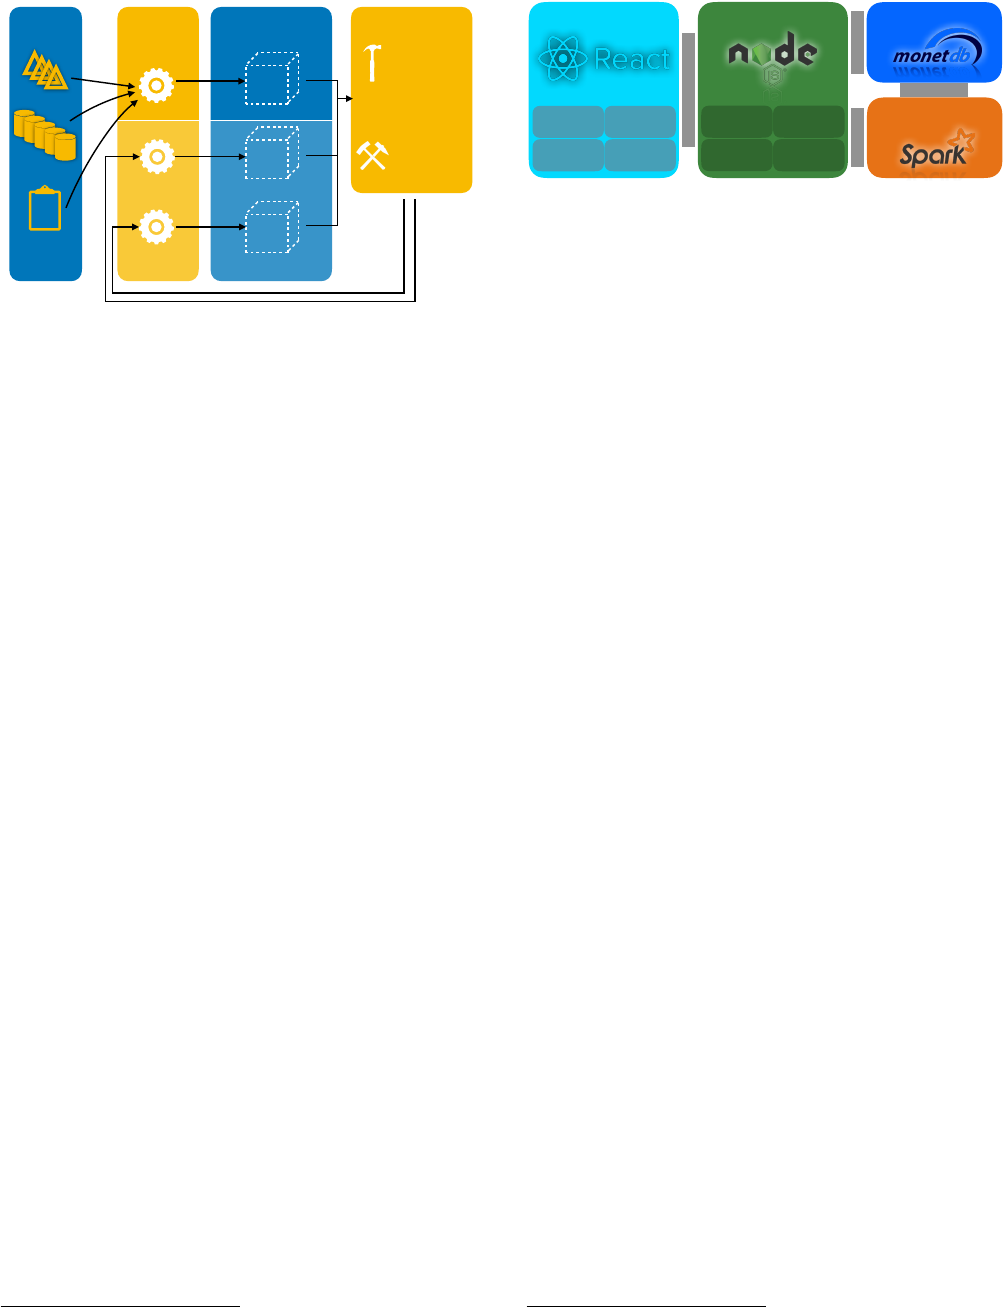
Hence, we propose an iterative, closed-loop approach that
improves the semantics of the change-cube over time. In
this way, knowledge gained during exploration can be fed
back into the transformation. For example, if users recog-
Trans-
formation
Change-
cube
Data
sources
v
5
Snapshots
Delta
Logs
…
…
…
Exploration
Primitives
Mining
Queries
?
View
definitions
Views
…
…
Figure 1: DBChEx workflow overview
nize that a property has been renamed, they can merge these
two properties at the click of a button. Each of these trans-
formations creates a view on the original change-cube. The
view definitions can also be implemented with the help of
operator sequences, in which the above operators are used to
select the part of the cube to be transformed. The transfor-
mation on the selected quadruples is then achieved either via
templates for frequent schema changes (such as renaming)
or custom transformations defined in SQL or an external
program. Figure 1 shows how we envision the general data
change exploration workflow using DBChEx.
3. ARCHITECTURE
Figure 2 shows the general components of DBChEx. The
user interacts with the system through a web client. This
web client communicates with a node.js backend via http or
WebSockets. The backend, in turn, uses a database via a
SQL interface – in our current implementation MonetDB [8]
– and a data clustering service that is currently implemented
in Apache Spark [15].
3.1 Web client
The client is a browser application implemented in Re-
act
2
. Figure 3 gives an impression of the user interface. On
the top, the tool displays the currently active operator se-
quence, in this case a single split by id. Below that operator
sequence, the user can see and interact with its result: a set
of change-cubes. This set can be sorted by multiple statis-
tics, effectively turning that set into an ordered list. On the
right side of the interface, two different tabs display previ-
ously visited operator sequences as well as bookmarks. The
user-interface is designed to keep the user engaged and re-
duce the amount of required text input. Through clicking
on elements that appear interesting, the user can modify the
current operator sequence.
Operator sequences. The operator sequences are the
primary navigation through the changes: they represent
the current exploration path and show what the user cur-
rently focuses on (comparable to the navigation bar in a web
browser). The user starts the exploration process by apply-
ing an operator on the initial full change-cube. The result
of each operator sequence is one or multiple change-cubes.
2
https://reactjs.org/
Web frontend
Backend
Database
Analytical
services
History &
Bookmarks
Operator
sequences
Statistics
Visualization
Cache
SQL
Translation
Sequence
Normalization
Statistics
Gathering
HTTP / WebSocket
SQL
HTTP
SQL
Figure 2: DBChEx architecture overview
The user can change the order of operators in the sequence
of currently active operators as well as modify each of them.
While browsing through the space of possible sequences,
the user might fear to lose track. Since this can cause coun-
terproductive hesitation, we introduce two features that are
inspired by web browsers: a history of previously executed
operator sequences and the possibility to bookmark cer-
tain operator sequences that the user considers interesting
enough to save for future investigation. The tool also offers
the ability to explore datasets collaboratively: the URL in
the browser reflects the current state of the exploration, so
that the user can share the current view by simply copying
that URL.
Statistics and analytical services. For each of the
change-cubes, DBChEx computes multiple statistics and pre-
sents those to the user. For example, the tool shows the
most frequent entities or properties in a change-cube, but
also more complex statistics, such as a volatility measure
for each of the cubes, i.e., a normalized measure for their
degree of variation. These statistics and visualizations can
serve as a recommendation and guidance to the user for fur-
ther analysis. The user can click on any of the elements to
apply a filter that removes unwanted entities or properties
from the change-cubes.
At each point in the exploration it is possible to switch to
visualizations that are in sync with the current exploration
progress and guide further exploration steps. A helpful visu-
alization for volatility is a heatmap that allows users to see
at a glance which ID/Property combinations have particu-
larly high or low values. An example of such a heatmap is
shown in Figure 4. Cross-filtering is the idea that new oper-
ator sequences lead to new visualizations, but new operator
sequences can also be generated through direct interaction
with the visualization [14]. For example, clicking on one of
the fields in the heat map activates a corresponding slice that
focuses only on the changes that are responsible for the color
of that field. At the moment, the visualizations in DBChEx
are still rudimentary, but further visualizations are easy to
add. Especially visualizations that rely on animations for
the time domain similar to Gapminder
3
or map-based visu-
alizations [11] could be very helpful.
While focusing on certain topics can already be helpful,
sometimes it is difficult to spot interesting subgroups through
critical inspection. In such cases, the tool can support the
user by providing analytical services, such as outlier detec-
tion or clustering change-cubes based on certain features.
For example, one clustering method maps each change-cube
to a time series and uses time series clustering to group them
based on their temporal behavior. The result of the clus-
3
https://www.gapminder.org/
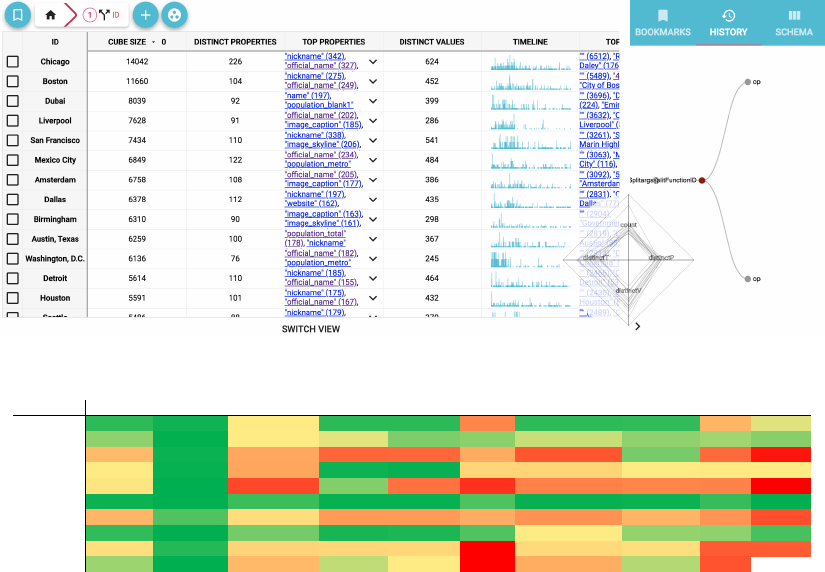
Figure 3: The DBChEx web user interface, here with one line/change-cube per settlement
exampleVolatility
Page 1
Settlement area_code coordinates image_caption
image_flag image_map name population_as_of postal_code website Sum
Berlin 19 7 103 18 18 383 19 20 251
838
Cape Town 56 2
100 89 50 55 78 57 63
550
Chicago 235
5 290 475 472 275 517
47 459
2775
Istanbul 100
3 294 6 4 162 163
101 107
940
London 116 1 554
51 439
620 397 384 390 2952
Potsdam 5 1 24 3 4 31 4
5 22 99
Rome 245
32 141 324 324 272 347 250 344 2279
Stockholm 20 1 46 10
12 32 99 58 56 334
Tokyo 135 15 166 156 156 754 149 135 503 2169
Sum 931 67 1718 1132 1479 2584 1773
1057 2195 12936
Figure 4: A heatmap for changes on selected Wikipedia settlement entities and selected infobox properties, color-coded relative
to the absolute number of changes.
tering is an additional feature of the change-cubes that can
serve as a filter or grouping criterion. Additionally, the clus-
tering result can also be visualized by highlighting change-
cubes in different colors.
Closed-loop approach. Because there are often several
ways to transform the changes for a particular dataset to
the change-cube, the user has to make modeling decisions.
Depending on the user’s knowledge, these are probably not
perfect at first and in the course of exploration, the user will
notice opportunities for improvement. Due to the closed-
loop approach, our tool offers the possibility to implement
these directly and to create a view on the change-cube with
just a few clicks, which implements these insights. For ex-
ample, the user can detect a renaming of a property, link
these two properties, and profit from a longer history avail-
able for this new merged property. Users employ the already
mentioned query operators to select the parts of the change-
cube to be changed. The modification operators differ from
the query operators in that they work at the change level
and not at the cube level. The modification operators map
previous changes to (a set of) new changes. A very simple
modification operator is the set operator, which overwrites
the values of a given dimension with a constant for all of the
selected changes.
3.2 Server backend
Our web-based tool is currently backed by the columnar
SQL server MonetDB [8]. A sequence of operators is mapped
to a single SQL query and additional queries for the metrics
that act as important metadata for the resulting cubes.
From operator sequences to SQL queries. The back-
end needs to translate the operator sequences to SQL queries
to execute them on the database. In the database, all change
records are stored in a table with four columns: time, id,
property, value. For example, an operator sequence like
split
id
◦ rank
size
◦ top
10
◦ filter
property=a
, which results in a
change-cube for each of the ten most changed entities fil-
tered to only changes that affect the property ‘a’, translates
to the following query:
WITH t0 ( g0_0 , pos ) AS ( SELECT ID AS g0 ,
RO W_N UMB ER () OVER ( ORD ER BY COUNT (*) DESC )
FROM wiki GROUP BY g0 )
SEL ECT id AS g0 , COUNT (*) FROM changes , t0
WHERE t0 . pos <= 10 AND id = t0 . g0_0 AND prop =
’a ’
GROUP BY g0 O RDER BY COUNT (*) DESC LIMIT 20
OFF SET 0;
The backend automatically transforms operator sequences
to SQL queries by handling each operator in the sequence
from left to right and incrementally building the query. Each
operator adds and/or removes a combination of WHERE- or
GROUP BY-clauses. For some operators it is necessary to cre-
ate views (such as t0 in the example above), which can then
be used in the WHERE- or GROUP BY-clauses.
Cube modifications. The backend applies the cube
modification operators that implement the closed-loop ap-
proach. Simple operators, such as the set operator, can even
be executed directly in the database, although for more com-
plex operators it is likely that the backend must implement
them. In general, the modification operators remove and
add some changes from the original change-cube. Based on

the assumption that most modification operators touch only
a small amount of the total changes, we construct two sub-
queries that return the removed and added changes. By
simply linking the original change table by EXCEPT or UNION
with the two subqueries, we obtain the modified cube.
This modified cube may contain changes that are either
(i) inconsistent or (ii) redundant. Two changes are incon-
sistent, if they both set the value for the same property of
the same entity at the same time and do not agree on that
value. So they violate the uniqueness-constraint mentioned
in Section 2. For now, we rely again on the database to de-
tect those inconsistencies through grouping the changes by
time, id, and property and counting the number of distinct
values. If such inconsistencies are detected, we require the
user to interactively resolve them by one of several options.
Either the distinct values are concatenated, or one of the
values is preferred, i.e., either the newly added changes have
a higher priority or vice versa.
For redundant changes, no user input is required. Two
changes are redundant, if they set the value of the same
property of the same entity at two distinct points in time
with no change of that entity/property-combination in be-
tween. If this is detected, the tool simply removes the second
change from the change-cube. For detection, DBChEx uses
a combination of SQL and backend code. The SQL query
generates a list of possibly redundant change candidates and
the backend code then checks whether they are really redun-
dant.
Performance optimizations. We employ a number of
optimizations to make this approach more efficient: first
the operator sequences are normalized through a number of
rules. For example, if an operator sequence contains multi-
ple consecutive filter operators, the order of those filters does
not matter and they can be arranged in a fixed order. This
normalization is important for the prioritized cache that the
tool uses to avoid reoccurring calculations. Through this
normalization more operator sequences are known to deliver
the same output and can therefore rely on the cache. In
the example above, the result of the subquery that retrieves
the ten most changed entities can easily be cached. For our
test datasets this results in a satisfactory (subsecond) perfor-
mance. Still, for larger datasets a more specialized solution
with custom index structures could become necessary.
Analytical services. The analytical services receive a
SQL query as input, which corresponds to the current oper-
ator sequence. By executing this query on the database, the
analytical service can retrieve those change records, which
form the basis of the analysis. Our analytical services are
currently implemented in Scala and Spark, but of course
other languages and frameworks can be used as well. Once
the analysis is complete, the service writes the results back
to the database and notifies the backend via an HTTP call.
The latter can then inform the user, who can then proceed
with inspecting the results. In addition to clustering, other
potential analytical services could include outlier detection
or an evaluation of individual changes in terms of quality or
trustworthiness.
4. DEMONSTRATION
This section describes two interactive exploration scenar-
ios using DBChEx on two different datasets: IMDB and
Wikipedia infoboxes. For the Wikipedia dataset, the user
is able to explore vandalism and edit wars. The dataset
also contains a large number of genuine data changes and
also schema changes that are to be discovered, such as dis-
tinct infobox templates that are merged or attributes that
are renamed. For IMDB, the user can also observe schema-
changes, but much less frequently. IMDB is an example that
has attributes of highly different volatility. For instance, the
number of votes on a movie (numVotes) have a high volatil-
ity in contrast to its primaryTitle. In the future we plan
to make DBChEx an open-source tool and also provide our
datasets in an accessible way.
4.1 Exploring Wikipedia infobox changes
The DBChEx project homepage provides a short overview
as well as two demonstration videos on the Wikipedia data-
set of changes to settlement infoboxes
4
. In the first video,
Alice focuses through clicking on the highly-volatile entity
Chicago and thereby slicing. By inspecting the value do-
main, she detects that many changes contain the former
mayor of Chicago Richard M. Daley in the value domain.
As she had only expected one such change after his election
in 2011, but instead there are 176 such changes. Through
clicking on his name, she applies a filter to see only those
changes and realizes that only the property leader name of
Chicago was changed to that value. She continues to inspect
all changes to that property and finds – besides vandalism – a
high disagreement among users on whether the leader name
should be updated after the mayoral election or after the
inauguration.
Alice shares the URL of her findings to Bob, so he di-
rectly sees all the change-cubes Alice saw in her last step.
He gets curious and wants to find out what other changes re-
late to Chicago. In the second video, Bob follows the traces
of Chicago again, but unlike Alice he focuses on changes
that contain Chicago in the value dimension. Here he finds
a lot of changes on the same day that update the sub-
division name3 of various locations in Chicago. At this
point the following feature of DBChEx can help Bob: Once
the user has found an interesting change, the tool provides
a dataset-specific link back to the original source of the
change. For Wikipedia, the tool provides context informa-
tion (user, comment) and a link to the diff-page of the re-
vision, while for other datasets the tool could for example
show the relevant SQL INSERT/UPDATE statement. This fea-
ture greatly helps to understand the intentions of a certain
change. In this case, some further investigation reveals that
on that day two infobox templates (community area and
settlements) were merged.
4.2 Exploring IMDB changes
Figure 5 gives a short overview of a small exploration sce-
nario on IMDB, for which we have gathered 47 daily snap-
shots. Assume that Alice first performs a split by property,
which results in one change-cube per property as shown in
Figure 5a. For each of the change-cubes, the tool displays a
number of statistics, for example the distribution of changes
over time. A large spike of changes for the properties episo-
deNumber and seasonNumber on 2018-02-02 catches Alice’s
eye. For further inspection, she prunes all other change-
cubes and keeps only those two change-cubes for both prop-
erties. Furthermore, by clicking on that timestamp, she
4
https://hpi.de/naumann/projects/
data-profiling-and-analytics/dbchex.html
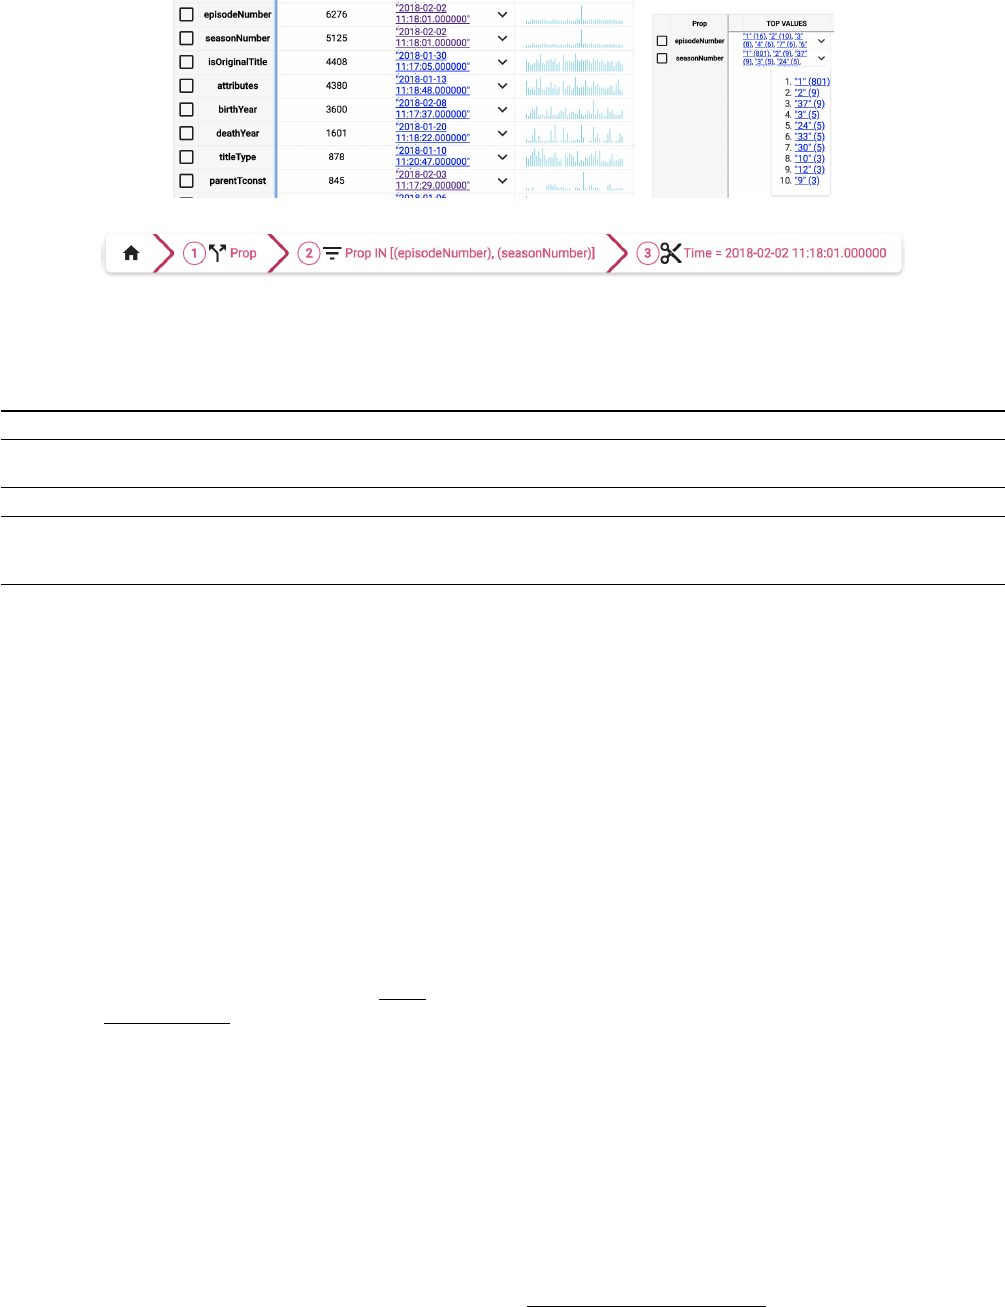
(a) Split by property (b) Top values
(c) Operator sequence
Figure 5: Individual steps of IMDB exploration
Table 2: Example transformation for an IMDB relation affected by a schema change
Time Data Changes (original) Changes (transformed)
2018-02-05 t001|"nm001,nm002" 2018-02-05,t001,principalCast,"nm001,nm002"
2018-02-05,t001|0,nconst,"nm001"
2018-02-05,t001|1,nconst,"nm002"
2018-02-06 t001|"nm001,nm003" 2018-02-06,t001,principalCast,"nm001,nm003" 2018-02-05,t001|1,nconst,"nm003"
2018-02-10
t001|0|nm001|⊥|⊥|⊥
t001|1|nm003|⊥|⊥|⊥
2018-02-05,t001,principalCast,NULL
2018-02-05,t001|0,nconst,"nm002"
2018-02-05,t001|1,nconst,"nm003"
-
applies a filter that keeps only changes that happened on
2018-02-02, which results in the operator sequence shown in
Figure 5c. Next she focuses on the value domain and finds
that a large number of entities received an update that set
their seasonNumber to 1. She looks up some of those enti-
ties and realizes that all of them are from the same series
“One Piece”. On that day more than 800 episodes of that
series got merged into one season, which leads her to the
conclusion that there must be a (semi-)automatic way that
allows users to perform such bulk changes. Her assump-
tion was substantiated when she inspected the other spike
in Figure 5a for changes of the property parentTconst, which
identifies the parent TV series. On 2018-02-03 this property
was changed for 206 episodes from tt0338640 to tt0209736.
Although the schema is quite static for this dataset, by
inspecting the volatility of properties, Alice could also find
a schema change that happened on 2018-02-10. For the rela-
tion title.principals, the schema changed from tconst, prin-
cipalCast to tconst, ordering, nconst, category, job, charac-
ters. In this case, Alice can benefit from the closed-loop
approach to have a longer history of data available across
this schema change. principalCast was previously a comma-
separated list of nconst references. By concatenating tconst
and the position of individual nconst elements as order-
ing, new entity IDs are created that correspond to the new
schema. These new entities have exactly one property nconst,
while the other properties (category, job, characters) are all
Null. This transformation may turn a change before 2018-
02-10 into several changes affecting several entities, but some
of the changes caused by the schema change may also dis-
appear. How this transformation might look like for one
particular movie is shown in Table 2.
5. RELATED WORK
Data exploration is a wide field of research [9]. However,
most works either assume static data [10,12] or are domain-
specific [13]. In contrast to related work, we treat the change
itself as a first-class citizen. For instance, based on profiling
results created by the Bellman tool [6], Dasu et al. have ex-
plored how data and schema changes in a database can be
observed through a limited set of metadata [5]. That work
has focussed on the case of only limited access to the data-
base. In contrast, we assume full access to the database and
its changes, and are thus able to focus on more fine-grained
change exploration. Another related field is the visual ana-
lytics of data [7]. There are a large variety of visualizations
for time-oriented data [1], some of which are also imple-
mented by commercial tools, such as Tableau
5
. However,
our tool offers more than just pure visualization. It allows
primitive-based browsing and a closed-loop approach to en-
able the user to quickly select the relevant changes and to
properly deal with schema changes. Query steering systems,
such as DBNav [4], can help users in the ad-hoc naviga-
tion through the large space of possible explorations. Given
meaningful transformations to time series, time series explo-
ration techniques and tools [16] can also be used to visualize
and interpret change behavior.
6. CONCLUSIONS
With DBChEx we present an interactive exploration tool
that enables the user to explore changes of data and schema
in an innovative way: it operates on the newly defined change-
cubes through a set of exploration primitives. A unique
feature is that our framework treats changes as first-class
5
https://www.tableau.com/
citizens. From this point of view, the explored data is de-
rived from changes, in contrast to changes derived from time-
dependent data. That is, instead of exploring changing data,
our tool supports the user in exploring data changes. We
embrace the fact that these data changes also need some
modelling through an iterative, closed-loop approach, which
allows users to improve modeling decisions in the course of
their exploration.
Our current approach scales as far as the database can
answer the queries in reasonable time. However, for larger
or streaming datasets there are possible improvements for
future work: The tool could use a customized backend stor-
age with appropriate index structures for the data model.
Furthermore, the user might often be satisfied with an ap-
proximate, but fast result and request the exact result only
when there is a real need for it. Similar to data ware-
houses, the more distant past often plays a less important
role. A change-cube could therefore be compressed through
lowering the resolution of the time or value dimension for
older changes. This compression must ensure that statistics
that combine data about compressed and non-compressed
changes still support the correct conclusions.
Acknowledgments. We thank Theodore Johnson and
Vladislav Shkapenyuk for their help in starting this project.
7. REFERENCES
[1] W. Aigner, S. Miksch, H. Schumann, and C. Tominski.
Visualization of time-oriented data. Springer Science
& Business Media, 2011.
[2] T. Bleifuß, L. Bornemann, T. Johnson, D. V.
Kalashnikov, F. Naumann, and D. Srivastava.
Exploring change - a new dimension of data analytics.
Proceedings of the VLDB Endowment (PVLDB),
12(2):85–98, 2018.
[3] L. Bornemann, T. Bleifuß, D. Kalashnikov,
F. Naumann, and D. Srivastava. Data change
exploration using time series clustering. Datenbank
Spektrum, 18(2):1–9, May 2018.
[4] U. Cetintemel, M. Cherniack, J. DeBrabant, Y. Diao,
K. Dimitriadou, A. Kalinin, O. Papaemmanouil, and
S. B. Zdonik. Query steering for interactive data
exploration. In Proceedings of the Conference on
Innovative Data Systems Research (CIDR), 2013.
[5] T. Dasu, T. Johnson, and A. Marathe. Database
exploration using database dynamics. IEEE Data
Engineering Bulletin, 29(2):43–59, 2006.
[6] T. Dasu, T. Johnson, S. Muthukrishnan, and
V. Shkapenyuk. Mining database structure; or, how to
build a data quality browser. In Proceedings of the
International Conference on Management of Data
(SIGMOD), pages 240–251, 2002.
[7] M. F. De Oliveira and H. Levkowitz. From visual data
exploration to visual data mining: a survey. IEEE
Transactions on Visualization and Computer
Graphics, 9(3):378–394, 2003.
[8] S. Idreos, F. Groffen, N. Nes, S. Manegold, K. S.
Mullender, and M. L. Kersten. MonetDB: Two
decades of research in column-oriented database
architectures. IEEE Data Eng. Bull., 35(1):40–45,
2012.
[9] S. Idreos, O. Papaemmanouil, and S. Chaudhuri.
Overview of data exploration techniques. In
Proceedings of the International Conference on
Management of Data (SIGMOD), pages 277–281,
2015.
[10] N. Kamat, P. Jayachandran, K. Tunga, and A. Nandi.
Distributed and interactive cube exploration. In
Proceedings of the International Conference on Data
Engineering (ICDE), pages 472–483, 2014.
[11] D. Mashima, S. Kobourov, and Y. Hu. Visualizing
dynamic data with maps. IEEE Transactions on
Visualization and Computer Graphics,
18(9):1424–1437, 2012.
[12] S. Sarawagi, R. Agrawal, and N. Megiddo.
Discovery-driven exploration of olap data cubes. In
Proceedings of the International Conference on
Extending Database Technology (EDBT), pages
168–182, 1998.
[13] K. Stein, R. Wegener, and C. Schlieder. Pixel-oriented
visualization of change in social networks. In
International Conference on Advances in Social
Networks Analysis and Mining (ASONAM), pages
233–240, 2010.
[14] C. Weaver. Cross-filtered views for multidimensional
visual analysis. IEEE Transactions on Visualization
and Computer Graphics, 16(2):192–204, 2010.
[15] M. Zaharia, M. Chowdhury, M. J. Franklin,
S. Shenker, and I. Stoica. Spark: Cluster computing
with working sets. HotCloud, 10(10-10):95, 2010.
[16] J. Zhao, F. Chevalier, and R. Balakrishnan.
KronoMiner: using multi-foci navigation for the visual
exploration of time-series data. In Proceedings of the
SIGCHI Conference on Human Factors in Computing
Systems, pages 1737–1746, 2011.
