
Creative Commons CC-BY-NC licence https://creativecommons.org/licenses/by-nc/4.0/
EM sensor array system and performance evaluation for inline
measurement of phase transformation in steel
H. Yang
1
, F.D. van den Berg
1
, C. Bos
1
, A. Luinenburg
1
, J. Mosk
1
,
P. Hunt
2
, M. Dolby
2
, J. Hinton
2
, A. J. Peyton
3
, C. L. Davis
4
1 Tata Steel, The Netherlands, [email protected]
2 Primetals Technologies, Christchurch, United Kingdom, [email protected]
3 University of Manchester, United Kingdom, a.pey[email protected]
4 University of Warwick, United Kingdom, [email protected]
Abstract
In a hot strip mill, the evolution of phase transformation in steel during the dynamic
cooling process on a run-out table has a significant effect on the microstructure and
mechanical properties of hot rolled materials and further processing in the subsequent
processing steps. An electromagnetic sensor array system, EMSpec
®
(ElectroMagnetic
Spectroscopy), has been developed for inline measurement of steel phase
transformation. The first industrialized system has been installed on the run-out table of
the hot strip mill #2 at Tata Steel in The Netherlands for industrial trials.
The EMSpec system consists of multiple sensor nodes located at different positions on
the run-out table. Each sensor node measures the impedance spectrum, from which the
amount of transformed phase fraction is determined based on a measurement model. All
the sensor nodes are calibrated for the delivery of proper sensor signals, such that
progressively increasing phase transformation of the steel strip travelling from one node
to the next can be correctly measured.
Besides the sensing principle and system calibration, this paper presents inline
measurement results, which are interpreted and compared with phase transformation
predictions from a physical thermodynamic and kinetic phase transformation model.
1. Introduction
Hot rolling is one of the most important processes for manufacturing steel strips. A
simplified hot rolling process is schematically depicted in Figure 1. A cast slab is first
reheated in a reheating furnace, enters a rougher mill and a multi-stand finishing mill for
thickness reduction, and subsequently the hot rolled strip goes through a cooling process
on the run-out table (ROT) before coiling [1]. The amount of water applied for the
cooling, together with the strip travelling speed, has to be properly controlled to achieve
the right microstructure that is required for further processing. Given a certain alloy
content, the microstructure is heavily determined by the evolution of the strip
temperature from finishing to coiling (which influences the evolution of austenite
More info about this article: http://www.ndt.net/?id=22784
2
decomposition and phase transformation on the ROT and the coiling process) as well as
the prior processing stages (for example recrystallisation and grain growth, which affect
the austenite grain size, morphology and stored energy, which affect transformation
kinetics).
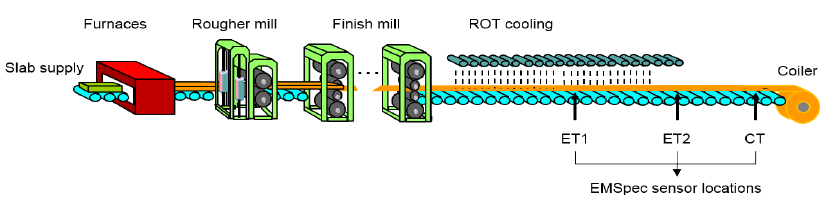
Figure 1. A simplified schematic diagram of hot strip mill rolling and ROT cooling process.
Multiple EMSpec sensors are installed between rolls in the ROT cooling zone to measure the
evolution of the phase transformation during the cooling process.
For the current practice, strip temperature measurements by optical pyrometers are used
as an indicator, together with thermodynamic and kinetic phase transformation models,
for the cooling process control. It is quite often that the phase transformation behaviour
is not well predicted by the models, especially for high-strength steels, either due to
incomplete knowledge and models for the change in the microstructure, or due to
insufficient or inaccurate information on the process and material conditions. This
underlines the need for an inline system for the measurement of the amount of
transformed phase evolving on the ROT.
An electromagnetic sensor array system, EMSpec
®
(ElectroMagnetic Spectroscopy),
has been developed for inline measurement of steel phase transformation. The principles
of phase transformation measurement using EM sensors were developed by the
Universities of Manchester and Warwick [2] and the EMSpec sensor was initially
prototyped by the University of Manchester and Tata Steel, and later industrialized by
Primetals Technology Limited (previously known as Siemens VAI) [3][4]. The first
industrialised system was installed in 2015 on the run-out table of the hot strip mill
(HSM) #2 at Tata Steel in IJmuiden in The Netherlands, as schematically shown in
Figure 1. Three sensor nodes were installed at different locations where pyrometers are
present: the first two sensors are at the intermediate positions ET1 and ET2, the third
one at the CT location before coiling. The sensor array system is robustly designed and
constructed to survive the harsh environment, whilst maintaining proper sensing
functionality.
Although each sensor head has been replicated to be the same, surrounding
environments, e.g. roller gaps, might not be exactly the same, depending on the
locations where sensor heads are installed. For this reason, calibration all the sensor
heads is necessary such that all the heads give the same measurement values for
material with the same EM properties. This makes sure that the progressively increasing
phase fractions can be accurately measured.
The rest of the paper is organised as follows. A brief introduction of the sensor design
and industrialisation will be presented in Section 2. In Section 3, the sensing principle,
measurement concept and sensor calibration will be explained. Next, the measurement
3
results will be compared to phase transformation predictions by a physical
thermodynamic and kinetic phase transformation model in Section 4. Finally,
conclusions will be drawn in Section 5.
2. Sensor design and industrialisation
For each sensor node, the core component is the “H” form yoke with excitation coil
winding on the centre bar and with sensing coils on the four legs. In addition to the
sensor yoke, auxiliary components are robustly designed and added in order to protect
the yoke against the harsh production environment on the run-out table in a hot strip
mill, where hot strips having a temperature in the range 500 – 800 C pass at speeds up
to 20 m/s, without hindering sensors functioning. The auxiliary components mainly
consist of a steel container, a ceramic hatch and a water cooled steel housing.
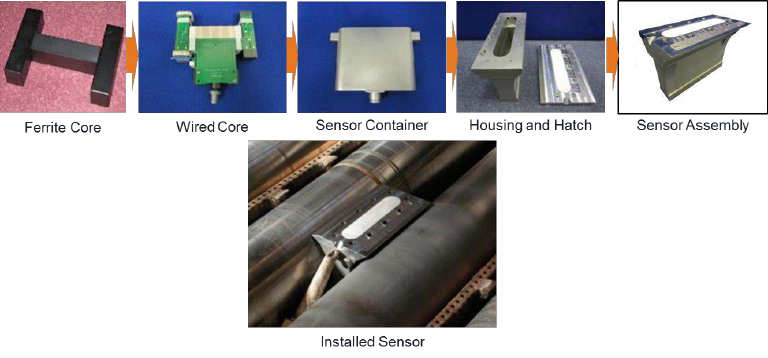
Figure 2 illustrates the internal assembly of the sensor [4][5]. The sensor yoke is first
encapsulated in the steel container and then mounted into the steel housing capped off
with the hatch. The steel container and the housing provide magnetic shielding from the
surrounding environment. The hatch is an integration of a steel frame and a ceramic
window, which not only gives protection from mechanical impact but also provides a
passage for the magnetic field that interacts with the hot steel above the hatch. The steel
housing and the hatch have been designed to have regulated water flow inside the
housing and a laminar flow around the sensor, which allows for optimal functioning of
the sensor head at a relatively stable temperature.
Figure 2. Mechanical assembly and installation of each sensor head on the run-out table.
The sensor head is mounted on a slider bar together with a pyrometer, which allows for
inline measurement of both strip temperature and phase transformation at the same time.
Thanks to its compact design, the whole assembly can be installed in the narrow gap (74
mm in our case) between transportation rolls. The easy retraction of the slider bar
allows convenient access for testing and maintenance of the system.
3. Sensing principle and sensor calibration
4
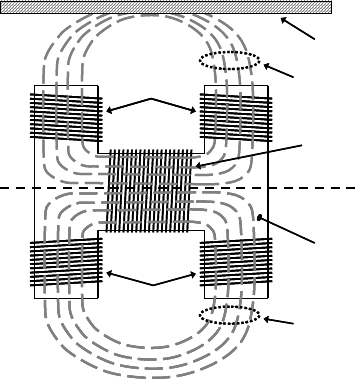
The core sensing component of each sensor node consists of a H-shaped ferrite yoke,
one excitation coil, one active sensing coil and one dummy sensing coil, as depicted in
Figure 3. The excitation coil runs simultaneously at multiple frequencies, which are
typically in the range from hundreds Hz to tens of kHz. The serial connection between
the active and dummy coils delivers a differential output, which is sensitive to the
presence of the steel above the active side thanks to the cancellation of imperfections
existing in the coil windings and electrical circuits. For each measurement, a complex
mutual inductance spectrum is calculated using a digital signal processor (DSP) based
on the fast Fourier transforms of the measured excitation current and induced voltage.
Figure 3. Each sensor node consists of ferrite yoke, excitation coil and sensing coils.
The basic principle of measuring the amount of transformation phase fraction is
schematically shown in Figure 4. Each inductance spectrum gives a finger print of the
microstructure corresponding to a certain amount of ferrite phase statistically mixed
with austenite phase. A zero-crossing frequency (ZCF), which is the frequency at which
the inductance goes to zero, is characterised by the effective electrical resistivity and
low field magnetic permeability of the steel strip under measurement [2]. The low field
magnetic permeability can be deduced from the ZCF and is used to determine the
amount of phase fraction by using effective medium theory.
The advantage of using the ZCF to determine the low field magnetic permeability is that
it is relatively insensitive to the variation of lift-off distance compared to the inductance
itself [6]. Here the lift-off refers to the distance between the sensor head and the steel
strip above the sensor. This is a particularly important feature for inline measurement on
the ROT in a HSM, where a fast travelling strip has always this sort of lift-off variation.
In addition to the establishment of the links between sensor output and the amount of
transformed phase fraction, the temperature dependencies of electrical resistivity and
low field magnetic permeability are also taken into account in the measurement models
[7]. Currently the system has been developed for the measurement of steel’s austenite-
ferrite phase transformation, which could be further extended for advanced high-
strength steels (AHSS).
Active
pickup coil
Dummy
pickup coil
Common
excitation coil
Active side
Dummy side
Active side
sensing flux
Target
Ferrite
core
Dummy side
sensing flux
Active
pickup coil
Dummy
pickup coil
Common
excitation coil
Active side
Dummy side
Active side
sensing flux
Target
Ferrite
core
Dummy side
sensing flux

5
Figure 4. The amount of ferrite phase in a two phase austenite and ferrite microstructure is linked
with steel’s low field magnetic permeability, which is deduced from the ZCF measured by the
inductance sensors. Examples here are shown for room temperature mixed austenite – ferrite
model microstructures [8].
For distributed sensing of phase transformation on the ROT, multiple sensors are
installed at different locations. All the sensor nodes have to be calibrated to deliver the
same low field magnetic permeability values, which are determined from the ZCFs, for
the same material with certain electrical and magnetic properties. This is required for
correct measurement of the progressively increasing phase transformation of the steel
strip travelling from one node to the next one over time.
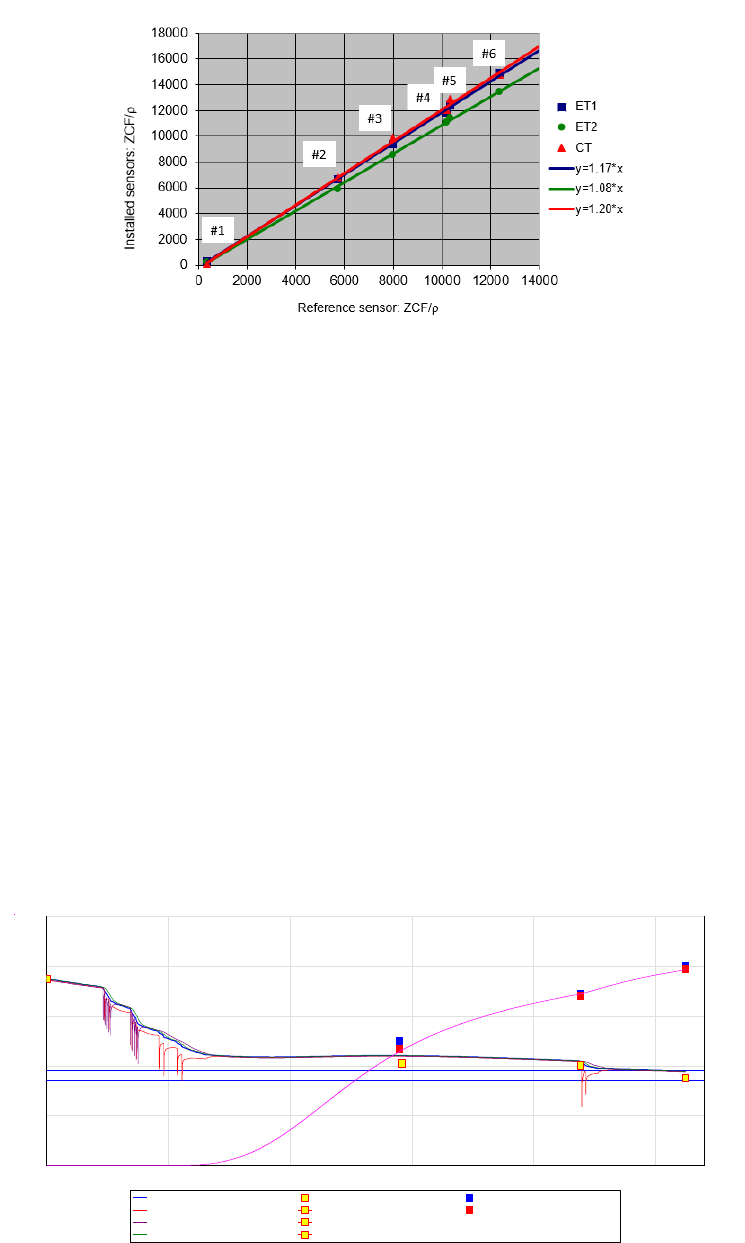
The calibration is carried out by measuring several materials, at room temperature,
which have a large spread of electrical and magnetic properties. For the three nodes
installed at the ET1, ET2 and CT locations on the run-out table in Figure 1, we have
measured the ZCF values for six different steel strips. The ratio between the ZCF and
the electrical resistivity (i.e. ZCF/) represents a scaling of the intrinsic magnetic
permeability and varies slightly from one sensor node to another. Figure 5 shows
ZCF/ of the three inline sensors against a reference sensor in the laboratory.
It is readily observed from the fittings in Figure 5 that the ZCF values of different
sensors are linearly related in the range examined. Therefore, with scaling factors of
individual nodes determined and applied in the sensor model, low field magnetic
permeability values can be properly delivered by all the sensor nodes and are
subsequently translated into a quantitative measurement of the amount of transformed
phase fraction, using the approach indicated in Figure 4.
6
Figure 5. For six steel strips #1 - #6, the ratios ZCF/
are measured by the three installed EMSpec
sensors and compared with a reference one.
4. Inline measurement results
With all the three EMSpec sensors calibrated, the amount of transformed phases from
austenite to ferrite on the ROT can be measured and delivered in real time. The inline
measured results are compared with calculated values by using thermodynamic and
kinetic phase transformation models.
For the purpose of illustration, Figure 6 gives an example of a single steel strip. This
figure shows measured temperatures by pyrometers (yellow square) and percentages of
the transformed phase by the EMSpec sensors (red square) at the three locations on the
ROT, which are compared to inline mill model predicted phase transformation (blue
square) and offline model calculated strip temperature (see labels in the plot) and phase
transformation (purple line). The blue squares concern the inline calculated amounts of
phase transformation at ET1, ET2 and CT. It is expected that the offline model gives
relatively more accurate calculations of phase transformation than the inline feed
forward model predictions, because the actual process information is fully collected
after coiling and fed into the offline model.
Figure 6. For a sample steel strip, calculated strip temperatures, including average, top/bottom
surfaces and strip centre temperatures, and phase transformation (the purple line: offline model;
blue squares: inline model) on the ROT using mill models. They are compared with measured
temperatures (yellow squares) and transformations (red squares) by EMSpec sensors at 3 locations.
Temperature and transformation along the ROT
Position in RunOutTable [m]
Temperature [°C]
%Transformed
125.00100.0075.0050.0025.000.00
1000.0
900.0
800.0
700.0
600.0
500.0 0.0
10.0
20.0
30.0
40.0
50.0
60.0
70.0
80.0
90.0
100.0
Average strip temperature [°C]
Top surface temperature [°C]
Bottom surface temperature [°C]
Strip center temperature [°C]
FT Measured [°C]
ET1 Measured [°C]
ET2 Measured [°C]
CT Measured [°C]
Transformation Predicted [%]
Transformation Measured [%]
Fraction Transformed [%]
7
One can see from the figure that with water applied for cooling control, the strip
temperature decreases and the amount of transformed phase is progressively increasing
when the strip moves from the finishing mill exit to the coiler on the run-out table. It is
evident from the comparison that the transformed phase fractions measured by the
EMSpec sensors and calculated by the off-line mill model are in good agreement.
Since the off-line calculated and inline measured temperatures at ET1, ET2 and CT are
also in good agreement, and the phase transformation generates heat which heats up the
strip, it can be concluded that the EMSpec sensors accurately measure the phase
transformation fractions at ET1, ET2 and CT for this sample steel strip.
In addition to the validation using the offline model, we have collected both EMSpec
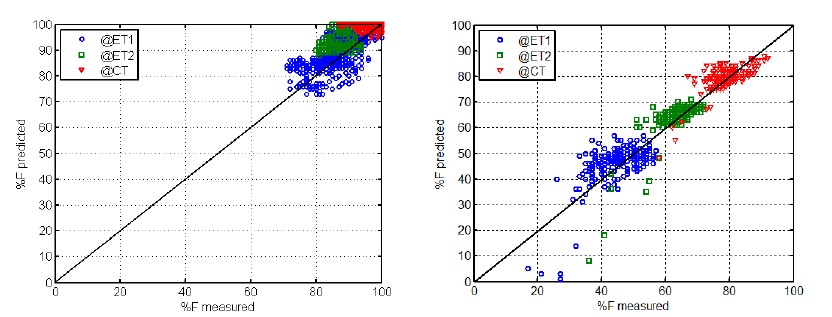
data and inline mill data for multiple steel coils. Figure 7(a) and (b) give the EMSpec
measurement versus the inline mill model predictions for coils with a carbon content
0.1%wt C and 0.15%wt C, respectively. One can see that the difference between
EMSpec measurements and inline mill model predictions is generally within 10%.
(a) 0.1%C (b) 0.15%C
Figure 7. Inline measured phase transformation by the EMSpec sensors versus inline mill model
predictions at the 3 sensor locations on the run-out table for sample steel coils with carbon content
0.1%C (a) and 0.15%C (b).
The results in Figure 7 also indicate that for a relatively small amount of carbon
content, the majority of the phase transformations in the strips occur in the early section
of the run-out table and hence the strips are in general fully transformed before coiling.
With the increase of carbon content, the majority of the phase transformations in the
strips tend to occur at locations shifting towards the coiler and there is an increasing
possibility of incomplete phase transformation on the run-out table before coiling. For
AHSS steels with higher alloy content, the evolution of microstructure on the ROT will
be more sensitive to the variations of processing parameters than conventional steels
and it becomes more challenging for the real-time mill model to predict the phase
transformation. Hence, inline measurement of phase transformation becomes even more
valuable. The results from the real-time EMSpec system can be used for a better
understanding on the variations of microstructures during the cooling process and for
improvements on thermodynamic and kinetic phase transformation models, which can
be used to refine the cooling strategies of these steels.
8
5. Conclusions
This paper has described an industrialised EMSpec sensing system, which is installed in
the run-out table in a hot strip mill for the real time measurement of steels phase
transformation during the controlled cooling process. The paper has explained the basic
sensing principle and the measurement concept of linking the electromagnetic sensors’
output to the amount of transformed phase fraction. In addition, the paper has presented
the procedure of calibrating multiple sensor nodes in order to measure accurately the
progressively increasing phase transformation when steel strips travel from one node to
the next before coiling.
Besides the sensing principle and system calibration, inline measurement results of the
sensor array system have been confirmed by model predictions from a physical
thermodynamic and kinetic phase transformation mill model. With increasing alloy
content and especially for advanced high strength steels, variations of microstructure
will be more sensitive to the processing conditions and it becomes more challenging for
accurate prediction of phase transformation on the run-out table using inline mill
models. Hence, the EMSpec system will be more valuable for real-time monitoring of
phase transformation. The results from the EMSpec sensor measurements can be used
for a better understanding on the variations of steels microstructure on the run-out table
and for the improvements of metallurgical models, which can be used to refine the
tuning of cooling strategies.
References
[1] VB. Ginzburg, Metallurgical Design of Flat Rolled Steels (Manufacturing Engineering and
Material Processing), Springer Science & Business, 2005
[2] W. Yin, X.J. Hao, A.J. Peyton, M. Strangwood and C.L. Davis, “Measurement of
permeability and ferrite/austenite phase fraction using a multi-frequency electromagnetic
sensor,” NDT&E Int., vol.42, pp.64-68, 2009
[3] W. Zhu, H. Yang, A. Luinenburg, F. vd Berg, S. Dickinson, W. Yin, AJ Peyton, “The
development and deployment of an on-line multi-frequency electromagnetic system to
monitor steel hot transformation on the run-out table of a hot strip mill”, Ironmaking and
Steelmaking 2014 Vol41 No.9 pp685-693
[4] P. Hunt, P. Sherman, AJ. Peyton, F. vd Berg and H. Yang, “The Real Time Transformation
Control at Hot Strip Mill”, METEC 2015, 16 – 19 June 2015, Düsseldorf Germany.
[5] F. vd Berg, H. Yang, J. Mosk, A. Peyton and P. Hunt, “Inline monitoring of phase
transformation in hot strip mill”, the 52
nd
Rolling Seminar in the ABM Week, Rio de
Janeiro, Brasil, Aug 2015.
[6] W. Yin, R. Binns, SJ. Dickinson, CL. Davis, AJ. Peyton, “Analysis of the Liftoff Effect of
Phase Spectra for Eddy Current Sensors”, IEEE Trans Instrum Meas, 56, 2775-2781 (2007)
[7] H. Yang, F. vd Berg, A. Luinenburg, C. Bos, G. Kuiper, J. Mosk, P. Hunt, M. Dolby, M.
Flicos, A. Peyton, C. Davis, “In-Line Quantitative Measurement of Transformed Phase
Fraction by EM Sensors during Controlled Cooling on the Run-Out Table of a Hot Strip
Mill”, 19th World Conference on Non-Destructive Testing 2016 (WCNDT-2016), paper
Mo_1_G_4.
[8] X J Hao, W Yin, M Strangwood, A J Peyton, P F Morris, C L Davis, ‘Modelling the
electromagnetic response of dual-phase microstructure of steels’ NDT&E International,
Vol 43, pp 305-315, 2010
