
Analysis of and recommendations for carbon field blank collection at
Chemical Speciation Network (CSN) sites
Final Report
Prepared by Mark C. Green
Desert Research Institute
2215 Raggio Parkway
Reno, NV 89512
Under Interagency Agreement: DW14923969
Prepared for:
Joann Rice
U.S. EPA
Office of Air Quality Planning and Standards
Research Triangle Park, NC 27711
December 23, 2014
1
Analysis of and recommendations for carbon field blank collection at Chemical
Speciation Network (CSN) sites
Recommendations
This analysis suggests that the best use of resources is to collect field blanks at a frequency of
10% at the 26 most representative 1/3 days sites and at a frequency of 20% at the 23 most
representative 1/6 day sites. This will result in lower average errors in “true” 1/3 and 1/6 day
median field blank levels at a reduced cost compared to collecting at 5% frequency at all sites.
Also, by not interpolating between months, maximum errors are much less when collecting at
field blank every month at a reduced number of sites.
Introduction and Methods
The IMPROVE and CSN networks have been considering how to best account for artifacts for
organic carbon due to the sampling on quartz fiber filters. IMPROVE has been using backup
filter concentrations to estimate artifacts and CSN has not yet adjusted organic carbon
concentrations to account for artifacts. Due mainly to the uncertainty of what the backup filter
carbon concentrations represent, the networks agreed to use field blank carbon concentrations
to account for the artifact. CSN is currently collecting field blank carbon data at all 174 sites
supported by the national laboratory contract on a 10% frequency and is considering reducing
the frequency to 5% in January 2015. This study considers the errors in network monthly
median field blank concentration by using reduced numbers of sites. Considerable cost savings
can result if number of sites collecting field blanks can be reduced. Also considered is the
collection of field blanks at 5% frequency at all sites, versus reducing the number of sites, but
keeping the frequency at 10% for one-in-three day sites and increasing to 20% at one-in-six day
sites.
CSN is also collecting backup filters for carbon analysis at all sites at a 5% frequency. Because
these data will not be used for artifact correction, they will no longer be collected. The CSN will
stop collecting carbon backup filters in January 2015. Only field blanks are considered in this
analysis.
The EPA has proposed defunding of 44 sites starting January 2015. This would leave 80 one-in-
three days and 52 one-in-six day sites under the EPA national laboratory contract. These sites
are the only sites considered in this analysis of selecting a reduced number of sites for future
carbon field blank collection.
2
Network of CSN sites using the URG-3000N samplers
Beginning in 2007 the CSN network began to phase-in the URG-3000N carbon sampler and the
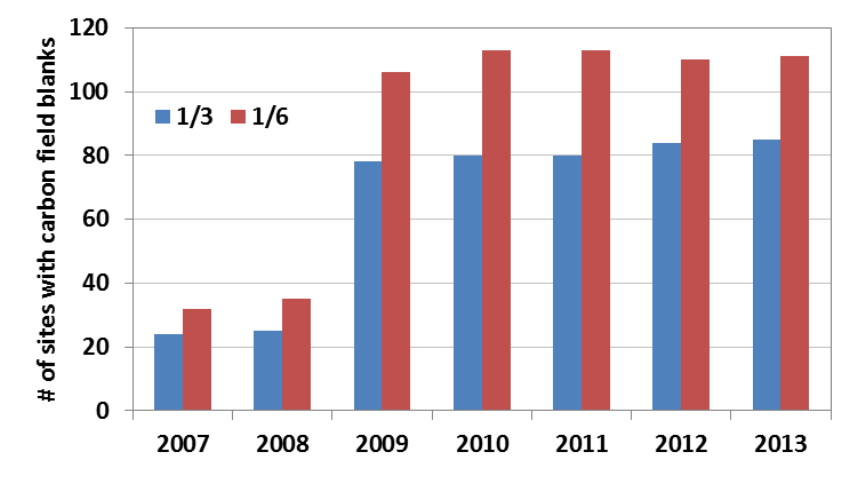
IMPROVE_A analysis method for collecting carbon (OC and EC) for the CSN. Figure 1 shows the
number of sites with valid carbon field blank data for one-in-three day and one-in-six day sites.
Figure 1. Number of CSN sites with valid carbon field blank data by year and sample collection
frequency using URG-3000N samplers.
There were relatively few sites in 2007 and 2008 and by the end of 2009 the network was
nearly completely converted to the new carbon method. The frequency of field blank collection
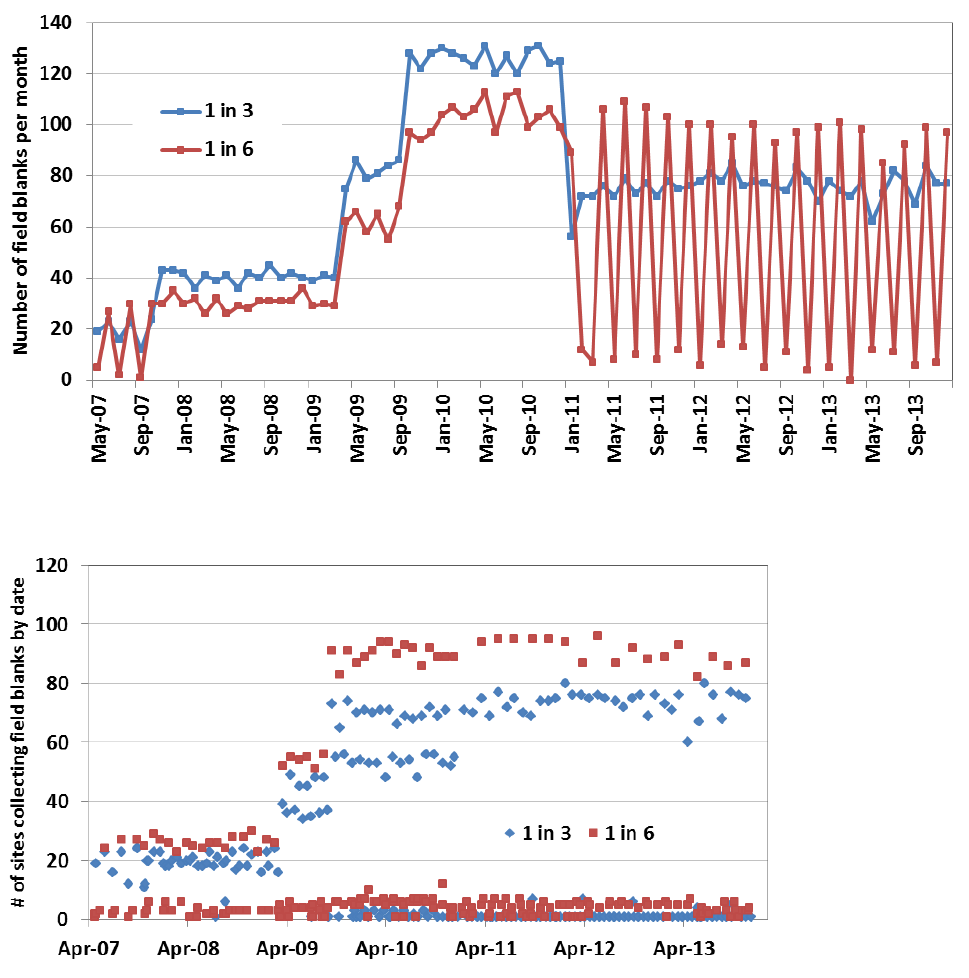
was 20% of filters for 2007-2010 and then 10% from 2011-2013. Table 1 and Figure 2 shows the
number of one-in-three (1/3) and one-in-six (1/6) days field blanks collected by month. The
year 2010 had the greatest number of field blanks because: 1) the network was essentially
completely converted; and 2) field blanks were collected for 20% of the sample days and then
reduced to 10%. Prior to 2011 the one-in-three and one-in-six day sites had a similar total
number of field blanks collected, the reduced frequency of sample collection for the one-in-six
day sites being nearly offset by the larger number of sites than for one-in-three day sampling.
For 2011-2013, the 1/3 day sites had similar number of samples each month while the 1/6 day
sites had alternating high and low collection numbers.
In general for 20% field blank collection, the 1/3 sites should usually have 24 samples per year
(2 per month) and the 1/6 sites 12 samples per year (one per month). At 10% sampling the 1/3
sites will usually have one sample per month and the 1/6 sites one sample every other month.
Therefore, every other month should have no field blank samples for the 1/6 sites for the 2011-

3
2013 period. However, Figure 2 shows that most months had at least a few field blank samples.
Most of the samples in months with few 1/6 field blanks were collected by the state of Texas,
California and Oregon which are not funded under the national laboratory contract. Figure 3
shows in the number of field blanks collected by individual date for 1/3 and 1/6 sites.
Table 1. Number of one-in-three and one-in-six day sites with carbon field blanks 2007-2013.
Year Jan Feb Mar Apr May Jun Jul Aug Sep Oct Nov Dec total
2007 24 50 18 53 13 54 73 78 363
3 19 23 16 23 12 24 43 43 203
6 5 27 2 30 1 30 30 35 160
2008 72 68 67 71 67 65 70 71 76 71 73 76 847
3 42 36 41 39 41 36 42 40 45 40 42 40 484
6 30 32 26 32 26 29 28 31 31 31 31 36 363
2009 68 71 69 137 152 137 146 139 154 225 216 225 1739
3 39 41 40 75 86 79 81 84 86 128 122 128 989
6 29 30 29 62 66 58 65 55 68 97 94 97 750
2010 234 235 229 229 244 217 238 233 228 234 230 224 2775
3 130 128 126 123 131 120 127 120 129 131 124 125 1514
6 104 107 103 106 113 97 111 113 99 103 106 99 1261
2011 145 84 79 182 80 188 83 184 80 181 87 176 1549
3 56 72 72 76 72 79 73 77 72 78 75 76 878
6 89 12 7 106 8 109 10 107 8 103 12 100 671
2012 84 181 92 180 89 178 82 169 85 180 82 169 1571
3 78 81 78 85 76 78 77 76 74 83 78 70 934
6 6 100 14 95 13 100 5 93 11 97 4 99 637
2013 83 175 72 176 74 158 93 170 75 183 84 174 1517
3 78 74 72 78 62 73 82 78 69 84 77 77 904
6 5 101 98 12 85 11 92 6 99 7 97 613
total 686 814 608 975 730 993 730 1019 711 1128 845 1122 10361
4
Figure 2. Number of one-in-three and one-in-six day carbon field blank samples by month using URG
3000N samplers.
Figure 3. Number of field blanks collected by date at 1/3 and 1/6 day sites.
Monthly median field blank carbon at the 1/3 and 1/6 day sites
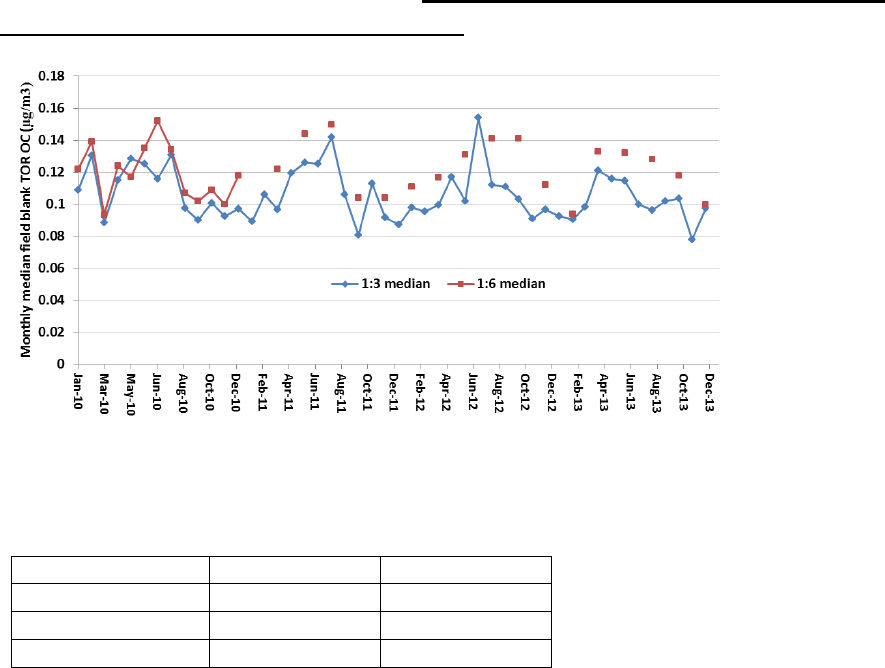
Because the recommended metric for adjusting for carbon artifact is the monthly median field
blank it is considered next. Also, because the network was not complete until 2010, remaining
analyses will use the years 2010-2013. Figure 4 shows the monthly median field blank TOR OC
concentration by month (2010-2013) for 1/3 and 1/6 sites. Due to the less frequent sampling
for the 1/6 sites, every other month from 2011-2013 had very few 1/6 samples. Only months
5
with at least 20 data points are plotted; therefore, after December 2010, data is mostly plotted
only every other month. It can be noted that the 1/6 site monthly median field blank TOR OC is
nearly always higher than for the 1/3 sites. This suggests consideration of having separate
artifact correction values for 1/3 and 1/6 sites.
Figure 4. Monthly median field blank TOR OC for 1/3 and 1/6 sites.
Average values of monthly median TOR OC and TOT OC for field blanks are shown below.
Sample frequency
TOR OC (µg/m
3
)
TOT OC (µg/m
3
)
1/3
0.1061
0.1063
1/6
0.1211
0.1215
1/6-1/3 difference
0.0150
0.0152
Difference in average monthly median field blank OC for 1/3 and 1/6 days sites was 15 ng/m
3
for both TOR OC and TOT OC. The difference between average TOR and TOT field blank OC was
0.2 ng/m
3
for 1/3 sites and 0.4 ng/m
3
for 1/6 sites. The correlation coefficient between
monthly median field blank TOR and TOT OC was >0.999 for both 1/3 and 1/6 sites. For all
months the median field blank TOR and TOT EC was zero. From here on only field blank TOR is
considered.
Consideration of minimum number of sites needed for future field blank correction
Now the number of sites needed to well represent the network median field blank OC TOR is
considered. Separate analyses are done for 1/3 and 1/6 day sites because of the higher average
values observed at 1/6 day sites. The analysis considers only the 80 one-in-three day and 52
one-in-six day sites expected to be sampling under the national contract. The analysis uses the
years 2010-2013 because the network was essentially completely converted to the new carbon
method in 2010 and data is complete through 2013.
6
Of the 80 one-in-three day sites expected to be sampling in 2015 62 sites had “good” data
collection (at least 45 samples out of a nominal 60) for the 2010-2013 period. These 62 sites
(Table 2) are considered for a reduced number of future sites that will well represent the
network median. It is assumed that if a group of sites represented the network median in the
past four years, they will continue to do so in the future.
Of the 52 recommended one-in-six day sites for 2105, a subset of 45 sites (Table 3) with “good”
data collection (at least 24 field blanks collected out of a nominal 30) are considered for
continued field blank collection.
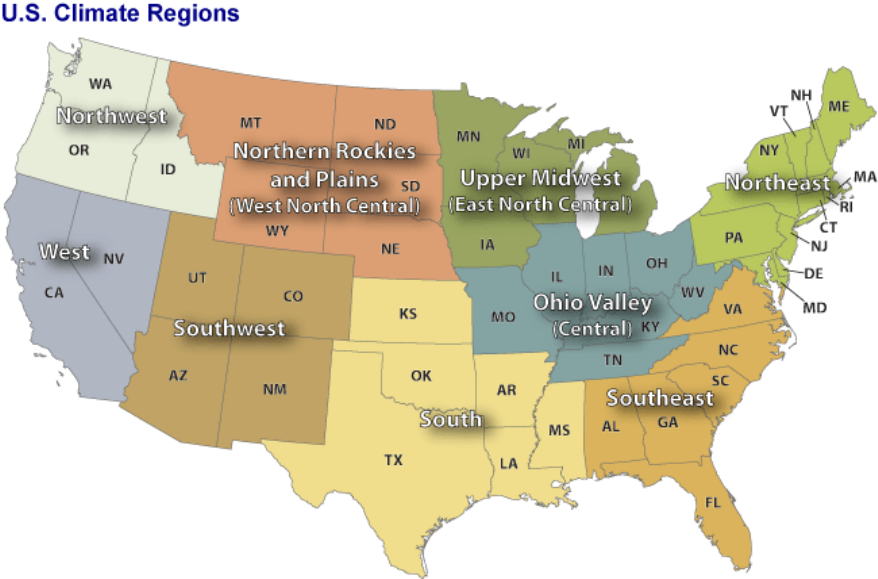
The EPA wishes to continue with at least one blank collection site in each geographic region
and suggested using NOAA defined regions (Figure 5). All analyses for 1/3 and 1/6 sites
required keeping at least one site per NOAA Climate Region and one in Alaska and Hawaii, if
available.
Figure 5. NOAA Climate Regions (Karl and Koss, 1984).
For this analysis for each of the 62 (1/3 sites) and 45 (1/6 sites) retained, the monthly error,
defined as the monthly difference between the value(s) for a site and the full network median
was calculated. The network median was calculated for sites that are expected to be funded
under the national contract for 2015. Then the root-mean-square error (RMSE) for a site is
calculated by squaring the error for each month, summing over all months, dividing by the

7
number of months and taking the square root. Sites were then selected in order of lowest to
highest RMSE.
For the 1/3 days sites four scenarios are considered:
1) Continue collecting at all 62 sites;
2) Collect FBs at only the 11 sites representing the 9 NOAA regions + Alaska and Hawaii,
using the site in each region with lowest RMSE;
3) Collect FBs at the 11 regional sites plus the next 10 sites with lowest RMSE (21 sites
total); or
4) Collect FBs at the 11 regional sites plus the next 15 sites with lowest RMSE (26 sites
total).
For the 1/6 sites four scenarios considered are:
1) Collect FBs at all 45 sites;
2) Collecting only at the 8 sites representing 8 of the 9 NOAA regions, using the site in each
region with lowest RMSE;
3) Collect FBs at the 8 regional sites above plus the next 10 sites with lowest RMSE (18
sites total); or
4) Collect FBs at the 8 regional sites above plus the next 15 sites with lowest RMSE (24
sites total).
Results
One-in-three day sites
Sites selected for possible continued field blank collection are shown in Table 2.
Table 2. Site ID, region, state and local site name for one-in-three day sites considered for future field
blank collection. Regions are NOAA Climate regions and are shown in Figure 5. Also shown are root-
mean-square errors (rmse) and whether the sites had rmse’s that were the regional best, or the 10 or
15 sites in order of lowest rmse after the regional best sites. Y=yes, N=no.
AQS ID
site name
state
Region
reg
best
reg+
10
reg+
15
rmse
34-039-0004
Elizabeth Lab
NJ
NE
Y
Y
Y
0.037
48-201-1039
Deer Park
TX
S
Y
Y
Y
0.039
12-011-1002
U. of FL Ag. School Site
FL
SE
Y
Y
Y
0.043
19-163-0015
Jefferson Elementary
IA
ENC
Y
Y
Y
0.043
31-055-0019
Woolworth Street
NE
WNC
Y
Y
Y
0.044
02-090-0010
Fairbanks State Bldg
AK
AK
Y
Y
Y
0.052
35-001-0023
Del Norte
NM
SW
Y
Y
Y
0.059

8
6-019-0011
Fresno
CA
W
Y
Y
Y
0.061
39-061-0040
Cincinnati - Taft
OH
C
Y
Y
Y
0.065
41-05100080
Portland - SE Lafayette
OR
NW
Y
Y
Y
0.079
15-003-0010
Kapolei
HI
HI
Y
Y
Y
0.096
55-079-0026
SER-DNR Headquarters
WI
ENC
N
Y
Y
0.045
05-119-0007
North Little Rock (NLR) Parr
AR
S
N
Y
Y
0.045
50-007-0012
Zampieri State (Burlington)
VT
NE
N
Y
Y
0.046
24-033-0030
HU-Beltsville
MD
NE
N
Y
Y
0.050
48-113-0050
Chamizal
TX
S
N
Y
Y
0.051
22-033-0009
Capitol
LA
S
N
Y
Y
0.052
24-005-3001
Essex
MD
NE
N
Y
Y
0.053
48-113-0050
Hinton (Dallas)
TX
S
N
Y
Y
0.061
25-025-0042
Dudley Square - Roxbury
MA
NE
N
Y
Y
0.061
38-017-1004
Fargo NW
ND
WNC
N
Y
Y
0.070
51-087-0014
Henrico Co. (Richmond)
VA
SE
N
N
Y
0.071
34-023-0006
New Brunswick
NJ
NE
N
N
Y
0.073
06-073-0003
El Cajon
CA
W
N
N
Y
0.074
32-031-0016
Reno
NV
W
N
N
Y
0.074
36-101-0003
Pinnacle State Park
NY
NE
N
N
Y
0.074
04-013-9997
Phoenix Supersite
AZ
SW
N
N
N
0.076
29-510-0085
St. Louis - Blair Street
MO
C
N
N
N
0.077
40-143-1127
Peoria 1127 - North Tulsa FS 24
OK
S
N
N
N
0.078
49-035-3006
Salt Lake City - Hawthorne
UT
SW
N
N
N
0.078
36-081-0124
Queens College
NY
NE
N
N
N
0.078
13-089-0002
South Dekalb
GA
SE
N
N
N
0.086
01-073-0023
North Birmingham
AL
SE
N
N
N
0.090
36-055-1007
Rochester Primary
NY
NE
N
N
N
0.092
29-099-0019
Arnold West
MO
C
N
N
N
0.096
37-119-0041
Garinger High School
NC
SE
N
N
N
0.101
54-039-0011
WV - Guthrie Ag. Center
WV
C
N
N
N
0.102
06-085-0005
San Jose - Jackson Street
CA
W
N
N
N
0.104
16-00100010
St Lukes Meridian
ID
NW
N
N
N
0.105
09-009-0027
Criscuolo Park
CT
NE
N
N
N
0.106
21-111-0067
Louisville - Cannon's Lane
KY
C
N
N
N
0.107
06-065-8001
Riverside - Rubidoux
CA
W
N
N
N
0.108
06-067-0006
Sacramento - Del Paso Manor
CA
W
N
N
N
0.109
55-027-0001
Horicon Palmatory
WI
ENC
N
N
N
0.110
17-03100076
Chicago - Com Ed
IL
C
N
N
N
0.110
36-001-0005
Albany Co HD
NY
NE
N
N
N
0.110
06-029-0014
Bakersfield - California Ave.
CA
W
N
N
N
0.110
25-013-0008
Westover AFB (Chicopee)
MA
NE
N
N
N
0.115
42-003-0008
South Alleghany (Liberty)
PA
NE
N
N
N
0.124
53-033-0080
Seattle - Beacon Hill
WA
NW
N
N
N
0.125
26-163-0001
Allen Park
MI
ENC
N
N
N
0.144
9
18-097-0078
Indianapolis - Washington Park
IN
C
N
N
N
0.145
26-081-0020
Grand Rapids
MI
ENC
N
N
N
0.148
36-061-0134
New York - Division Street
NY
NE
N
N
N
0.149
27-053-0963
Minneapolis - Philips
MN
ENC
N
N
N
0.153
37-183-0014
East Millbrook Middle School
NC
SE
N
N
N
0.160
11-001-0043
Washington DC - McMillan Res.
DC
NE
N
N
N
0.166
12-057-0002
Sydney (Tampa)
FL
SE
N
N
N
0.169
06-037-1103
Los Angeles - North Main St.
CA
W
N
N
N
0.177
39-035-0060
G.T. Craig
OH
C
N
N
N
0.185
46-099-0008
South Alleghany (Liberty)
PA
NE
N
N
N
0.190
20-209-0021
JFK Center
KS
S
N
N
N
0.192
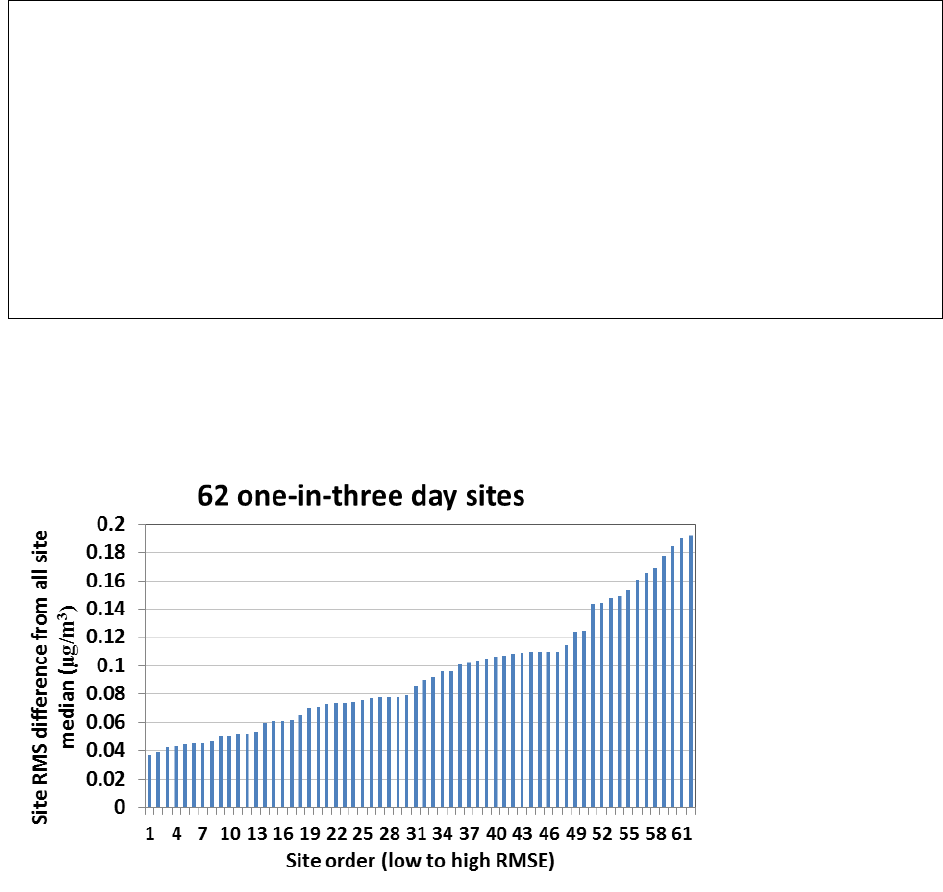
Figure 6 shows the distribution of RMSE for the 62 sites selected for possible future field blank
collection. RMSE ranges from less than 0.04 µg/m
3
to 0.19 µg/m
3
.
Figure 6. Distribution of RMSE for 62 “good” 1/3 day sites.
Figure 7 shows the monthly median field blank OC for each selected group of sites: all
continuing sites with some data from 2010-2013; the 62 sites with “good” data recovery; the
11 sites with the regional lowest RMSE; the regional best sites + next 10 sites with lowest RMSE
and regional best + next 15 sites with lowest RMSE. The 62 “good” sites track the all sites
median well with little difference. The monthly differences increase with fewer sites used.

10
Figure 7. Monthly median field blank OC by each group of 1/3 sites, 2010-2013.
Figure 8 shows the absolute value of monthly error in calculated network field blank median
using a reduced number of sites for each alternative site scenario. Errors increase as site
numbers decrease.
Figure 8. Absolute value of monthly error in median field blank OC by group of sites, 2010-2013.
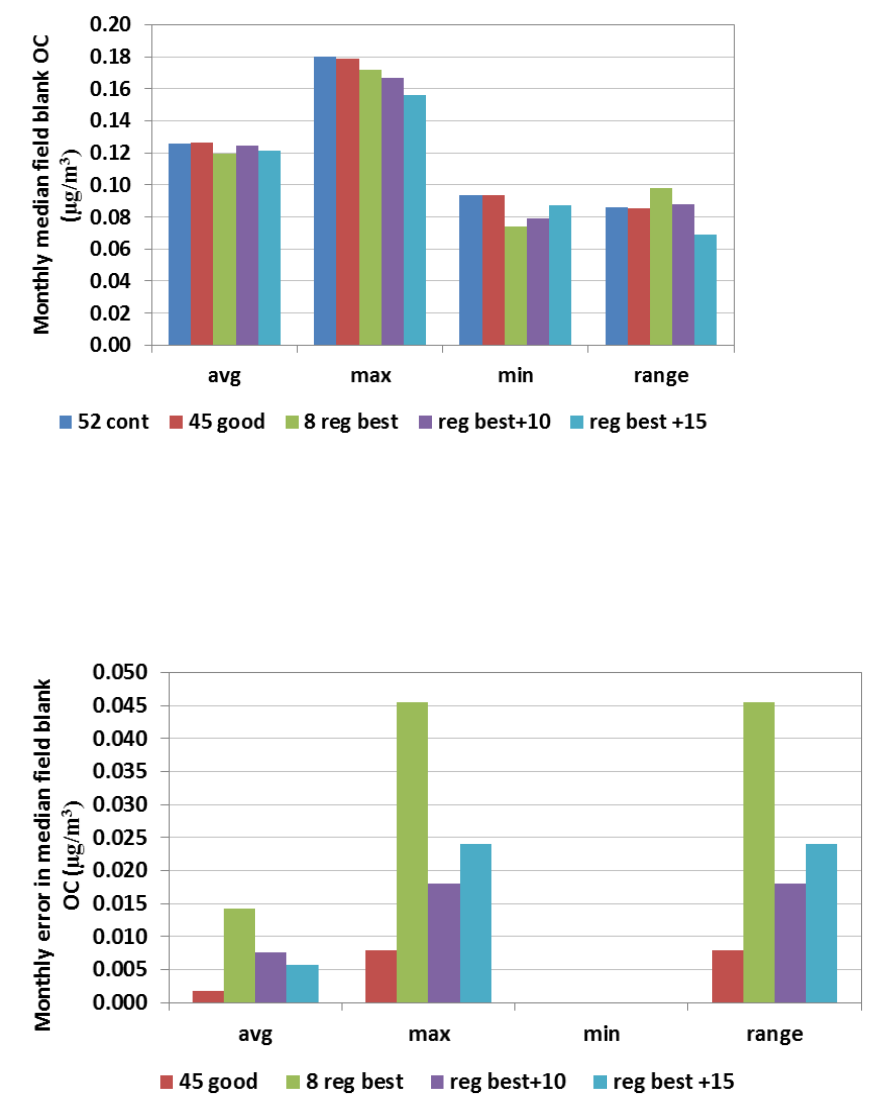
Figure 9 shows the average, maximum, minimum and range of field blank OC for each grouping
of sites. Average is close for each grouping of sites, indicating little bias for each group. The
smallest group, “regional best” shows the highest maximum and lowest minimum monthly
average field blank concentration. It also shows the greatest range in monthly median
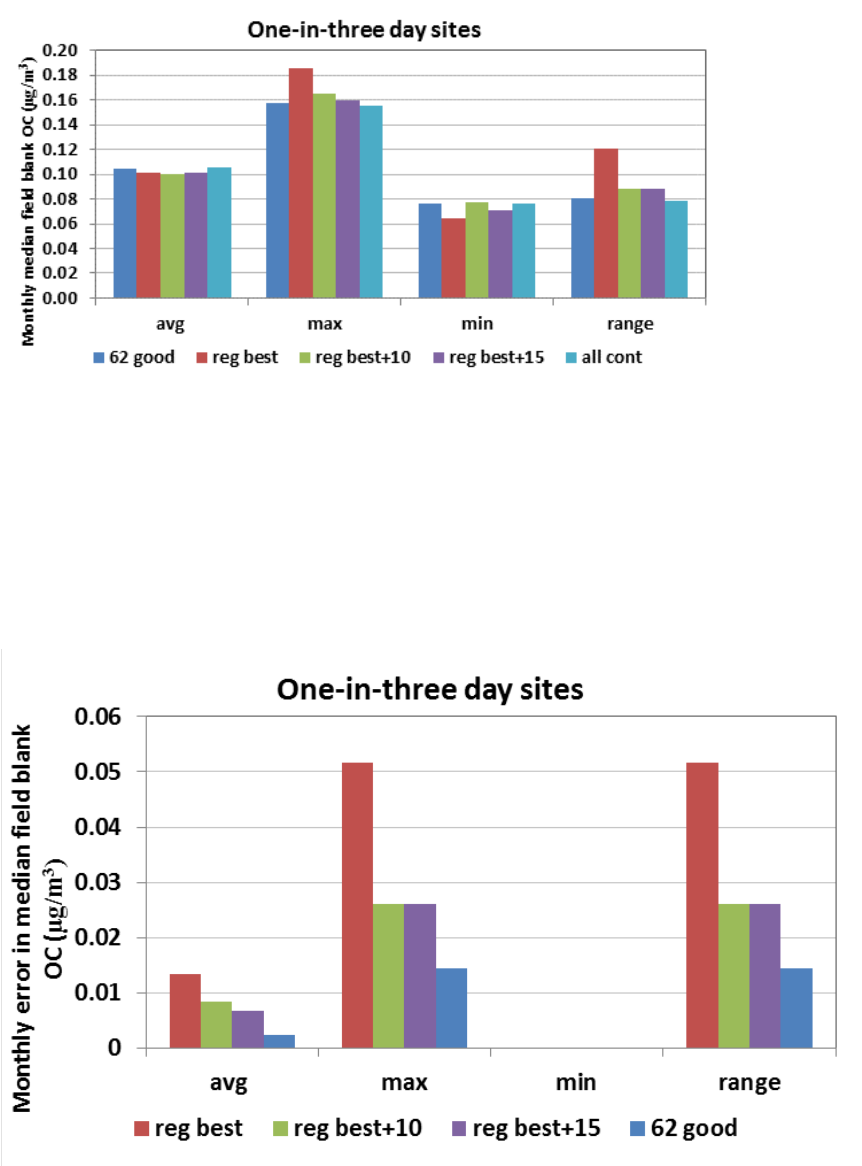
11
concentrations. The full set of continuing sites with data shows the lowest range in monthly
median concentrations.
Figure 9. Average, maximum, minimum and range of field blank OC for each grouping of sites
Figure 10 shows the statistics for the absolute value of the monthly error in network median
field blank OC for each site grouping scenario. The absolute value of the error is notably higher
when using only the 11 regional best sites. The average error for the regional best + 15 sites is
slightly lower than for the regional best + 10 sites. Using all 62 “good” sites well represents the
network total for continuing sites.

12
Figure 10. Average, maximum, minimum, range and median absolute error in median monthly field
blank OC by 1/3 day site grouping.
One-in-six day sites
Sites selected for possible continued field blank collection are shown in Table 3. It should be
noted that for the 1/6 day sites after 2010, field blank data is available for only every other
month. Thus the current collection at 10% frequency does not allow for a determination of
monthly median field blank correction for months where they were not collected. Some other
method, such as interpolation between months or more frequent sampling of field blanks is
required to obtain a monthly correction. This will be addressed in more detail later.
Table 3. Site ID, region, state and local site name for one-in-three day sites considered for
future field blank collection. Regions are NOAA Climate regions and are shown in Figure 5.
There are no continuing 1/6 day sites in the West region (California and Nevada). Also shown
are whether the sites had root-mean-square errors that were the regional best, or the 10 or
15 sites in order of lowest RMSE after the regional best sites. Y=yes, N=no.
AQS ID
Site name
State
Region
Reg
best
Reg+
10
Reg +
15
rmse
13-115-0003
Rome - Elementary School
GA
SE
Y
Y
Y
0.032
49-011-0004
Bountiful
UT
SW
Y
Y
Y
0.035
18-065-0003
Shenandoah HS- Mechanicsburg
IN
C
Y
Y
Y
0.039
55-119-8001
Perkinstown CASTNET
WI
ENC
Y
Y
Y
0.043
42-021-0011
Johnstown
PA
NE
Y
Y
Y
0.044
48-203-0002
Karnack
TX
S
Y
Y
Y
0.047
53-061-1007
Marysville-7th Ave
WA
NW
Y
Y
Y
0.064
30-093-0005
Butte-Greeley School
MT
WNC
Y
Y
Y
0.068
17-043-4002
Naperville
IL
C
N
Y
Y
0.040
01-113-0001
Phenix City
AL
SE
N
Y
Y
0.042
13-295-0002
Rossville
GA
SE
N
Y
Y
0.048
39-113-0032
Downtown Library
OH
C
N
Y
Y
0.049
13-245-0091
Augusta
GA
SE
N
Y
Y
0.050
08-123-0008
Platteville
CO
SW
N
Y
Y
0.057
37-067-0022
Winston-Salem - Hattie Ave
NC
SE
N
Y
Y
0.058
22-015-0008
Shreveport Airport
LA
S
N
Y
Y
0.060
26-163-0015
Southwest High School
MI
ENC
N
Y
Y
0.064
39-153-0023
Akron - 5 Points
OH
C
N
Y
Y
0.065
42-003-0064
South Alleghany (Liberty)
PA
NE
N
N
Y
0.068
40-109-1037
OCUSA Campus
OK
S
N
N
Y
0.070
42-071-0007
Lancaster
PA
NE
N
N
Y
0.071
17-119-0024
Granite City - (Missouri)
IL
C
N
N
Y
0.070
18-037-2001
Jasper Post Office
IN
C
N
N
Y
0.072
13
42-101-0055
Philadelphia - Ritner
PA
NE
N
N
N
0.075
20-173-0010
Wichita Dept. of Environ. Health
KS
S
N
N
N
0.076
17-031-0057
Chicago - Springfield PS
IL
C
N
N
N
0.078
47-093-1020
Knoxville - Spring Hill ES
TN
SE
N
N
N
0.079
49-049-4001
Lindon
UT
SW
N
N
N
0.080
18-163-0021
Evansville - Buena Vista Rd
IN
C
N
N
N
0.083
26-163-0033
Dearborn
MI
ENC
N
N
N
0.087
12-073-0012
Tallahassee Community College
FL
SE
N
N
N
0.089
13-021-0007
Macon
GA
SE
N
N
N
0.092
42-129-0008
Greensburg
PA
NE
N
N
N
0.092
13-215-0011
Columbus
GA
SE
N
N
N
0.094
18-019-0006
Jeffersonville/Walnut street
IN
C
N
N
N
0.094
39-151-0017
Canton Fire Station
OH
C
N
N
N
0.096
42-095-0025
Freemansburg
PA
NE
N
N
N
0.104
36-029-0005
Buffalo
NY
NE
N
N
N
0.106
18-089-0022
Gary
IN
C
N
N
N
0.113
42-125-5001
East of Pittsburgh- Florence
PA
NE
N
N
N
0.118
26-091-0007
Tecumseh
MI
ENC
N
N
N
0.126
39-093-3002
Lorain
OH
C
N
N
N
0.167
53-053-0029
Tacoma
WA
NW
N
N
N
0.185
42-029-0100
New Garden
PA
NE
N
N
N
0.234
42-001-0001
NARSTO (Arendtsville)
PA
NE
N
N
N
0.248
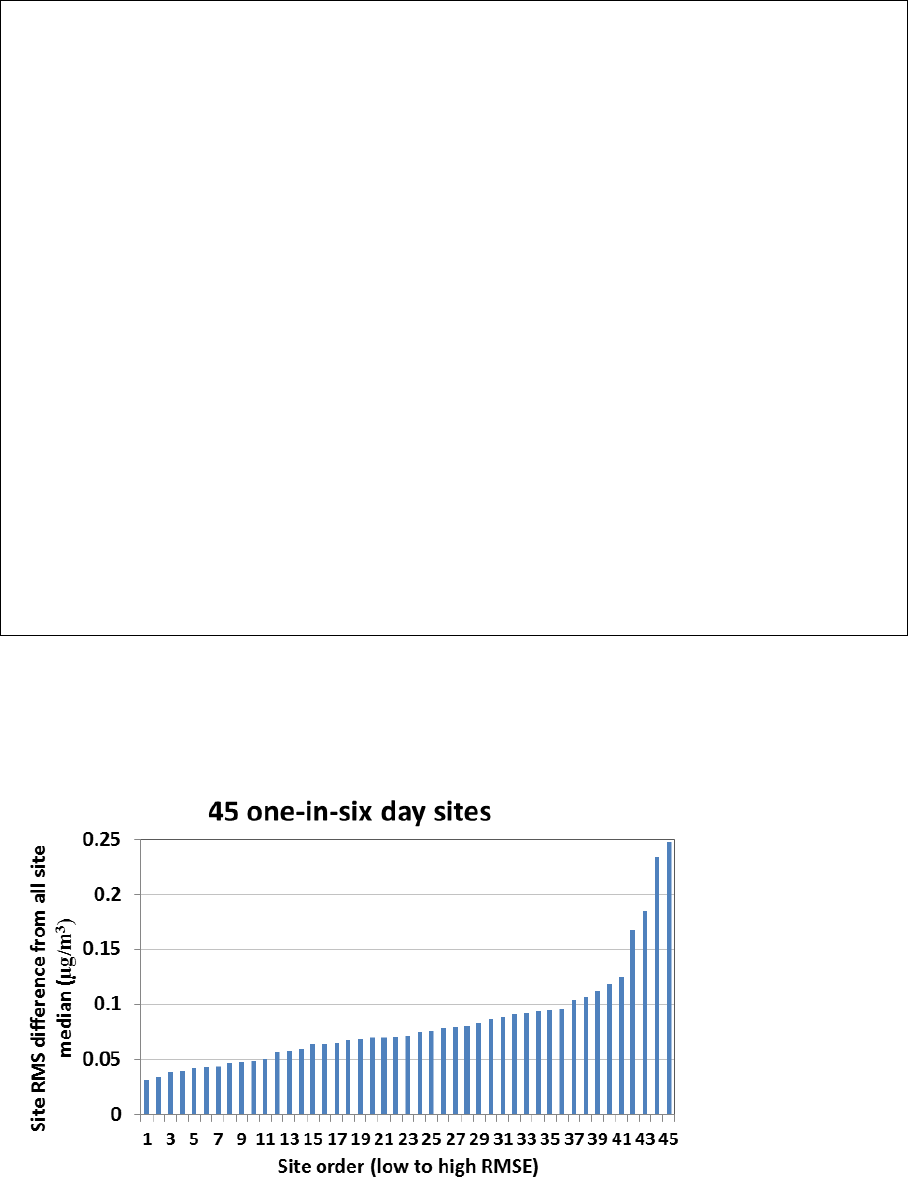
Figure 11 shows the distribution of RMSE for the 45 sites selected for possible future field blank
collection. RMSE ranges from 0.03 µg/m
3
to 0.25 µg/m
3
.
Figure 11. Distribution of RMSE for 45 “good” 1/6 day sites.
14
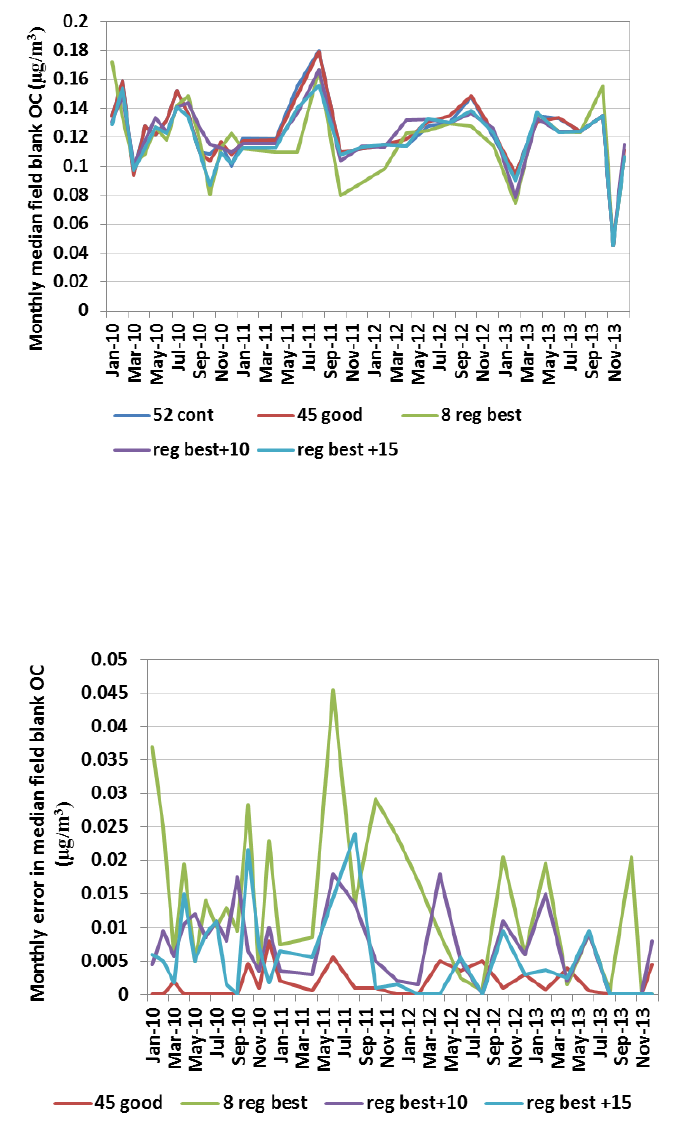
Figure 12 shows the monthly median field blank OC by month for each grouping of sites.
Figure 12. Monthly median field blank OC by month for each grouping of 1/6 day sites.
Figure 13 shows the absolute value of the monthly error in median field blank OC for each
group of sites.
Figure 13. Absolute value of the monthly error in field blank OC for each group of 1/6 day sites.
15
Figure 14 shows the average, maximum, minimum and range in monthly median field blank O
for each group of sites.
Figure 14. Average, maximum, minimum and range in monthly median field blank O for each group of
1/6 day sites.
Figure 15 shows statistics for the absolute value of monthly error in median field blank OC by
site grouping. The average error decreases as the site number increases.
Figure 15. Average, maximum, minimum, range and median absolute error in median monthly field
blank OC by 1/6 day site grouping.

16
Tabular representation of the data from Figures 9-10 (one-in-three day sites) is shown below.
Monthly median field blank OC (µg/m
3
) for each group of sites.
all cont
62 good
reg best
reg best +10
reg best +15
avg
0.105
0.104
0.101
0.101
0.101
max
0.155
0.157
0.185
0.165
0.159
min
0.077
0.077
0.064
0.077
0.071
range
0.078
0.080
0.121
0.088
0.088
Absolute value of error in monthly median field blank (µg/m
3
) for each group of sites.
62 good
reg best
reg best +10
reg best +15
avg
0.0024
0.0134
0.0084
0.0067
max
0.015
0.052
0.026
0.026
min
0.000
0.000
0.000
0.000
range
0.015
0.052
0.026
0.026
Tabular representation of the data from Figures 14-15 (one-in-six day sites) is shown below.
Monthly median field blank OC (µg/m
3
) for each group of sites.
52 cont
45 good
8 reg best
reg best +10
reg best +15
avg
0.126
0.126
0.120
0.125
0.121
max
0.180
0.179
0.172
0.167
0.156
min
0.094
0.093
0.074
0.079
0.087
range
0.086
0.086
0.098
0.088
0.069
Absolute value of error in monthly median field blank (µg/m
3
) for each group of sites.
45 good
8 reg best
reg best +10
reg best +15
avg
0.0018
0.0143
0.0076
0.0057
max
0.0080
0.0455
0.0180
0.0240
min
0
0
0
0
Range
0.008
0.046
0.018
0.024
Relative errors for calculating median field blank OC from a reduced number of sites versus a
reduced frequency of collection.
The analysis so far has only addressed how well a reduced number of sites can estimate the
network monthly median field blank OC. It has not considered the error introduced by not
17
having regular field blank collection for all months. Since 2010 this has been the case for the
one-in-six day sites, with sampling only every other month (one every 60 days at 10%
frequency). If the field blanks were changed to 5% sampling frequency as proposed, the one-
in-three days sites would have data only every other month and the one-in-six day sites only
every fourth month.
An obvious question is whether it is preferable to have less frequent field blank collection at all
sites or more frequent collection at a reduced number of sites.
One-in-three day sites:
For the one-in-three day sites, the analysis is straightforward because there is field blank data
for all months for the 2010-2013 period. Errors in monthly median field blank OC from using a
reduced number of sites can be compared to errors from using a reduced collection frequency
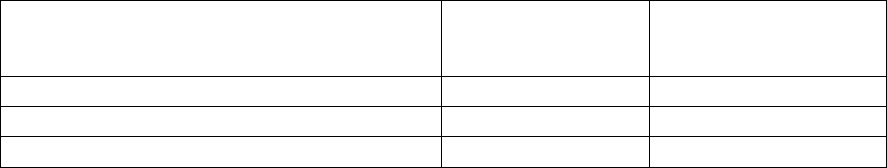
by eliminating every other month of data. Figure 16 shows absolute error in monthly median
field blank OC by using linear interpolation to simulate collection at 5% frequency (every other
month), error for the regional best + 15 sites (26 sites at 10% frequency), and error for the
regional best +29 sites (40 sites total at 10% frequency). The regional best + 29 sites would
require the same number of field blank samples as the full network of 80 sites would at a 50%
reduction in frequency (10% to 5%). The 5% collection frequency case gives higher maximum
monthly errors but similar average monthly error to the reduced site cases (see the table
below).
Option
Average error
(µg/m
3
)
Maximum error
(µg/m
3
)
5% frequency, 80 sites
0.063
0.038
10% frequency, 26 sites
0.067
0.026
10% frequency, 40 sites
0.059
0.019
Based on this analysis, for the one-in-three day sites using a reduced number of sites at a higher
frequency of sample collection gives a (slightly) lower error for a given number of samples
collected and analyzed.
18
Figure 16. Error in one-in-three day sites monthly median field blank OC for three cases: 1)
interpolation between every other month, simulating 5% collection; 2) regional best +15 sites at 10%
frequency; 3) regional best + 29 sites at 10% frequency.
One-in-six day sites:
For the one-in-six day sites errors at the current 10% sampling frequency are due to not
sampling every month, but every other month. Additional errors arise if the sampling
frequency is reduced to 5% which would give data only every fourth month. The additional
error going from 10% to 5% field blank collection frequency can be addressed by using the
2010-2013 data and removing ¾ of the monthly median data for 2010 (20% frequency) and ½
the monthly median data for 2011-2013.
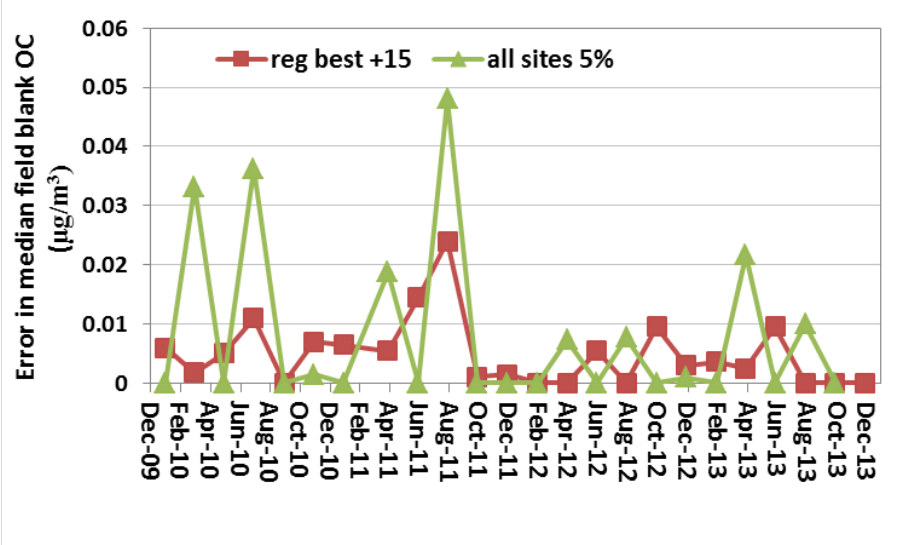
The results are shown in the table below and in Figure 17. Collecting field blanks at all sites but
at 5% frequency increases the error more than reducing the site number, except for keeping
only the 8 regional best sites. Maximum errors at 5% frequency are greater than maximum
errors for other cases, including keeping only the 8 regional best sites.
45 good
8 reg best
reg best+10
reg best +15
all sites 5%
average
0.0017
0.0127
0.0073
0.0049
0.0084
max
0.0055
0.0455
0.0180
0.0240
0.0480
19
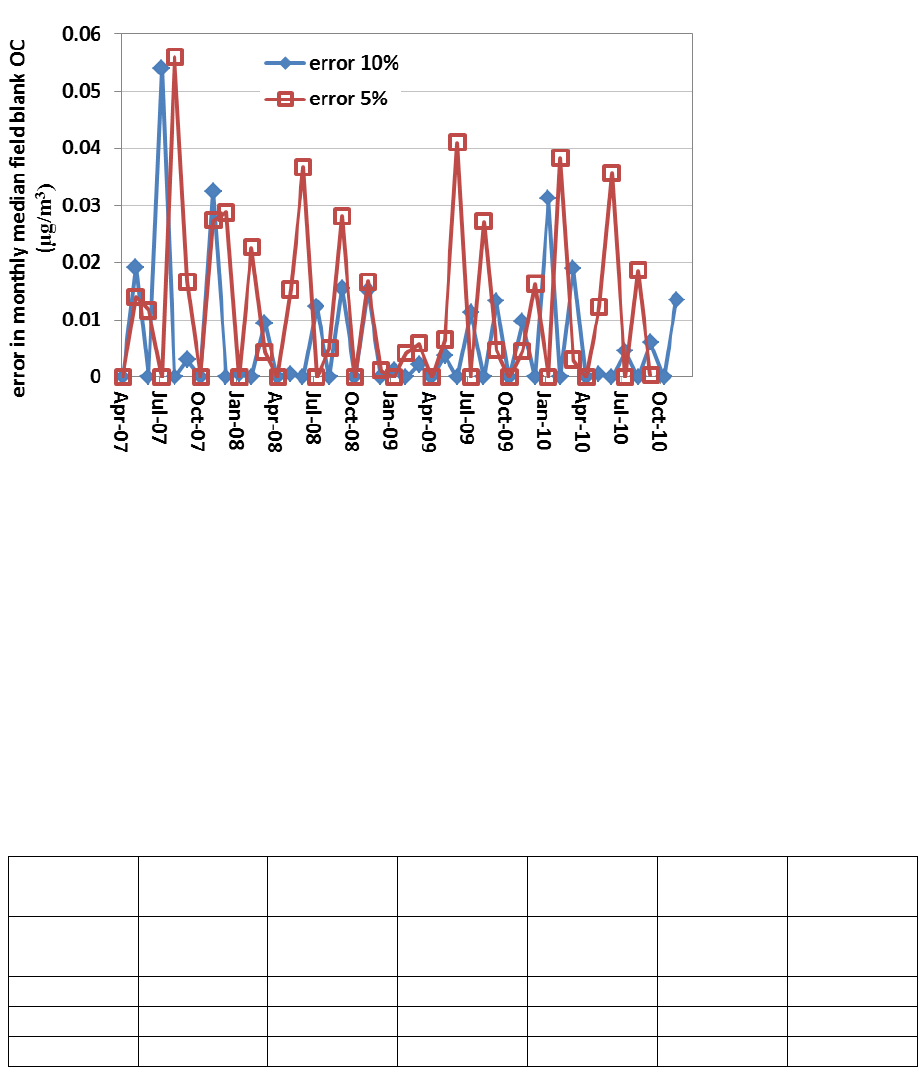
Figure 17. Error in on-in-six day sites monthly median field blank OC for the regional best +15 sites
(10% frequency) and for all sites reduced to 5% collection frequency. Note that this error is only for
the months that have field blanks collected at the 10% frequency.
Errors in the one-in-six day monthly median may be reduced by returning to a 20% field blank
collection frequency, so that monthly medians are available every month. Errors in going from
20% blank collection to 5% can be estimated by considering the period November 2007-January
2011 when there were field blanks collected every month at 1:6 day sites (20% frequency). This
can be done by reducing the data to blanks collected one in 4 months (5% frequency) and
linearly interpolating for in-between months. Reducing 20% to 10% gives an error of 0.0053
µg/m
3
; reducing to 5% gives an error of 0.0112 µg/m
3
. For the year 2010 only and using only
sites that will be continued in 2015, the corresponding errors are 0.0062 µg/m
3
and 0.0124
µg/m
3
. A time series plot of the errors associated with a reduced sampling frequency of 10 and
5 % compared to a 20% frequency is shown in Figure 18.
20
Figure 18. Error in monthly median 1/6 days field blank OC when reducing frequency from 20% to
10% and 5%.
Table 4 compares estimated errors in median field blank values for the regional best + 10,
regional best +15, and all sites at 5%. Also noted are the total number of field blanks collected
for each case.
Table 4. Number of annual field blanks and estimated error (µg/m
3
) in network wide field
blank median OC concentration for regional best +10 and regional best +15 cases, 1:6 and 1:3
sites. For the 1:6 regional best + 10 and regional best + 15 cases, 20% collection frequency is
assumed.
# annual
fb
# annual
fb
# annual
fb
at 5% all
sites
error 5%
reg best
+10
error reg
best+10
reg best
+15
error reg
best+15
1:6
158
0.012
219
0.0073
280
0.0055
1:3
487
0.0062
256
0.0075
316
0.0062
total FB
645
475
596
Recommendations
The analysis suggests that the best use of resources for field blank collection is to collect 10%
frequency at the 26 most representative 1/3 days sites and at a 20% frequency at the 23 most
representative 1/6 day sites. This will result in lower average errors in “true” 1/3 and 1/6 day
21
median field blank levels at a reduced cost compared to collecting at 5% frequency at all sites.
Also, by not interpolating between months, maximum errors are much less when collecting
every month at a reduced number of sites.
References
Thomas R. Karl and Walter James Koss, 1984: "Regional and National Monthly, Seasonal, and
Annual Temperature Weighted by Area, 1895-1983." Historical Climatology Series 4-3, National
Climatic Data Center, Asheville, NC, 38 pp.
