U.S. Department of the Interior
U.S. Geological Survey
Scientific Investigations Report 2012–5139
Prepared in cooperation with the California State Water Resources Control Board
A product of the California Groundwater Ambient Monitoring and Assessment (GAMA) Program
Evaluation of Volatile Organic Compound (VOC) Blank Data
and Application of Study Reporting Levels to Groundwater
Data Collected for the California GAMA Priority Basin
Project, May 2004 through September 2010
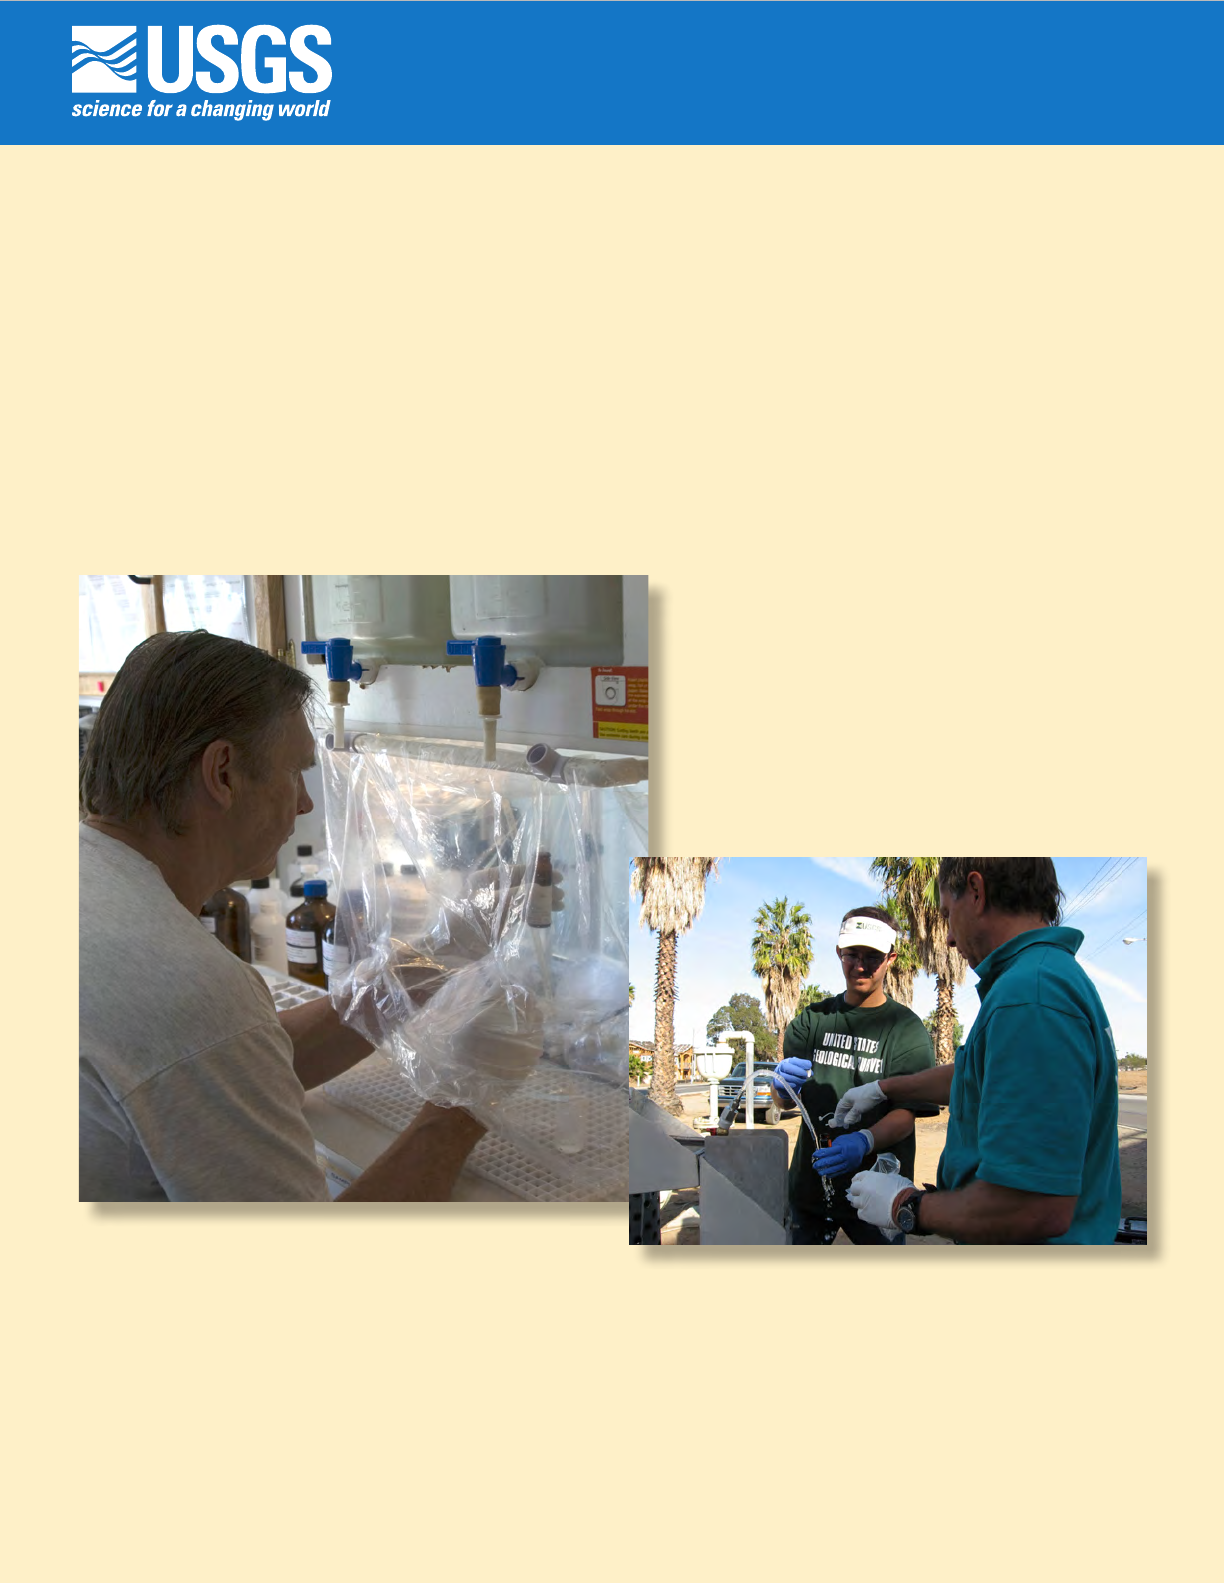
Cover:
Left: Field crew member collecting VOC samples inside a mobile laboratory using
long sampling lines. (Photograph by Cathy M. Munday, U.S. Geological Survey.)
Right: Field crew members collecting VOC samples at a well site using short
sampling lines. (Photograph by Michael T. Land, U.S. Geological Survey.)
Evaluation of Volatile Organic Compound (VOC)
Blank Data and Application of Study Reporting
Levels to Groundwater Data Collected for the
California GAMA Priority Basin Project,
May 2004 through September 2010
By Miranda S. Fram, Lisa D. Olsen, and Kenneth Belitz
A product of the California Groundwater Ambient Monitoring and Assessment
(GAMA) Program
Prepared in cooperation with the California State Water Resources Control Board
Scientific Investigations Report 2012–5139
U.S. Department of the Interior
U.S. Geological Survey

U.S. Department of the Interior
KEN SALAZAR, Secretary
U.S. Geological Survey
Marcia K. McNutt, Director
U.S. Geological Survey, Reston, Virginia: 2012
For more information on the USGS—the Federal source for science about the Earth, its natural and living
resources, natural hazards, and the environment, visit http://www.usgs.gov or call 1–888–ASK–USGS.
For an overview of USGS information products, including maps, imagery, and publications,
visit http://www.usgs.gov/pubprod
To order this and other USGS information products, visit http://store.usgs.gov
Any use of trade, product, or firm names is for descriptive purposes only and does not imply endorsement by the
U.S. Government.
Although this report is in the public domain, permission must be secured from the individual copyright owners to
reproduce any copyrighted materials contained within this report.
Suggested citation:
Fram, M.S., Olsen, L.D., and Belitz, Kenneth, 2012, Evaluation of volatile organic compound (VOC) blank data and
application of study reporting levels to groundwater data collected for the California GAMA Priority Basin Project,
May 2004 through September 2010: U.S. Geological Survey Scientific Investigations Report 2012–5139, 94 p.
iii
Contents
Abstract ...........................................................................................................................................................1
Introduction ....................................................................................................................................................2
Use of Study Reporting Levels ............................................................................................................4
Philosophy of Quality-Control Evaluation of Blanks ........................................................................5
Purpose and Scope .............................................................................................................................6
Methods Used to Collect and Evaluate VOC Data ....................................................................................7
Field Methods ........................................................................................................................................7
Groundwater Samples ................................................................................................................7
Blanks .........................................................................................................................................10
Laboratory Methods ...........................................................................................................................11
Data Analysis Methods ......................................................................................................................14
Identification of Representative Field Blanks .......................................................................15
Definition of Study Reporting Levels (SRLs) ..........................................................................16
Binomial Probability Approach .......................................................................................16
Maximum Concentration Approach ..............................................................................18
Maximum LT-MDL Approach ..........................................................................................18
Evaluation of Potential Sources of Contamination to Blanks and Groundwater
Samples and Selection of Appropriate SRLs ....................................................................18
Statistical Tests Used in Identification of Representative Field Blanks and Evaluation
to Infer Potential Sources of Contamination ....................................................................19
Quality-Control Assessment Results ........................................................................................................20
Identification of VOCs for Which the SRL Approach Can be Applied and of
Representative Quality-Control Field Blanks (QCFBs) for Use in Calculation
of SRLs ....................................................................................................................................20
Minimal Contamination from the Certified Blank Water .....................................................20
Acetone, 2-Butanone, and Tetrahydrofuran Contamination Associated with
Methanol ........................................................................................................................20
Inadvertent Field Test of Contamination by Methanol ................................................20
Acetone, 2-Butanone, and Tetrahydrofuran Contamination in Field Blanks...........26
Acetone, 2-Butanone, and Tetrahydrofuran Contamination in Groundwater
Samples ................................................................................................................26
SRLs for Acetone, 2-Butanone, and Tetrahydrofuran.................................................31
Differences Between Sample-Collection Equipment Configurations ...............................31
Quality-Control Field Blanks (QCFBs) .....................................................................................32
iv
Contents—Continued
Quality-Control Assessment Results—Continued
Evaluation of Potential Sources of Contamination, Selection of SRLs, and Application
of SRLs to Groundwater Data for VOCs Detected in Blanks ..........................................32
Hydrocarbons .............................................................................................................................32
Ethylbenzene, m- and p-Xylenes, o-Xylene, Benzene, and Styrene ........................32
Inferred Mechanisms of Contamination .............................................................38
SRLs for Ethylbenzene, m- and p-Xylenes, o-Xylene, Benzene, and
Styrene .........................................................................................................40
Toluene ...............................................................................................................................45
Inferred Mechanisms of Contamination ..............................................................45
SRL for Toluene ........................................................................................................48
1,2,4-Trimethylbenzene ....................................................................................................48
Inferred Mechanisms of Contamination ..............................................................50
SRL for 1,2,4-Trimethylbenzene .............................................................................53
Chlorinated Organic Solvents ..................................................................................................54
Dichloromethane, 1,1-Dichloroethene, and Trichloroethene ....................................54
Tetrachloroethene ............................................................................................................54
Other VOCs ..................................................................................................................................54
Bromodichloromethane and Trichlorofluoromethane ................................................54
Carbon Disulfide ................................................................................................................61
Inferred Source of Contamination ........................................................................61
SRL for Carbon Disulfide .........................................................................................61
Chloroform .........................................................................................................................63
Inferred Source of Contamination ........................................................................63
SRL for Chloroform ..................................................................................................63
Application of SRLs and Maximum LT-MDLS ..........................................................................................65
Effect of LT-MDL Changes on VOC Detection Frequencies .........................................................65
LT-MDLs and Probabilities of False-Positive Detections .............................................................67
Assessment of Methods Used for Determining Study Reporting Levels ...........................................67
Summary and Conclusions .........................................................................................................................69
Acknowledgments .......................................................................................................................................71
References Cited..........................................................................................................................................71
Appendix........................................................................................................................................................74
v
Figures
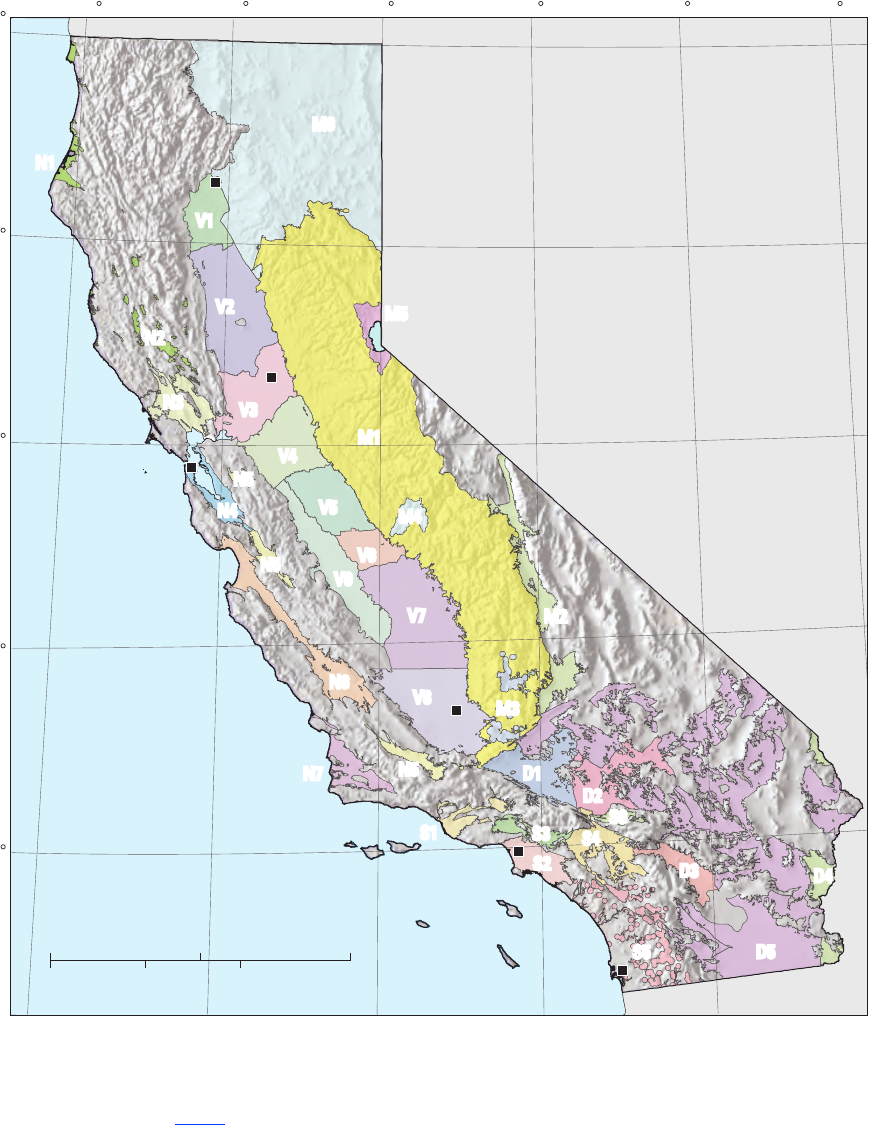
Figure 1. Map of the 32 study units sampled for the California GAMA Priority Basin
Project, May 2004 through September 2010 ……………………………………… 3
Figure 2. Graphs showing number of groundwater samples and field and source-solution
blanks collected per month by the California GAMA Priority Basin Project, and
number of laboratory instrument blanks analyzed per month for volatile organic
compounds by the USGS National Water Quality Laboratory, May 2004 through
September 2010 …………………………………………………………………… 8
Figure 3. Graphs comparing detection frequencies in field blanks collected at production
wells by the National Water-Quality Assessment (NAWQA) Program and
detection frequencies in all field blanks collected with long and short sampling
lines by the GAMA Priority Basin Project, and quality-control field blanks
collected with long and short sampling lines and inferred to be without
contamination by the methanol used to clean field equipment …………………… 22
Figure 4. Chromatograms for three vials of a field blank affected by methanol,
California GAMA Priority Basin Project, June 25, 2007 …………………………… 25
Figure 5. Time-series graph for concentrations of acetone detected in field blanks,
source-solution blanks, laboratory instrument blanks, and groundwater
samples, California GAMA Priority Basin Project, May 2004 through
September 2010 …………………………………………………………………… 27
Figure 6. Time-series graph for concentrations of 2-butanone detected in field blanks,
source-solution blanks, laboratory instrument blanks, and groundwater
samples, California GAMA Priority Basin Project, May 2004 through
September 2010 …………………………………………………………………… 28
Figure 7. Time-series graph for concentrations of tetrahydrofuran detected in field blanks,
source-solution blanks, laboratory instrument blanks, and groundwater
samples, California GAMA Priority Basin Project, May 2004 through
September 2010 …………………………………………………………………… 29
Figure 8. Time-series graph for concentrations of ethylbenzene detected in field blanks,
source-solution blanks, laboratory blanks, and groundwater samples, California
GAMA Priority Basin Project, May 2004 through September 2010 ……………… 33
Figure 9. Time-series graph for concentrations of m- and p-xylenes detected in field
blanks, source-solution blanks, laboratory blanks, and groundwater samples,
California GAMA Priority Basin Project, May 2004 through September 2010 …… 34
Figure 10. Time-series graph for concentrations of o-xylene detected in field blanks,
source-solution blanks, laboratory blanks, and groundwater samples, California
GAMA Priority Basin Project, May 2004 through September 2010 ……………… 35
Figure 11. Time-series graph for concentrations of benzene detected in field blanks,
source-solution blanks, laboratory blanks, and groundwater samples, California
GAMA Priority Basin Project, May 2004 through September 2010 ……………… 36
Figure 12. Time-series graph for concentrations of styrene detected in field blanks,
source-solution blanks, laboratory blanks, and groundwater samples, California
GAMA Priority Basin Project, May 2004 through September 2010 ……………… 37
Figure 13. Relations between m- and p-xylenes and ethylbenzene, o-xylene, styrene,
benzene, toluene, and 1,2,4-trimethylbenzene detected in field blanks,
source-solution blanks, and groundwater samples, California GAMA Priority
Basin Project, May 2004 through September 2010 ……………………………… 39
vi
Figure 14. Graph showing concentrations of study reporting levels (SRLs) established
from field blanks collected for the California GAMA Priority Basin Project,
May 2004 through September 2010, and SRLs established from field blanks
collected at production wells for the National Water-Quality Assessment
(NAWQA) Program ……………………………………………………………… 46
Figure 15. Time-series graph for concentrations of toluene detected in field blanks,
source-solution blanks, laboratory blanks, and groundwater samples,
California GAMA Priority Basin Project, May 2004 through September 2010 …… 47
Figure 16. Time-series graph for concentrations of 1,2,4-trimethylbenzene detected in
field blanks, source-solution blanks, laboratory blanks, and groundwater
samples, California GAMA Priority Basin Project, May 2004 through
September 2010 …………………………………………………………………… 49
Figure 17. Bar charts showing relations between detection frequencies of
1,2,4-trimethylbenzene in groundwater samples and blanks and whether or not
samples for analysis of radon-222 were collected at the same site or previous
site, and which GAMA field vehicle visited the site, California GAMA Priority
Basin Project, May 2004 through September 2010 ……………………………… 51
Figure 18. Time-series graph for concentrations of dichloromethane detected in field
blanks, source-solution blanks, laboratory blanks, and groundwater samples,
California GAMA Priority Basin Project, May 2004 through September 2010 …… 55
Figure 19. Time-series graph for concentrations of 1,1-dichloroethene detected in field
blanks, source-solution blanks, laboratory blanks, and groundwater samples,
California GAMA Priority Basin Project, May 2004 through September 2010 …… 56
Figure 20. Time-series graph for concentrations of tetrachloroethene detected in field
blanks, source-solution blanks, laboratory blanks, and groundwater samples,
California GAMA Priority Basin Project, May 2004 through September 2010 …… 57
Figure 21. Time-series graph for concentrations of trichloroethene detected in field
blanks, source-solution blanks, laboratory blanks, and groundwater samples,
California GAMA Priority Basin Project, May 2004 through September 2010 …… 58
Figure 22. Time-series graph for concentrations of bromodichloromethane detected in
field blanks, source-solution blanks, laboratory blanks, and groundwater
samples, California GAMA Priority Basin Project, May 2004 through
September 2010 …………………………………………………………………… 59
Figure 23. Time-series graph for concentrations of trichlorofluoromethane detected in
field blanks, source-solution blanks, laboratory blanks, and groundwater
samples, California GAMA Priority Basin Project, May 2004 through
September 2010 …………………………………………………………………… 60
Figure 24. Time-series graph for concentrations of carbon disulfide detected in field
blanks, source-solution blanks, laboratory blanks, and groundwater samples,
California GAMA Priority Basin Project, May 2004 through September 2010 …… 62
Figure 25. Time-series graph for concentrations of chloroform detected in field blanks,
source-solution blanks, laboratory blanks, and groundwater samples, California
GAMA Priority Basin Project, May 2004 through September 2010 ……………… 64
Figure 26. Bar charts showing percentages of groundwater samples in concentration
range categories for different long-term method detection levels (LT-MDLs) for
chloroform and tetrachloroethene ……………………………………………… 66
Figures—Continued
vii
Tables
Table 1. Study unit names, sampling dates, Data Series Reports, and sampling
schedules, California GAMA Priority Basin Project, May 2004 through
September 2010 …………………………………………………………………… 4
Table 2. Long-term method detection levels (LT-MDLs) used by the U.S. Geological
Survey National Water Quality Laboratory for volatile organic compounds
(VOCs), and VOCs detected in groundwater samples and source-solution or
field blanks, California GAMA Priority Basin Project, May 2004 through
September 2010 …………………………………………………………………… 12
Table 3. Identification of steps in collection, handling, and analysis of blanks and
groundwater samples during which contamination may occur, California
GAMA Priority Basin Project ……………………………………………………… 16
Table 4. Detection frequencies in field, source-solution, and laboratory blanks and in
groundwater samples for the 18 volatile organic compounds (VOCs) and
tentatively identified compounds (TICs) detected in field or source-solution
blanks, California GAMA Program, Priority Basin Project, May 2004 through
September 2010 …………………………………………………………………… 21
Table 5. Volatile organic compounds (VOCs) detected in a field blank analyzed in
triplicate and determined to be affected by residual methanol from equipment
cleaning, California GAMA Priority Basin Project, May 2004 through
September 2010 …………………………………………………………………… 24
Table 6. Detection frequencies for the 17 VOCs and the TICs detected in field blanks and
results of statistical tests for differences between subsets of the field blanks,
California GAMA Priority Basin Project, May 2005 through September 2010 …… 30
Table 7. Values of study reporting levels (SRLs) for the 18 VOCs detected in field blanks or
source-solution blanks determined from the set of 167 quality-control field
blanks using four methods, and changes in detection frequencies in the set
of 2,026 groundwater samples with application of the different SRLs, California
GAMA Priority Basin Project, May 2004 through September 2010 ……………… 41
Table 8. Study reporting levels (SRLs) and number of data censored by application
of the SRLs, California GAMA Priority Basin Project, May 2004 through
September 2010 …………………………………………………………………… 42
Table 9. Raw detection frequencies by study unit of volatile organic compounds (VOCs)
before and after application of study reporting units (SRLs), California GAMA
Priority Basin Project, May 2004 through September 2010 ……………………… 43
Table 10. Probability of false-positive detections at fractions of the long-term method
detection level (LT-MDL), and numbers of detections with concentrations below
the threshold, California GAMA Priority Basin Project, May 2004 through
September 2010 …………………………………………………………………… 67

viii
Conversion Factors and Abbreviations and Acronyms
Conversion Factors
Inch/foot to International System of Units (SI)
Multiply By To obtain
Length
inch (in.) 2.54 centimeter (cm)
foot (ft) 0.3048 meter (m)
International System of Units (SI) to ounce/quart units
Multiply By To obtain
Length
meter (m) 3.281 feet (ft)
Volume
liter (L) 1.05669 quart (qt)
milliliter (mL) 0.033814 ounce (oz)
Mass
gram (g) 0.035274 ounce (oz)
Temperature in degrees Celsius (°C) may be converted to degrees Fahrenheit (°F) as follows:
°F=(1.8×°C)+32
Concentrations of chemical constituents in water are given either in milligrams per liter (mg/L)
or micrograms per liter (µg/L). One milligram per liter is equivalent to 1 part per million (ppm);
1 microgram per liter is equivalent to 1 part per billion (ppb).
Abbreviations and Acronyms
CDF cumulative distribution function
CDPH California Department of Public Health
BD binomial distribution
GAMA Groundwater Ambient Monitoring and Assessment Program
LRL laboratory reporting level
LT-MDL long-term method detection level
MDL method detection level
na no data available
NAWQA National Water-Quality Assessment (a USGS program)
NWQL National Water Quality Laboratory (a USGS laboratory)
PBP Priority Basin Project
PVC polyvinyl chloride
QC quality control
QCFB quality-control field blanks
SRL study reporting level
TIC tentatively identified compound
TU tritium unit
USEPA U.S. Environmental Protection Agency
USGS U.S. Geological Survey
VOC volatile organic compound
Evaluation of Volatile Organic Compound (VOC) Blank Data
and Application of Study Reporting Levels to Groundwater
Data Collected for the California GAMA Priority Basin
Project, May 2004 through September 2010
By Miranda S. Fram, Lisa D. Olsen, and Kenneth Belitz
Abstract
Volatile organic compounds (VOCs) were analyzed
in quality-control samples collected for the California
Groundwater Ambient Monitoring and Assessment (GAMA)
Program Priority Basin Project. From May 2004 through
September 2010, a total of 2,026 groundwater samples, 211
eld blanks, and 109 source-solution blanks were collected
and analyzed for concentrations of 85 VOCs. Results from
analyses of these eld and source-solution blanks and of
2,411 laboratory instrument blanks during the same time
period were used to assess the quality of data for the 2,026
groundwater samples. Eighteen VOCs were detected in
eld blanks or source-solution blanks: acetone, benzene,
bromodichloromethane, 2-butanone, carbon disulde,
chloroform, 1,1-dichloroethene, dichloromethane, ethylbenzene,
tetrachloroethene, styrene, tetrahydrofuran, toluene,
trichloroethene, trichlorouoromethane, 1,2,4-trimethylbenzene,
m- and p-xylenes, and o-xylene.
The objective of the evaluation of the VOC-blank data
was to determine if study reporting levels (SRLs) were needed
for any of the VOCs detected in blanks to ensure the quality of
the data from groundwater samples. An SRL is equivalent to a
raised reporting level that is used in place of the reporting level
used by the analyzing laboratory [long-term method detection
level (LT-MDL) or laboratory reporting level (LRL)] to reduce
the probability of reporting false-positive detections. Evaluation
of VOC-blank data was done in three stages: (1) identication
of a set of representative quality-control eld blanks (QCFBs)
to be used for calculation of SRLs and identication of VOCs
amenable to the SRL approach, (2) evaluation of potential
sources of contamination to blanks and groundwater samples by
VOCs detected in eld blanks, and (3) selection of appropriate
SRLs from among four potential SRLs for VOCs detected in
eld blanks and application of those SRLs to the groundwater
data. An important conclusion from this study is that to ensure
the quality of the data from groundwater samples, it was
necessary to apply different methods of determining SRLs from
eld blank data to different VOCs, rather than use the same
method for all VOCs.
Four potential SRL values were dened by using three
approaches: two values were dened by using a binomial
probability method based on one-sided, nonparametric
upper condence limits, one was dened as equal to the
maximum concentration detected in the eld blanks, and one
was dened as equal to the maximum laboratory method
detection level used during the period when samples were
collected for the project. The differences in detection
frequencies and concentrations among different types of
blanks (laboratory instrument blanks, source-solution blanks,
and eld blanks collected with three different sampling
equipment congurations) and groundwater samples were
used to infer the sources and mechanisms of contamination
for each VOC detection in eld blanks. Other chemical data
for the groundwater samples (oxidation-reduction state,
co-occurrence of VOCs, groundwater age) and ancillary
information about the well sites (land use, presence of known
sources of contamination) were used to evaluate whether the
patterns of detections of VOCs in groundwater samples before
and after application of potential SRLs were plausible. On this
basis, the appropriate SRL was selected for each VOC that
was determined to require an SRL.
The SRLs for ethylbenzene [0.06 microgram per liter
(µg/L)], m- and p-xylenes (0.33 µg/L), o-xylene (0.12 µg/L),
toluene (0.69 µg/L), and 1,2,4-trimethylbenzene (0.56 µg/L)
corresponded to the highest concentrations detected in the
QCFBs and were selected because they resulted in the most
censoring of groundwater data. Comparisons of hydrocarbon
ratios in groundwater samples and blanks and comparisons
between detection frequencies of the ve hydrocarbons in
groundwater samples and different types of blanks suggested
three dominant sources of contamination that affected
groundwater samples and blanks: (1) ethylbenzene, m
- and
p-xylenes, o-xylene, and toluene from fuel or exhaust
components sorbed onto sampling lines, (2) toluene from vials
and the source blank water, and (3) 1,2,4-trimethylbenzene
from materials used for collection of samples for
radon-222 analysis.

2 VOC Blank Data and Study Reporting Levels, California GAMA PBP, 2004–2010
The SRL for carbon disulde (0.03 µg/L) corresponded
to the maximum LT-MDL. The most probable source of
carbon disulde contamination is the gloves worn by eld
and laboratory personnel. Most carbon disulde detections
in groundwater samples occurred in anoxic samples, which
is consistent with predicted occurrence of carbon disulde
formed naturally under sulfate-reducing conditions.
No SRL was needed for chloroform for groundwater
samples collected at production wells; the detection frequency
of chloroform in the QCFBs was less than 3 percent. The
maximum LT-MDL (0.02 µg/L) was established as the
SRL for chloroform for groundwater samples collected
at monitoring wells. No SRLs were established for
benzene, bromodichloromethane, 1,1-dichloroethene,
dichloromethane, styrene, tetrachloroethene, trichloroethene,
or trichlorouoromethane; the detection frequencies of these
VOCs in the QCFBs were less than 3 percent.
The SRL approach could not be applied to acetone,
2-butanone, or tetrahydrofuran because it was not possible
to dene threshold concentrations above which one could
be reasonably certain that detections in groundwater
samples were not the result of contamination. The
highest concentrations of these three VOCs occurred in
groundwater samples and eld blanks collected at sites where
contamination with the methanol used to clean eld equipment
or the cement used to join polyvinyl chloride (PVC) piping
was documented.
The 2,026 groundwater samples had a total
of 2,580 detections of 60 different VOCs. Of those
2,580 detections, 489 were censored by application of the
SRLs determined in this report. Of the remaining detections,
231 had concentrations below the highest LT-MDL used
during the study period. LT-MDLs changed by less than a
factor of 2 between May 2004 and September 2010 for most
VOCs, and the changes did not signicantly alter reporting of
detections with low concentrations. Therefore, censoring at
the highest LT-MDL for VOCs that do not have SRLs does not
appear to be necessary to ensure comparability between study
units sampled at different times during that period.
Introduction
The California State Water Resources Control Board, in
collaboration with the U.S. Geological Survey (USGS) and
the Lawrence Livermore National Laboratory, initiated the
Groundwater Ambient Monitoring and Assessment (GAMA)
Program (http://www.swrcb.ca.gov/gama) to assess the
quality of groundwater in aquifers used for drinking-water
supply and to establish a baseline groundwater-quality
monitoring program. The GAMA Program currently consists
of four projects: the GAMA Priority Basin Project (PBP),
conducted by the USGS (http://ca.water.usgs.gov/gama),
the GAMA Domestic Well Project and GeoTracker GAMA,
both conducted by the State Water Resources Control
Board, and GAMA Special Studies, conducted by Lawrence
Livermore National Laboratory. The USGS, in collaboration
with the State Water Resources Control Board, developed
the project design for the PBP (Belitz and others, 2003;
California State Water Resources Control Board, 2003). For
the PBP, California’s groundwater basins were prioritized
primarily on the basis of the number of municipal and
community drinking-water supply wells. The 116 priority
basins, representing 95 percent of the wells in basins, as
well as selected areas outside of dened groundwater basins,
were grouped into 35 study units to be sampled between
2004 and 2012. Groundwater samples were collected from
2,026 sites in the rst 32 study units from May 2004 through
September 2010 (g. 1; tables 1, A1).
Volatile organic compounds (VOCs) were analyzed in
samples collected from all 2,026 sites. VOC analyses were
conducted at the USGS National Water Quality Laboratory
(NWQL). The NWQL uses methods that detect concentrations
much lower than the detection limits required for analyses
made for regulatory purposes (California Department of Public
Health, 2011). Detections of VOCs (and other anthropogenic
organic compounds) at these low concentrations may be used
to trace water from the landscape, where it may have been
affected by anthropogenic contaminants, to aquifer systems.
Before interpretations of environmental processes
are made using VOC data from groundwater samples, the
potential presence of confounding VOC detections that
are the result of contamination during sample collection,
handling, or analysis must be evaluated. Contamination
during sample collection, handling, or analysis (also known
as “extrinsic” contamination) may be the result of contact
between groundwater samples and surfaces, liquids, or
vapors encountered during any of these steps. Detections
in groundwater samples that are the result of extrinsic
contamination do not reect the occurrence of VOCs in the
aquifer from which the groundwater sample was collected.
These must be carefully isolated from VOC detections
in a groundwater sample that are representative of VOC
contamination of the aquifer (that is, intrinsic contamination).
All VOC contamination discussed in this report is extrinsic.
In this study, eld blanks were collected at 211 of the
sites at which groundwater samples were collected. VOC data
from the eld blanks, associated source-solution blanks, and
laboratory instrument blanks analyzed during the same time
period were used to evaluate extrinsic contamination.
Introduction 3
Bakersfield
San Francisco
OREGON
NEVADA
MEXICO
ARIZONA
Redding
Los Angeles
San Diego
Pacific Ocean
200 MILES0
200 KILOMETERS0
40
42
124 122 120 118 116 114
38
36
34
Shaded relief derived from U.S. Geological Survey
National Elevation Dataset, 2006,
Albers Equal Area Conic Projection
Sacramento
IP031454_Figure 01. Location in California
N1
N2
N3
N4
N5
N6
N7
M1
M2
M3
M4
M5
M6
V1
V2
V3
V4
V5
V6
V7
V8
V9
D1
D2
D3
D4
D5
S1
S2
S3
S4
S6
S5
N5
N5
Figure 1. The 32 study units sampled for the California GAMA Priority Basin Project, May 2004 through
September 2010. See table 1 for study unit names.

4 VOC Blank Data and Study Reporting Levels, California GAMA PBP, 2004–2010
Use of Study Reporting Levels
Contamination of a sample during sample collection,
handling, or analysis may result in addition of constituents
that are being analyzed—in this case, VOCs. Such addition
may increase the concentration of a constituent already present
at detectable levels in the sample, or result in detection of a
constituent that would not otherwise be reported as detected.
Comparison of concentrations in environmental samples
to the concentrations in benchmarks established for drinking
water provides a context for the concentrations detected in
groundwater samples (for example, Belitz and others, 2010;
Landon and others, 2010; Toccalino and others, 2010). For the
GAMA-PBP, the benchmarks used for comparison were those
from the U.S. Environmental Protection Agency (USEPA)
and the California Department of Public Health (CDPH),
and included regulatory (USEPA and CDPH maximum
contaminant levels) and non-regulatory benchmarks (CDPH
notication levels, and USEPA lifetime health advisory levels
and risk-specic doses) (California Department of Public
Health, 2006, 2008, 2010; U.S. Environmental Protection
Agency, 2009a,b). For most VOCs, contamination generally
does not affect use of the data to assess whether concentrations
in environmental samples are above or below benchmarks;
however, data for VOCs often are reported as detection
frequencies at any concentration, and the presence of low
concentrations of VOCs can be used as a tracer indicating the
presence of a component of modern groundwater. Therefore,
Table 1. Study unit names, sampling dates, Data Series Reports, and sampling schedules,
California GAMA Priority Basin Project, May 2004 through September 2010.
[USGS, U.S. Geological Survey. Map codes (gure 1): D, Desert study units; M, Mountain study units; N,
North and Central Coast study units; S, South Coast study units; V, Central Valley study units]
Study unit
Map
code
Sampling dates
Data Series
Report
number
San Diego Drainages S5 May–July 2004 129
North San Francisco Bay N3 August–November 2004 167
Northern San Joaquin V4 December 2004–February 2005 196
Southern Sacramento Valley V3 March–June 2005 285
San Gabriel–San Fernando S3 May–July 2005 356
Monterey-Salinas N6 July–September 2005 258
Southeast San Joaquin V7 October–December 2005 351
Kern Basin V8 January–March 2006 337
Central Eastside V5 March–May 2006 325
Central Sierra Nevada M4 May 2006 335
Southern Sierra Nevada M3 June 2006 301
Middle Sacramento Valley V2 June–August 2006 385
Southern California Coastal Plain S2 August–November 2006 387
Owens-Indian Wells M2 September–December 2006 427
Santa Ana–San Jacinto S4 November 2006–February 2007 404
Coachella Valley D3 February–March 2007 373
Santa Clarita-Ventura S1 April–May 2007 408
San Francisco Bay N4 April–June 2007 396
Tahoe-Martis M5 June–September 2007 432
Colorado River D4 October–December 2007 474
Northern Sacramento Valley V1 October 2007–January 2008 452
Antelope Valley D1 January–April 2008 479
Mojave D2 February–April 2008 440
Madera-Chowchilla V6 April–May 2008 455
Santa Maria-Lompoc N7 May–November 2008 504
Sierra Nevada Regional M1 June–October 2008 534
Livermore-Gilroy-Cuyama N5 August–November 2008 463
Central Desert-Borrego D5 December 2008–March 2010 659
Ukiah-Clear Lake N2 June–July 2009 609
Eureka-Crescent City N1 July–October 2009 609
Western San Joaquin Valley V9 March–June 2010 706
Cascades-Modoc Plateau M6
July–October 2010 688

Introduction 5
extrinsic contamination that results in detection of a VOC
that would otherwise not be reported as detected may have a
signicant effect on interpretation of the environmental data.
A detection is conrmation of a compound’s presence in
a sample relative to specied reporting criteria. One typical
practice is to use the data as reported by the laboratory. The
USGS NWQL’s reporting conventions for VOCs are discussed
in the section “Laboratory Methods.” The GAMA Program
uses study reporting levels (SRLs) to limit the effects of
potential extrinsic contamination indicated by detections
in blanks. SRLs are dened at a higher concentration than
the reporting levels used by the laboratory. By raising the
reporting level, samples with low concentrations of VOCs that
may be the result of extrinsic contamination are re-dened
as having non-detections. This avoids over-estimating
the prevalence of the VOC in the aquifer system. An SRL
may also be dened to provide a uniform reporting level if
laboratory reporting levels have changed over the lifetime
of the project. Finally, an SRL may be dened to match
the project’s data-quality objectives for constraints on the
probabilities of false positives and false negatives.
Detections in environmental samples with concentrations
less than or equal to the SRL are then considered to have an
unacceptably high probability of resulting from contamination
by the processes that affected the eld blanks. A remark code
is added to these results, and the detections reported by the
laboratory are not counted as detections in the environmental
data. Environmental samples having concentrations greater
than the SRL may also have been contaminated, but the
probability that the amount of contamination would have
been sufcient to result in a reported detection, when the true
concentration was a non-detection, is acceptably low.
Philosophy of Quality-Control Evaluation
of Blanks
There are three philosophical issues to consider when
designing methods for quality-control evaluation of blanks
to determine SRLs. The rst issue is whether contamination
is a process that results in contamination of samples with
up to a certain amount of a constituent (characteristic
concentration), or a process that affects a certain percentage
of samples (characteristic frequency), or a process that results
in addition of an unpredictable amount of a constituent to an
unpredictable percentage of samples. Methods based on the
premise that contamination has a characteristic concentration
generally work by ranking the concentrations in the eld
blanks and selecting a threshold rank whose concentration
is dened as the SRL. Methods based on the premise that
contamination has a characteristic frequency assume that the
detection frequency in the eld-blank dataset is the frequency
with which environmental samples are contaminated by the
process that affects eld blanks. The SRL is then dened by
the concentration in environmental samples below which the
detection frequency in the environmental samples is equal
to the detection frequency at any concentration in the eld
blanks. Such a method implicitly assumes that contamination
is responsible for the detections with the lowest concentrations
within the distribution observed in the environmental
samples. It is also possible that the amount and frequency of
contamination of environmental samples are not predictable
from the eld-blank data. In this case, the eld blanks cannot
be used to dene an SRL, and the quality of the data for
environmental samples cannot be assessed.
The second philosophical issue is that eld blanks,
source-solution blanks, and groundwater samples may be
treated either as independent populations (statistical approach)
or as paired samples (deterministic approach). In deterministic
approaches, information about the sequence of collection of
blanks and environmental samples is used in the evaluation; in
statistical approaches, the blanks and environmental samples
are treated as independent populations. In a deterministic
method, paired eld blank and environmental samples and
paired eld blank and source-solution blank samples are
examined. A deterministic method is often believed to be
appropriate when looking for evidence of carryover between
sequential samples (eld blank/environmental sample pairs)
or for evidence of prior contamination of source blank water
(eld blank/source-solution blank pairs) (for example, Bender
and others, 2011). However, there is a universal drawback
of this approach. If eld blanks, source-solution blanks, and
environmental samples are not assumed to be independent
populations, then quality-control assessment requires
collecting a eld blank and a source-solution blank with every
environmental sample.
In statistical approaches, a eld blank collected at a
particular site is assumed to be statistically representative of
conditions under which environmental samples are collected
at all sites. Field blanks are not directly compared to the
“paired” environmental sample collected at the same site.
Similarly, a source-solution blank collected at a particular
site is considered representative of source-solution blanks
that could be collected at any site. Methods that determine
the SRL by identifying a threshold rank and dening the
concentration in the eld blank with that rank as the SRL, and
methods that involve comparison of cumulative frequency
distributions (CDF), are based on the assumption that blanks
and environmental samples are independent populations.
Statistical approaches were used for this study.
The third philosophical issue is that different methods for
determining SRLs may be used for different constituents, or
the same method may be used for all constituents. In general,
analyses of blanks to assess the quality of environmental
data have been based on a single method being applied to all
constituents (for example, Martin and others, 1999; Olsen and
others, 2010; Bender and others, 2011). However, in a large
group of constituents like the VOCs, there will be multiple
6 VOC Blank Data and Study Reporting Levels, California GAMA PBP, 2004–2010
mechanisms by which contamination may be introduced
during sample collection, handling, and analysis. VOCs with
different sources and physical and chemical properties will be
affected by different contamination mechanisms, thus, it may
be necessary to use different methods for determining SRLs
for different VOCs. This approach requires the ability to make
accurate inferences both from patterns of detections in blanks
and environmental samples and about likely mechanisms of
contamination for different VOCs.
In addition to the philosophical issues, it is important
to consider the robustness of the results when selecting
an approach to determine SRLs from eld-blank data. In
this context, robustness refers to how sensitive a particular
screening method is to small changes in the eld-blank dataset.
For example, use of a threshold, such as the concentration
in a eld blank with a specied rank, would not be robust
if picking one rank up or down produced radically different
results in terms of the percentage of the environmental data
that were then below the SRL. In this context, ‘rank’ refers
to ordinal number of a particular eld blank in a set of eld
blanks organized in sequence by concentration.
Computed detection frequencies of VOCs in groundwater
also are sensitive to data reporting conventions. Reporting
conventions commonly are dened to ensure that the data
meet criteria of acceptable probability for differentiating
between true detections and false-positive detections. The
primary metric used by the USGS NWQL for dening
detections is the long-term method detection level (LT-MDL);
however, for the VOCs, the NWQL also reports concentrations
below the LT-MDL (Connor and others, 1998). Detections
below the LT-MDL have a greater than 1-percent probability
of being false-positive detections (Childress and others, 1999).
Reporting data below the LT-MDL is not in itself a problem;
however, the probabilities of false-positive detections should
be evaluated in comparison to project data-quality objectives.
In addition, LT-MDLs may change over time, potentially
resulting in a variably censored dataset. To compare detection
frequencies across the period of study, a dataset may need
to be re-censored to a common reporting level (for example,
Zogorski and others, 2006).
Purpose and Scope
The purpose of evaluating VOC-blank data is to
characterize potential contamination of environmental
samples during sample collection, handling, and analysis
(extrinsic contamination). This characterization is necessary
to distinguish between VOC detections that may be due
to extrinsic contamination and VOC detections that are
representative of VOC concentrations in the aquifer from
which the sample was collected. SRLs that are higher than
the reporting levels used by the laboratory may be dened for
VOCs having evidence for extrinsic contamination. Detections
with concentrations below the SRLs are considered to have an
unacceptably high probability of resulting from contamination,
and therefore should not be considered detections for the
purpose of interpreting the environmental data.
The purposes of this report are as follows:
• To present multiple methods for evaluating blanks and
establishing SRLs, and to describe the processes used
to select the appropriate SRL for each compound.
• To evaluate which eld blanks are representative
of processes likely to affect environmental
samples, and if there are differences between eld
blanks collected with different sample-collection
equipment congurations.
• To present results of a eld experiment conducted
to demonstrate the effect of contamination of
eld blanks with the methanol used to clean
sample-collection equipment.
• To infer likely sources of VOC contamination
during sample collection, handling, and analysis on
the basis of comparison of detection frequencies
and concentrations in eld blanks, source-
solution blanks, laboratory instrument blanks, and
environmental samples.
• To put SRLs in context by comparing them to
LT-MDLs and by comparing the effects of application
of different SRLs on the environmental dataset.
The work presented here is based on 2,026 groundwater
samples, 211 eld blanks, and 109 source-solution blanks
collected from May 2004 through September 2010 for
the rst 32 study units of the California GAMA-PBP, and
2,411 laboratory instrument blanks analyzed during the
same period. The groundwater samples were collected from
production wells by using two different sampling equipment
congurations (long sampling lines and short sampling
lines) and from monitoring wells with monitoring-well
sampling equipment.
An evaluation of blanks is presented for each of the
18 VOCs that were detected in eld or source-solution
blanks (acetone, benzene, bromodichloromethane,
carbon disulde, chloroform, 1,1-dichloroethene,
dichloromethane, ethylbenzene, 2-butanone, styrene,
tetrachloroethene, tetrahydrofuran, toluene, trichloroethene,
trichlorouoromethane, 1,2,4-trimethylbenzene, m- and
p-xylenes, and o-xylene).
The methods presented for evaluation of blanks and for
selection of SRLs are widely applicable and can be used by
USGS and non-USGS scientists who work with large datasets
of water-quality measurements from blanks and environmental
samples. This report makes inferences about the sources of
VOC contamination on the basis of comparisons between

Methods Used to Collect and Evaluate VOC Data 7
detection frequencies in different types of blanks and our
understanding of eld and laboratory practices. Targeted
studies to evaluate these inferences were not undertaken as
part of this project.
The SRLs established in this report can be used
for data reporting and interpretive data analysis for all
USGS-GAMA projects. The SRLs also can be used by other
USGS groundwater studies, such as National Water-Quality
Assessment (NAWQA) Program studies, that used sampling
methods similar to those used by the GAMA-PBP. The
SRLs established in this report may be particularly useful
for projects that have smaller quality-control (QC) datasets
than those used for GAMA projects. These smaller QC
datasets limit researchers’ ability to make comprehensive QC
assessments and develop their own SRLs.
Methods Used to Collect and Evaluate
VOC Data
Methods used to collect and evaluate VOC data
for this study include (1) eld methods for collecting
groundwater samples and blanks; (2) laboratory methods
for analysis of all samples; (3) data analysis methods for
identifying representative eld blanks and calculating
SRLs; (4) evaluation methods for inferring potential
sources of contamination and selecting appropriate SRLs;
and (5) statistical methods for testing the signicance of
differences between subsets of samples.
Field Methods
Because the purpose of this evaluation of VOC
eld-blank data is to characterize potential contamination
of environmental samples, the data collection process will
be described for the groundwater samples as well as for
the eld and source-solution blanks. Groundwater samples
were collected for VOC analysis from May 2004 through
September 2010 from 2,026 sites in 32 study units distributed
throughout California (g. 1). Field blanks were collected
at 211 of the sites (10.4 percent). Groundwater sample data,
along with assessments of the corresponding QC data on
a study unit basis, are given in USGS Data Series Reports
for each study unit (table 1). Of the 2,026 sites, 167 were
monitoring wells, 34 were developed springs, and 1,825 were
production wells.
Groundwater Samples
Groundwater samples to be used for VOC analysis were
collected in accordance with the protocols established by
the USGS National Field Manual (U.S. Geological Survey,
variously dated). These protocols ensure that a sample that is
representative of the groundwater in the aquifer is collected
from each site and that samples are handled in a consistent
way that minimizes the potential for contamination of the
samples. Three protocols were used (g. 2A):
• monitoring-well pumps for the 167
monitoring wells;
• short sampling lines for the 34 developed springs
and 1,199 of the production wells; and
• long sampling lines for the other 626
production wells.
“Short” and “long” refer to the length of the Teon
®
tubing
used to route the water from the well to the sample bottles. For
sites sampled with short sampling lines, the Teon
®
tubing
attached to the sampling point was approximately 18 inches
(in.) long, and samples were collected outdoors at the
sampling point. For sites sampled with long sampling lines, a
25-foot (ft) or 32-ft length of Teon
®
tubing was attached to
the sampling point and routed inside a mobile laboratory. On
rare occasions, the two lengths of tubing were connected to
each other (making 57 ft).
The GAMA-PBP used a tiered sampling strategy in
many study units. Samples for a core suite of analytes were
collected at all wells, and samples for a larger suite of analytes
were collected at a subset of the wells. Short sampling lines
generally were used at sites where samples for the core suite
of analytes were being collected, and long sampling lines
generally were used at sites where samples for the larger suite
of analytes were being collected. Both the long and short
sampling line congurations were used in 24 study units; only
the long sampling line conguration was used in 6 study units.
For two study units where vehicular access to many of the
sites was limited, only the short sampling line conguration
was used.
Many of the wells sampled by GAMA were production
wells that were in continuous use; therefore, no additional
purging of the wells was required. Sampling lines were
attached to the well, and water was routed through a
ow-through chamber with a multi-parameter probe for
measurement of eld parameters (water temperature, specic
conductance, pH, and dissolved oxygen). Field parameter
readings were recorded every 5 minutes, and sample collection
commenced after at least four consecutive readings with the
same values. For wells that were not in continuous use, wells
were pumped to purge at least three casing-volumes of water
from the well before measurement of eld parameters began.
8 VOC Blank Data and Study Reporting Levels, California GAMA PBP, 2004–2010
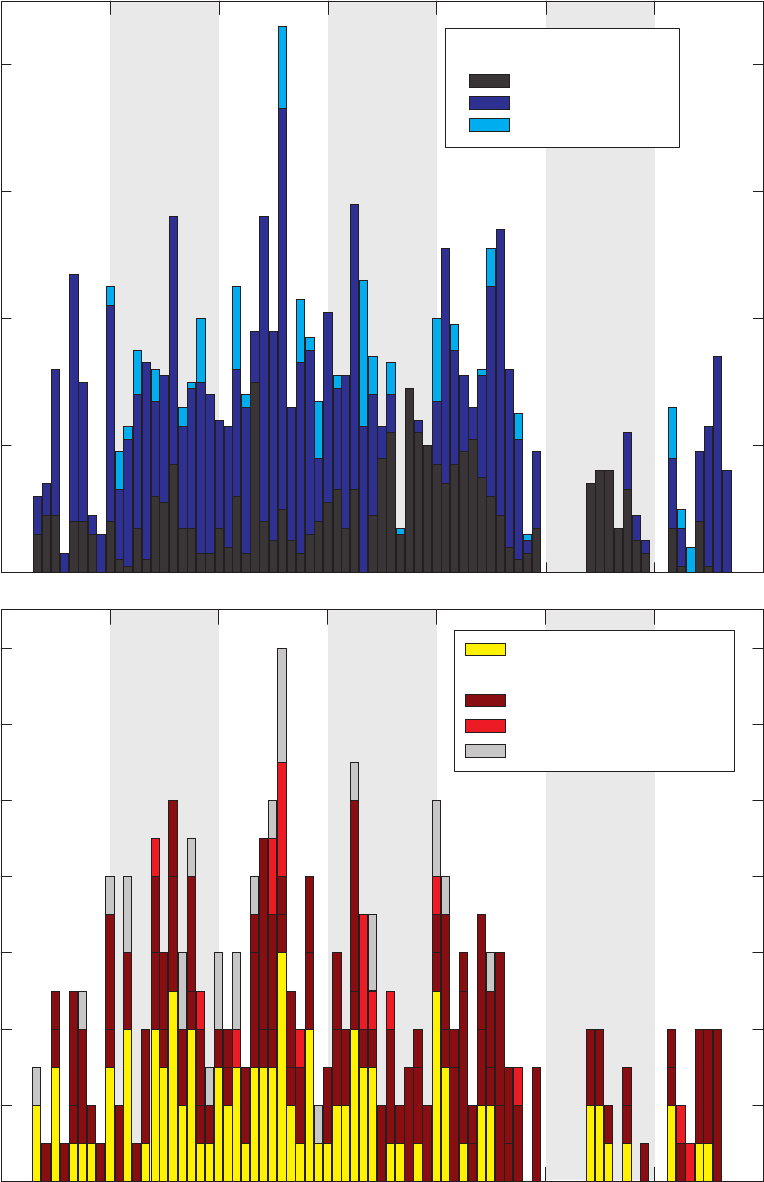
IP031454_Figure 02ab. sample collection and blanks
Number of blanks analyzed per month
0
2
4
6
8
10
12
14
Source-solution blanks
Long and short sampling lines
Monitoring-well pump
Affected by methanol
2004 2005 2006 2007
Year
2008 2009 2010
Field blanks
A
Number of samples collected per month
0
20
40
60
80
Long sampling lines
Short sampling lines
Monitoring-well pump
2004 2005 2006 2007 2008 2009 2010
Sample-collection equipment
Groundwater samples
B
Blanks
Figure 2. Number of (A) groundwater samples and (B) field and source-solution blanks collected
per month by the California GAMA Priority Basin Project, and (C) number of laboratory instrument
blanks analyzed per month for volatile organic compounds by the USGS National Water Quality
Laboratory, May 2004 through September 2010.
Methods Used to Collect and Evaluate VOC Data 9
Figure 2.—Continued
IP031454_Figure 02c. lab blanks
C
2004 2005 2006 2007
Year
2008 2009 2010
Laboratory
instrument
blanks
0
20
10
30
40
60
50
70
Number of laboratory blanks analyzed per month
Groundwater samples and field blanks were collected with three types of sampling equipment.
Short or long sampling lines were used at production wells, where short (18 inches) and long
(25 feet) refer to the length of Teflon
®
line used to route the water from the source to the sample
bottles. Monitoring wells were sampled with monitoring-well pumps and long sampling lines.

10 VOC Blank Data and Study Reporting Levels, California GAMA PBP, 2004–2010
Production wells (and developed springs) were sampled
by using Teon
®
tubing (short or long sampling lines) with
stainless-steel ttings attached to the sampling point (hose bib)
on the well discharge pipe as close to the wellhead as possible.
At some wells, additional ttings made of brass, steel, or
stainless steel had to be used to construct a sampling point
with a hose bib. The sampling point was located upstream of
any wellhead treatment system or water storage tank, except
for infrequent cases in which this was not possible. For sites
sampled with short sampling lines, samples were collected
outdoors at the sampling point. For sites sampled with
long sampling lines, the tubing was connected to a Teon
®
ow-control manifold with stainless-steel ttings, and samples
were collected inside an enclosed chamber inside the mobile
laboratory. Monitoring wells usually were sampled by using
a stainless-steel Grundfos submersible pump with a 300-ft
Teon
®
discharge line. The discharge line was connected to
the ow-control manifold inside the mobile lab with a long
(25 ft) Teon
®
sampling line.
All ttings and lengths of tubing were cleaned thoroughly
between collection of each sample. For the monitoring-well
pump and the long sampling line congurations, a peristaltic
pump was used to pump the following sequence of cleaning
solutions through the ttings and lines: tap water, dilute
solution of non-phosphate laboratory detergent (Liquinox
®
),
deionized water, methanol, deionized water, and nally
certied blank water (Wilde, 2004). For the short sampling
line conguration, the same cleaning solutions were poured
through the ttings and lines in the same order. The short
sampling lines generally were cleaned in the laboratory, and
clean lines wrapped in plastic wrap and aluminum foil were
transported to the eld site. The long sampling lines and
monitoring-well pump generally were cleaned at the eld site
immediately following sample collection, although on rare
occasions, the lines were cleaned immediately prior to sample
collection at the next eld site. Fittings used to attach a hose
bib to the well discharge pipe (if needed) were cleaned at the
eld site immediately prior to use during the early years of the
GAMA-PBP, and were cleaned in the laboratory during the
later years of the project. The full sampling line conguration
(short, long, or monitoring well) was attached before well
purging and measurement of eld parameters began, thus
the lines generally were rinsed with a large volume of
groundwater before sample collection.
Groundwater samples to be analyzed for VOCs were
collected in pre-baked 40-milliliter (mL) amber glass vials
with Teon-septa caps. The VOC vials were the rst set of
sample containers lled during sample collection. The vials
were bottom-lled and purged with at least three vial volumes
of sample water before being lled to the top to eliminate
entrainment of ambient air. Three to ve drops of 6 N certied
hydrochloric acid were added as a preservative, and the vials
were sealed with no headspace or bubbles. The hydrochloric
acid was certied by the USGS NWQL and was dispensed
from a Teon
®
dropper bottle. The dropper bottle of acid
was kept sealed in a plastic container provided by the USGS
NWQL in a cooler with ice between uses and was replaced
approximately every 2 months. Three VOC vials were
collected for each sample. Vials were packed in protective
foam sleeves, sealed in ziplock bags, and placed in a cooler
with ice inside the mobile lab until they were shipped to the
laboratory. Samples were shipped in coolers packed with ice
by overnight carrier to the USGS NWQL within a day or two
of collection.
Blanks
Field blanks were collected at 10.4 percent of the sites
(211 of 2,026 sites) to determine if equipment, procedures,
or conditions in the eld, during transit, or in the laboratory
introduced contamination to the samples. Field blanks
and source-solution blanks to be analyzed for VOCs were
collected using certied blank water purchased from the
USGS Field Supply Service (One Stop). The certied blank
water is contracted in large lots, and each lot is tested by the
NWQL. Lots are for sale for approximately 6 to 12 months.
Certied blank water is purchased in 4-liter amber glass
bottles and is used within 1 week of delivery.
For the long and short line congurations, eld blanks
were collected by pumping the certied blank water through
the sampling equipment using a portable peristaltic pump.
In some cases, eld blanks for the short line conguration
were collected by pouring blank water through the sampling
equipment. For the monitoring-well conguration, eld blanks
were collected by immersing the monitoring-well pump in
a dedicated Teon standpipe containing the certied blank
water. During the early years of the GAMA-PBP, the portable
peristaltic pump used for collection of eld blanks also was
used for pumping cleaning solutions through lines between
samples. During the later years of the project, a dedicated
pump was used for collection of eld blanks, and the pump
commonly was cleaned in the laboratory prior to transport to
the eld site. Of the 211 eld blanks, 22 were collected with
monitoring-well equipment, 112 with short sampling lines, and
77 with long sampling lines (g. 2B).
Source-solution blanks were collected at 109 of the
211 sites at which eld blanks were collected (g. 2B).
Source-solution blanks were collected by pouring blank water
directly into the sample vials, which were then preserved,
stored, shipped, and analyzed in the same manner as the
eld blanks. Source-solution blanks are subject to the same
potential sources of contamination as the eld blanks, with
the exception of contact with eld equipment used to collect
samples. A trip blank was collected for 1 of the 211 sites; this
blank was treated as a source-solution blank for the purposes
of this report.

Methods Used to Collect and Evaluate VOC Data 11
Laboratory Methods
Samples were analyzed for VOCs at the USGS NWQL
in Denver, Colorado, by purge & trap gas chromatography
with quadrupole mass-spectrometric detection (Connor and
others, 1998; NWQL Laboratory Schedule 2020). Samples
are stored in the dark at 4°C and analyzed within 14 days of
eld collection. The quality-assurance program followed by
the NWQL is described by Maloney (2005) and Pirkey and
Glodt (1998). Laboratory QC samples, including laboratory
method blanks, continuing calibration verication checks,
reagent spikes, certied standard reference materials, and
external blind prociency samples, are analyzed regularly. The
NWQL maintains certication by the National Environmental
Laboratory Accreditation Program (NELAP) and other
certications (http://nwql.usgs.gov/Public/lab_cert.shtml).
The NWQL analyzes laboratory instrument blanks
(and other quality-control samples) as part of every batch of
environmental and eld quality-control samples analyzed
for VOCs. The purpose of the laboratory instrument blanks
is to evaluate the occurrence of potential carry-over between
samples during analysis, and to evaluate the presence of
potential systemic contamination in the analytical equipment.
From May 2004 through September 2010, 2,411 laboratory
instrument blanks were analyzed for VOCs (g. 2C). Results
for the VOCs detected in laboratory instrument blanks were
obtained from the NWQL (http://nwqlqc.cr.usgs.gov/).
The USGS NWQL uses two thresholds for reporting
VOC data: the long-term method detection level (LT-MDL)
and the laboratory reporting level (LRL). The LT-MDL is
determined by using a method (Childress and others, 1999)
modied from a procedure reported by the U.S. Environmental
Protection Agency for determining the method detection
limit (USEPA MDL). The USEPA MDL is the minimum
concentration of a substance that can be measured and
reported with 99-percent condence that the concentration is
greater than zero; at the MDL, there is less than a 1-percent
chance of a false positive (U.S. Environmental Protection
Agency, 1997). The USEPA MDL is determined by analyzing
at least seven low-level spikes over a relatively short period
(“low-level” means less than 5 times the expected MDL
concentration). The LT-MDL is designed to capture more of
the long-term method variability present in routine laboratory
analyses because it is derived from at least 20 measurements
of low-level spikes made over an extended period of time (6 to
12 months) by multiple analysts and multiple instruments
(Childress and others, 1999). Low-level spikes and blanks
are monitored throughout each year, and LT-MDLs are
reevaluated at least annually and are updated accordingly.
At the LT-MDL, the probability of a false-positive detection
(Type I error) is statistically less than or equal to 1 percent.
( 1, 1 )
where
is number of replicate low-level spike
determinations (in this case, = 24),
is standard deviation of measured concentrations
of low-level spike determination,
is level of si
n
n
n
LTMDL s
s
t
n
− −α
= ×
α gnificance (in this case, 1 percent,
and
is Student's t-value for 1 degrees of freedom
and 1 confidence level (in this case, = 2.50).
tn
t
α=
−
− α
(1)
The LRL is used to control false-negative (Type II)
error and is usually set at two times the LT-MDL for each
constituent. The probability of reporting a false negative
for a sample that contains a concentration of a constituent
greater than or equal to the LRL is predicted to be less than
or equal to 1 percent (Childress and others, 1999). The
probability of reporting a false negative for a sample that
contains a concentration equal to the LT-MDL is 50 percent.
Nondetections are reported as <LRL to indicate that the true
concentration may be as large as the LRL.
Values below the LRL are reported as “estimated”
concentrations, designated with an “E” code. E-coded values
have a high likelihood of being greater than zero (detections),
but can have a high degree of uncertainty in the precise
concentration. For “information-rich” methods, such as the
VOC analytical method, the NWQL may report detections
with concentrations below the LT-MDL. The VOC method
is considered “information-rich” because analyte identity
is conrmed by two independent means: chromatographic
retention time and mass spectra (Childress and others,
1999). However, detections with concentrations less than
the LT-MDL have a greater than 1-percent chance of being
false-positive detections.
There are two issues to consider about LT-MDLs
and LRLs and interpretation of groundwater-quality data:
(1) changes in reporting levels during the period that the
samples were analyzed, and (2) denition of acceptable
probabilities of false positives and false negatives. Samples
discussed in this report were collected from May 2004 through
September 2010. During that period, 83 of the 85 VOCs
analyzed as part of NWQL Schedule 2020 had at least two
different LT-MDLs. For 34 VOCs, the concentration of the
maximum LT-MDL was at least twice the concentration of
the minimum LT-MDL (table 2). Most notably, the maximum
and minimum LT-MDLs for the two most frequently detected
VOCs, chloroform and tetrachloroethene, differed by
factors of 2 and 2.3, respectively. It is possible that detection
frequencies for these VOCs in study units sampled during
periods of maximum LT-MDL may not be comparable to those
in study units sampled during periods of minimum LT-MDL.

12 VOC Blank Data and Study Reporting Levels, California GAMA PBP, 2004–2010
Table 2. Long-term method detection levels (LT-MDLs) used by the U.S. Geological Survey National Water Quality Laboratory for
volatile organic compounds (VOCs), and VOCs detected in groundwater samples and source-solution or field blanks, California GAMA
Priority Basin Project, May 2004 through September 2010.
[The ve-digit USGS parameter code is used to uniquely identify a specic constituent or property in USGS databases and reports. Abbreviations: µg/L,
micrograms per liter; D, detected; –, not detected]
Constituent
USGS
parameter
code
CAS number
1
LT-MDL values (µg/L) Detected
Minimum Median Maximum
Ground-
water
Blanks
Hydrocarbons
Benzene 34030 71–43–2 0.008 0.01 0.013 D D
n-Butylbenzene
77342 104–51–8 0.04 0.06 0.07 – –
sec-Butylbenzene
77350 135–98–8 0.01 0.02 0.03 D –
tert-Butylbenzene
77353 98–06–6 0.03 0.03 0.04 D –
Ethylbenzene 34371 100–41–4 0.01 0.015 0.02 D D
2-Ethyltoluene 77220 611–14–3 0.01 0.02 0.03 D –
Isopropylbenzene 77223 98–82–8 0.019 0.02 0.021 D –
4-Isopropyltoluene 77356 99–87–6 0.03 0.04 0.04 D –
Naphthalene 34696 91–20–3 0.09 0.13 0.2 D –
n-Propylbenzene
77224 103–65–1 0.018 0.02 0.021 D –
Styrene 77128 100–42–5 0.015 0.02 0.021 D D
1,2,3,4-Tetramethylbenzene 49999 488–23–3 0.04 0.07 0.07 D –
1,2,3,5-Tetramethylbenzene 50000 527–53–7 0.04 0.06 0.09 D –
1,2,3-Trimethylbenzene 77221 526–73–8 0.03 0.04 0.05 D –
1,2,4-Trimethylbenzene 77222 95–63–6
0.016 0.02 0.028 D D
1,3,5-Trimethylbenzene 77226 108–67–8 0.016 0.02 0.022 D –
Toluene 34010 108–88–3 0.009 0.009 0.03 D D
m- and p-Xylenes
85795
m:108–38–3
p:106-42-3
0.03 0.04 0.04 D D
o-Xylene
77135 95–47–6 0.016 0.019 0.02 D D
Solvents and organic synthesis
Acetone 81552 67–64–1 1.7 3 3 D D
Acrylonitrile 34215 107–13–1 0.2 0.4 0.6 – –
Bromobenzene 81555 108–86–1 0.01 0.011 0.014 – –
2-Butanone (methyl ethyl ketone, MEK) 81595 78–93–3 0.8 0.8 1 D D
Chlorobenzene 34301 108–90–7 0.008 0.01 0.014 D –
Chloroethane 34311 75–00–3 0.03 0.05 0.06 D –
3-Chloropropene 78109 107–05–1 0.04 0.04 0.25 – –
2-Chlorotoluene 77275 95–49–8 0.01 0.02 0.02 – –
4-Chlorotoluene 77277 106–43–4 0.01 0.021 0.03 – –
Dibromomethane 30217 74–95–3 0.02 0.025 0.025 D –
1,2-Dichlorobenzene 34536 95–50–1 0.01 0.02 0.024 D –
1,3-Dichlorobenzene
34566 541–73–1 0.01 0.015 0.02 D –
trans-1,4-Dichloro-2-butene
73547 110–57–6 0.18 0.3 0.35 – –
1,1-Dichloroethane 34496 75–34–3 0.018 0.02 0.03 D –
1,2-Dichloroethane 32103 107–06–2 0.03 0.05 0.07 D –
1,1-Dichloroethene 34501 75–35–4 0.01 0.011 0.012 D D
cis-1,2-Dichloroethene
77093 156–59–2 0.01 0.011 0.012 D –
trans-1,2-Dichloroethene
34546 156–60–5 0.009 0.009 0.016 D –
Dichloromethane 34423 75–09–2 0.019 0.02 0.03 D D
Ethyl methacrylate 73570 97–63–2 0.07 0.07 0.09 – –
Hexachlorobutadiene 39702 87–68–3 0.03 0.05 0.07 – –
Hexachloroethane 34396 67–72–1 0.07 0.07 0.07 – –
2-Hexanone (n-Butyl methyl ketone)
77103 591–78–6 0.2 0.23 0.4 – –
Iodomethane (Methyl iodide) 77424 74–88–4 0.13 0.225 0.4 – –
1,1-Dichloropropene 77168 563–58–6 0.013 0.015 0.02 – –

Methods Used to Collect and Evaluate VOC Data 13
Table 2. Long-term method detection levels (LT-MDLs) used by the U.S. Geological Survey National Water Quality Laboratory for
volatile organic compounds (VOCs), and VOCs detected in groundwater samples and source-solution or field blanks, California GAMA
Priority Basin Project, May 2004 through September 2010.—Continued
[The ve-digit USGS parameter code is used to uniquely identify a specic constituent or property in USGS databases and reports. Abbreviations: µg/L,
micrograms per liter; D, detected; –, not detected]
Constituent
USGS
parameter
code
CAS number
1
LT-MDL values (µg/L) Detected
Minimum Median Maximum
Ground-
water
Blanks
Solvents and organic synthesis—Continued
Isobutyl methyl ketone 78133 108–10–1 0.1 0.18 0.2 D –
Methyl acrylate 49991 96–33–3 0.2 0.3 0.5 – –
Methyl acrylonitrile 81593 126–98–7 0.1 0.19 0.2 – –
Methyl methacrylate 81597 80–62–6 0.1 0.1 0.18 – –
1,1,1,2-Tetrachloroethane 77562 630–20–6 0.015 0.02 0.02 D –
Tetrachloroethene (perchloroethene, PCE) 34475 127–18–4 0.013 0.02 0.03 D D
1,2,3-Trichlorobenzene 77613 87–61–6 0.03 0.06 0.14 – –
1,2,4-Trichlorobenzene 34551 120–82–1 0.02 0.06 0.06 – –
1,1,1-Trichloroethane 34506 71–55–6 0.01 0.016 0.02 D –
1,1,2-Trichloroethane 34511 79–00–5 0.02 0.023 0.032 D –
1,1,2,2-Tetrachloroethane 34516 79–34–5 0.04 0.05 0.07 – –
Tetrachloromethane 32102 56–23–5 0.026 0.03 0.04 D –
Tetrahydrofuran 81607 109–99–9 0.5 0.7 1.1 D D
Trichloroethene 39180 79–01–6 0.01 0.011 0.019 D D
Vinyl chloride 39175 75–01–4 0.03 0.04 0.04 D
–
Trihalomethanes
Bromodichloromethane 32101 75–27–4 0.014 0.017 0.02 D D
Bromoform 32104 75–25–2 0.04 0.05 0.05 D –
Chloroform 32106 67–66–3 0.01 0.012 0.02 D D
Dibromochloromethane 32105 124–48–1 0.05 0.06 0.06 D –
Fumigants
Bromomethane 34413 74–83–9 0.1 0.18 0.2 D –
1,2-Dibromo-3-chloropropane
2
82625 96–12–8 0.17 0.17 0.5 D –
1,2-Dibromoethane
2
77651 106–93–4 0.018 0.02 0.025 D –
1,4-Dichlorobenzene 34571 106–46–7 0.01 0.017 0.02 D –
1,2-Dichloropropane 34541 78–87–5 0.01 0.013 0.015 D –
1,3-Dichloropropane 77173 142–28–9 0.03 0.03 0.03 – –
2,2-Dichloropropane 77170 594–20–7 0.02 0.03 0.03 – –
cis-1,3-Dichloropropene
34704 10061–01–5 0.02 0.03 0.05 – –
trans-1,3-Dichloropropene
34699 10061–02–6 0.04 0.05 0.07 – –
1,2,3-Trichloropropane 77443 96–18–4 0.06 0.06 0.09 D –
Gasoline oxygenates
Diethyl ether 81576 60–29–7 0.04 0.04 0.06 D –
Diisopropyl ether 81577 108–20–3 0.03 0.03 0.05
D –
Ethyl tert-butyl ether (ETBE)
50004 637–92–3 0.015 0.02 0.03 – –
Methyl tert-butyl ether (MTBE)
78032 1634–04–4 0.05 0.05 0.08 D –
Methyl tert-pentyl ether
50005 994–05–8 0.02 0.03 0.04 D –
Naturally occurring
Carbon disulde 77041 75–15–0 0.019 0.02 0.03 D D
Fire retardants
Bromochloromethane 77297 74–97–5 0.03 0.03 0.06 D –
Bromoethane 50002 593–60–2 0.05 0.06 0.06 – –

14 VOC Blank Data and Study Reporting Levels, California GAMA PBP, 2004–2010
Because the GAMA-PBP generally interprets patterns in
water quality from the perspective of an overall dataset—for
example, detection frequency is a property of a dataset—rather
than by considering individual samples, it is not necessary
to censor data based on avoidance of false negatives (Helsel,
2005). For any result, there is a 50-percent probability that
the true concentration will be greater than or equal to the
measured concentration and a 50-percent probability that
it will be less than or equal to the measured concentration.
In the absence of sources of contamination bias, at the
reporting limit, wherever it is set, the number of samples
with measured concentration less than the reporting limit
when the true concentration is greater than the reporting
limit (false negatives) is expected to be balanced by the
number of samples with measured concentration greater than
the reporting limit when the true concentration is less than
the reporting limit (false positives). Contamination would
impart a positive bias, further decreasing the probability of
false negatives. In contrast, it may be necessary to censor
data based on avoidance of false-positive detections because
contamination of groundwater samples during sample
collection, handling, or analysis results in positive bias in
concentrations and detection frequencies.
The issue of variability in LRLs for VOCs may be
addressed in different ways. Moran and others (2006) and
Zogorski and others (2006) censored VOC data collected for
the NAWQA Program by using a uniform assessment level
of 0.02 microgram per liter (µg/L). That concentration was
selected because most VOC detections in environmental
samples had concentrations greater than 0.02 µg/L, and many
of the LT-MDLs were less than 0.02 µg/L. The approach of
Moran and others (2006) and Zogorski and others (2006) has
the advantages of being simple to implement and leads to a
straightforward presentation of results. A second approach is
to censor data for each VOC constituent individually, selecting
the highest LT-MDL used for that VOC during the study
period and applying that LT-MDL as the SRL for that VOC if
no higher SRL is warranted. This approach has the advantages
of conforming to common statistical practices for dealing with
multiply censored datasets (Helsel, 2005), and preserving a
consistent threshold for an acceptable level of false-positive
detections for all constituents. This second approach is
evaluated in this report.
Data Analysis Methods
Groundwater samples were collected during 2004–2010
from the 32 GAMA-PBP study units by eld personnel of the
USGS California Water Science Center. These eld personnel
were a relatively constant group of people, and considerable
attention was given to oversight of eld activities and use
of consistent eld methods. Thus, systematic differences
among study units in patterns of contamination due to eld
activities were unlikely. The blanks from the 32 study units
were evaluated as if they were collected for one large study.
The Data Series Reports for the 32 individual study units
(table 1) include evaluation of VOC-blank data for the
individual study units. VOC data for groundwater samples
in a study unit may be censored on the basis of detections
in the eld blanks collected in that study unit. Because the
number of eld blanks collected in each study unit was
relatively small (3 to 12), censoring was generally based on
the highest concentration measured in the eld blanks. As a
result, censoring concentrations were different for different
study units, which may affect comparison of VOC detection
frequencies among study units. The data for all study units
were re-evaluated using the SRLs established in this report to
have uniform censoring levels for comparison among study
units. This re-evaluation was done during preparation of the
Scientic Investigations Reports that present the interpretation
of the status and understanding of groundwater quality in
individual study units or groups of study units.
Evaluation of VOC-blank data was done in three stages:
(1) identication of a set of representative quality-control
eld blanks (QCFBs) to be used for calculation of SRLs,
Table 2. Long-term method detection levels (LT-MDLs) used by the U.S. Geological Survey National Water Quality Laboratory for
volatile organic compounds (VOCs), and VOCs detected in groundwater samples and source-solution or field blanks, California GAMA
Priority Basin Project, May 2004 through September 2010.—Continued
[The ve-digit USGS parameter code is used to uniquely identify a specic constituent or property in USGS databases and reports. Abbreviations: µg/L,
micrograms per liter; D, detected; –, not detected]
Constituent
USGS
parameter
code
CAS number
1
LT-MDL values (µg/L) Detected
Minimum Median Maximum
Ground-
water
Blanks
Refrigerants
Chloromethane 34418 74–87–3 0.05 0.07 0.09 D –
Dichlorodiuoromethane 34668 75–71–8 0.05 0.07 0.09 D –
Trichlorouoromethane 34488 75–69–4 0.04 0.04 0.08 D D
1,1,2-Trichloro-1,2,2-triuoroethane 77652 76–13–1 0.017 0.019 0.02 D –
1
1,2-Dibromo-3-chloropropane (DBCP) and 1,2-dibromoethane (EDB) also were analyzed using NWQL Schedule 1306, Low-Level Fumigants, in some
study units. The LT-MDLs listed here are for Schedule 2020.

Methods Used to Collect and Evaluate VOC Data 15
(2) evaluation of potential sources of extrinsic contamination
to blanks and groundwater samples, and (3) selection of
appropriate SRLs for VOCs detected in eld blanks, and
application of those SRLs to the groundwater data.
Identification of Representative Field Blanks
Field blanks are collected by using procedures designed
to mimic those used to collect the groundwater samples,
and thus are expected to be representative of the potential
sources of contamination to the groundwater samples. Small
differences between the collection methods for eld blanks
and groundwater samples, however, may result in exposure
of eld blanks to sources and processes of contamination that
are different from those of the groundwater samples (table 3).
Field blanks contaminated by sources and processes not likely
to affect groundwater samples might not be representative
of the conditions under which groundwater samples were
collected; therefore those blanks should not be used in
determination of SRLs. To identify a set of representative
QCFBs to be used for calculation of SRLs, several questions
needed to be answered to determine if eld blanks were
representative of conditions under which groundwater samples
were collected:
• Can the source of contamination be isolated to
the certied blank water itself? Compounds with
detections reported in the certicates of analysis
provided by the NWQL may have a source of
contamination that is not representative of sources
of contamination to groundwater samples. Many
previous QC assessments have assumed that detections
of compounds in source-solution blanks indicate
contamination by processes not representative
of groundwater samples. However, this may be
an incorrect assumption because source-solution
blanks are processed with several of the same
steps as groundwater samples: contact with vials,
transportation from the eld site to the laboratory, and
laboratory analytical processes (table 3). In this study,
contamination of the certied blank water itself is
assessed with the certicates of analysis. Field blanks
with detections of compounds that could be attributed
to contamination of the certied blank water itself are
not considered representative of groundwater sample
collection conditions for those compounds.
• Is the contamination of eld blanks the result of a
mechanism that is unlikely to affect groundwater
samples? The differences in sample collection
and handling methods between eld blanks and
environmental samples (for example, the use of the
peristaltic pump; table 3) may result in eld blanks
being exposed to potential sources of contamination
that environmental samples do not encounter. In these
cases, the eld blanks may not be representative.
• Can the SRL approach be used to address extrinsic
contamination for the constituent? There are two
general patterns of extrinsic contamination. For many
constituents, contamination results in environmental
samples and eld blanks being contaminated with a
small amount of the constituent. The mechanism of
contamination may be equally likely to affect eld
blanks and environmental samples, or it may be more
likely to affect eld blanks (higher detection frequency
in eld blanks). In both cases, the concentrations of the
constituent imparted to the samples by contamination
are relatively low and similar in both sample types.
The SRL approach can effectively be applied in these
cases because a threshold concentration can be dened;
above that threshold, the probability that detections
in environmental samples are due to extrinsic
contamination is acceptably low. In contrast, for other
constituents, contamination results in environmental
samples and eld blanks being contaminated with
either large or small amounts of the constituent.
Contaminated environmental samples and eld blanks
may have higher concentrations of the constituent than
present in uncontaminated environmental samples.
In this case, the SRL approach cannot be effectively
applied because there is no threshold concentration
above which concentrations in environmental samples
can be considered representative of environmental
conditions; the probability of extrinsic contamination
in those samples is not acceptably low.
• Are eld blanks collected with one sampling equipment
conguration representative of conditions under which
groundwater samples are collected with a different
sampling equipment conguration? Contamination
of eld blanks and groundwater samples may occur
at many steps in the sequence of sample collection,
handling, and analysis (table 3). Many of these steps
are the same for samples collected with different
sampling equipment congurations: for example,
all samples come into contact with sample vials, are
transported from the eld site to the laboratory, and
are analyzed in the laboratory. If contamination is
related to contact with sample-collection equipment,
it is possible that samples collected with different
sample-collection equipment congurations may be
subject to contamination by the same process, but
to different degrees. Because contamination with
different VOCs may occur by different mechanisms,
eld blanks collected with one sampling equipment
conguration may be representative of conditions
under which groundwater samples were collected
with different sampling equipment congurations
for some VOCs, but not for others. Statistical tests
were used to determine signicances of differences
between eld blanks collected with different
equipment congurations.

16 VOC Blank Data and Study Reporting Levels, California GAMA PBP, 2004–2010
Definition of Study Reporting Levels (SRLs)
Four potential SRL values were dened for each VOC
using three approaches for making quantitative estimates of
contamination using the QCFBs: two potential SRL values
were dened using a binomial probability method based on
one-sided, nonparametric upper condence limits (Hahn and
Meeker, 1991), one was dened as equal to the maximum
concentration detected in the eld blanks, and one was dened
as the maximum laboratory method detection level used
during the period samples were analyzed for the project. These
four SRL values were compared, and one value was selected
for each VOC as the SRL for use with GAMA groundwater
data. The SRL is equivalent to a raised reporting limit that
can be used in place of the LRL or LT-MDL to reduce the
probability of reporting false positives.
Binomial Probability Approach
The rst approach for quantitative assessment of blank
data is based on binomial probabilities and rank-order
statistics. A desired probability of reporting results for
groundwater samples without false-positive detections and
a condence level in that probability are dened, then the
binomial distribution is used to calculate the number of eld
blanks in a set of eld blanks that must be uncontaminated
in order to meet the criteria of the desired probability and
condence level (Martin and others, 1999; Olsen and others,
2010; Bender and others, 2011). If more than the allowed
number of eld blanks in the set show contamination, then
an SRL can be dened by using the ranked concentrations of
the eld blanks. This approach assumes that contamination
has a characteristic concentration, which is generally a range
of concentrations that is lower than those observed in the
majority of the groundwater samples.
Table 3. Identification of steps in collection, handling, and analysis of blanks and groundwater samples during which contamination
may occur, California GAMA Priority Basin Project.
[Field blanks and groundwater samples were collected with three equipment congurations: short lines (18-inch Teon sampling line, collection at well head),
long lines (25-foot sampling line routed inside mobile lab), monitoring-well equipment (monitoring-well pump plus 25-foot sampling line routed inside mobile
lab). Abbreviations: all, process applies to all samples of that type; some, process applies to some samples of that type; –, process applies to no samples of that
type]
Process
Laboratory
instrument
blanks
Source-
solution
blanks
Field blanks Groundwater samples
Short
lines
Long
lines
Monitoring
well
Short
lines
Long
lines
Monitoring
well
Certified blank water
Laboratory production all all all all all – – –
Bottling – all all all all – – –
Transit from laboratory to eld site – all all all all – – –
Vials
Manufacture and packaging all all all all all all all all
Storage and bottle set preparation – all all all all all all all
Transit to eld site – all all all all all all all
Field collection
Peristaltic pump – – some all – – – –
Monitoring-well pump and ttings – – – – all – – all
Extra ttings between lines and well – – – – – some some –
Contact with long lines and manifold – – – all all – all all
Contact with short lines – – all – – all – –
Transit of equipment to eld site – – all all all all all all
Conditions at eld site –
all all all all all all all
Conditions in eld vehicle – all all all all all all all
Post-collection
Packing and storage – all all all all all all all
Transit from eld site to laboratory – all all all all all all all
Laboratory handling and analysis all all all all all all all all

Methods Used to Collect and Evaluate VOC Data 17
The binomial distribution assigns a probability to
achieving a given number of successes in a given number
of trials:
( )
( )
( )
where
is the number of trials (the total number of
field blanks collected),
is the number of successes (the number of
uncontaminated f
!
i
; ,
eld blanks collected),
is the probability
1
!!
nk
k
n
k
p
n
bkn p p p
knk
−
= −
−
of success in each trial
(the probability of collecting any one
groundwater sample or field blank without
contamination), and
is the probability of achieving successes in
trials (the probability of
bk
n collecting
uncontaminated field blanks in a total of
field blanks collected).
k
n
(2)
The probability that there will be at least k uncontaminated
eld blanks among the n eld blanks collected is the
cumulative probability:
( )
( )
( )
k
k0
!
; , 1
!!
.
nk
k
n
bkn p p p
knk
−
=
= −
−
∑∑
(3)
Hahn and Meeker (1991) describe a method for
determining which ranked eld blank corresponds most
closely to the upper condence limit for a given percentile of
a set of observations at a given percent of condence. In the
terminology used in this report, the “given percentile of a set
of observations” corresponds to p, and the “upper condence
limit” corresponds to
b
∑
. The 90
th
, 95
th
, and 99
th
percentiles
and 90- and 95-percent condence limits are commonly
used in QC assessments. Note that the method used by Hahn
and Meeker (1991) for calculating the condence interval
is one of many methods, and a more appropriate condence
interval to use may be the Jeffreys interval (Agresti and Coull,
1998; Brown and others, 2001; Belitz and others, 2010).
For a small number of samples, the difference between the
Jeffreys interval and the interval used by Hahn and Meeker
is signicant. Using the Jeffreys interval to select the ranked
eld blank corresponding to the upper condence limit may
result in selection of a lower rank than would the interval used
by Hahn and Meeker; thus, the Jeffreys interval may yield an
SRL with a lower concentration. For the number of blanks
used in this report, the difference is not signicant.
Martin and others (1999), Olsen and others (2010),
and Bender and others (2011) apply Hahn and Meeker’s
method to determine the rank of the eld blank corresponding
to, for example, the 90
th
percentile with at least 90-percent
condence. There is at least a 90-percent condence that
the contamination in at least 90 percent of all samples is
less than the concentration in the eld blank with this rank.
For ease of discussion, this concentration is referred to as
the “BD-percentile/condence” concentration, where BD
means binomial distribution, the rst number is the percentile
of interest, and the second number is the percentage of
condence (Olsen and others, 2010). Because ranks are
discrete quantities, for a given percentage of condence, the
percentile depends on the number of samples. For example,
for datasets of 10, 100, and 1,000 eld blanks, the BD-90/90
corresponds to the 98.2, 94.1, and 91.5 percentiles of the
datasets, respectively.
BD-95/90 and BD-90/90 concentrations were calculated
for the sets of representative eld blanks and source-solution
blanks, and BD-99/90 concentrations were calculated for the
set of laboratory blanks. For the dataset of 167 eld blanks
used to dene SRLs in this study, the BD-90/90 would be the
156
th
ranked blank, corresponding to the 92.8 percentile of the
dataset, and the BD-95/90 would be the 163
rd
ranked blank,
corresponding to the 97.0 percentile of the dataset.
Calculations were made using the BINOM.DIST function in
Microsoft Excel 2007, which takes the form:
. ( _, ,
_, )
where
is the confidence limit (90 percent);
_ is the number of successes in trials, in
this case, the specified rank minus 1,
where blanks ar
CL BINOM DIST number s trials
probability s cumulative
CL
number s
=
e ranked from highest
to lowest concentration with the highest
concentration assigned a rank equal to
the total number of blanks;
is the number of trials, in this case, the
total number of blanks;
trials
p _ is the percentile of interest (0.90, 0.95,
or 0.99); and
is a logical value that determines the form
of the function, in this case TRUE, such
that BINOM.DIST returns the cumulative
d
robability s
cumulative
istribution function, which is the
probability that there are _ or
fewer successes.
number s
(4)

18 VOC Blank Data and Study Reporting Levels, California GAMA PBP, 2004–2010
Maximum Concentration Approach
The next quantitative approach we consider is dening
the maximum concentration measured in eld blanks as
the SRL. This type of method commonly is used in studies
for which the number of blanks collected is too small for
meaningful statistically-based assessments. For example,
the number of eld blanks collected in each GAMA study
unit ranged from 3 to 12, which is an insufcient number
to dene a BD-95/90 or even a BD-90/90 concentration for
an individual study unit. Twenty-two eld blanks would be
needed for the highest concentration blank to correspond to
the BD-90/90 concentration; a minimum of 45 eld blanks
would be needed to dene a BD-95/90 concentration. In
the absence of other ways of dening an SRL, the highest
concentration measured in the eld blanks was considered
representative of the amount of extrinsic contamination likely
to occur in environmental samples. One could make a more
conservative estimate by dening the SRL at 5 to 10 times the
highest concentration measured in eld blanks (for example,
Nowell and others, 2011).
The probability that the maximum concentration
measured in a set of eld blanks is the maximum
concentration in the theoretical population of all eld blanks
may be estimated based on binomial probabilities (Hahn
and Meeker, 1991; Helsel, 2005). The estimate used in this
report is the Jeffreys interval (Belitz and others, 2010). If
10 eld blanks are collected, the probability that the maximum
measured concentration is the true maximum concentration
is between 72 and 100 percent, at a 90-percent condence
level. If 100 eld blanks are collected, then the probability
is between 96.9 and 100 percent, and if 1,000 eld blanks
are collected, then the probability is between 99.7 and
100 percent. The larger the number of eld blanks collected,
the greater the probability that the highest concentration
measured in the eld blanks is representative of the highest
concentration in the theoretical population of all eld blanks.
Maximum LT-MDL Approach
The last approach considered is dening the highest
LT-MDL used during the period samples were analyzed for
the project (May 2004 through September 2010) as the SRL.
As discussed in the section “Laboratory Methods,” using
the highest LT-MDL as a censoring threshold is common
statistical practice for dealing with multiple censored datasets
(Helsel, 2005) and may preserve a consistent threshold
for acceptable level of false-positive detections for all
constituents. For VOCs detected in eld blanks, using the
highest LT-MDL as the SRL may provide sufcient protection
against false positives if the positive bias associated with
extrinsic contamination is small.
Evaluation of Potential Sources of
Contamination to Blanks and Groundwater
Samples and Selection of Appropriate SRLs
Potential sources of contamination to blanks and
groundwater samples primarily were evaluated by comparing
detection frequencies of individual VOCs in various groups
of blanks and samples. Contamination may occur at many
points in the collection, handling, and analysis of blanks
and groundwater samples (table 3). Laboratory instrument
blanks, source-solution blanks, eld blanks collected with
different equipment congurations, and groundwater samples
collected with different equipment congurations are
exposed to different combinations of these potential points
of contamination. These points may be divided into four
categories: the certied blank water, the vials, eld collection
processes, and post-collection handling and analysis (table 3).
Inferences of contamination mechanisms at each point were
based on knowledge of physio-chemical properties of VOCs
and knowledge of eld and laboratory practices.
Laboratory instrument, source-solution, and eld blanks
all use the same certied blank water, but the water used for
the source-solution and eld blanks may have been exposed
to sources of contamination associated with bottling the water
or with shipping and storing the bottles between the bottling
site at the laboratory and the eld site. All three types of
blanks and the groundwater samples are collected in the same
type of vials. The water for laboratory instrument blanks and
source-solution blanks is poured directly into the vials. Vials
for eld blanks and groundwater samples are lled by putting
the sampling line down to the bottom of the vial and allowing
at least three vial volumes to overow before withdrawing
the sampling line. The vials used for source-solution and
eld blanks or groundwater samples also may be subject
to contamination during storage, packing of bottle sets in
preparation for sampling, or transit to the eld site.
Source-solution blanks, eld blanks, and groundwater
samples all are exposed to the ambient conditions in the eld
vehicle and at the eld site, although the degree of potential
inuence by the ambient conditions may vary depending on
whether the sample is collected inside the vehicle or at the
well head, and on which sampling vehicle is used. The same
equipment is used to collect eld blanks and groundwater
samples—with the exception of the peristaltic pump that is
only used for eld blanks and specialized ttings that may
be used to fabricate a sampling point on the well head—and
all the equipment travels to the eld site. Sample-collection
equipment is cleaned using the same methods before
collection of eld blanks and groundwater samples, but there
may be differences between equipment congurations because
short sampling lines generally are cleaned in the laboratory
and the long sampling lines and monitoring-well equipment
generally are cleaned at eld sites. Samples collected with
the three equipment congurations have different amounts
Methods Used to Collect and Evaluate VOC Data 19
of contact with sampling lines (less contact with short
sampling lines and more contact with long sampling lines and
monitoring-well equipment), and the amount of water ushed
through the lines prior to sample collection generally is greater
for groundwater samples than for eld blanks. Source-solution
blanks, eld blanks, and groundwater samples are packed,
stored, and shipped together from the eld site to the
laboratory. All three types of blanks and groundwater samples
are analyzed with the same equipment in the laboratory.
The points of possible contamination of blanks and
groundwater samples are inferred by comparing detections in
different types of samples by using nonparametric statistical
tests. For example, if the detection frequency of a VOC in
source-solution blanks is greater than in eld blanks, one
of the sources of contamination to source-solution blanks
must be something that is less likely to affect eld blanks.
Both use the same certied blank water and experience
the same post-collection handling and analysis, but eld
blanks have more contact with sample-collection equipment
than do source-solution blanks. That leaves the vials as the
likely explanation for higher detection frequency in the
source-solution blanks, which is plausible, given the difference
in how vials are lled for source-solution blanks and eld
blanks. Note that the inference that source-solution blanks may
be contaminated by the vials does not imply that eld blanks
do not get contaminated by the vials; both types of blanks may
be contaminated by this mechanism, but contamination of the
source-solution blanks is more likely.
Potential points of contamination are evaluated separately
for the 18 VOCs detected in source-solution blanks and eld
blanks. Comparison of inferred points of contamination for
different VOCs aids in inference of contamination mechanism,
which in turn, aids in selection of appropriate SRLs. For
example, if the detection frequency of a VOC is greater in
eld blanks than in source-solution blanks, and greater in
eld blanks collected with long sampling lines compared
to short sampling lines, one might infer that the point of
contamination is contact with sampling lines. If concentrations
in eld blanks and groundwater samples are similar, one might
further infer that the eld blanks and groundwater samples
both may be contaminated with similar amounts of the VOC
by contact with sampling lines, and therefore, selection of
an SRL yielding extensive censoring of the groundwater
data may be most appropriate. In contrast, if no plausible
point of contamination can be inferred from the data, and
concentrations detected in eld blanks are low compared to
concentrations detected in groundwater samples, selection of
an SRL yielding little or no censoring of the groundwater data
may be most appropriate.
The binomial probability approach, BD-95/90, was
considered the default approach for determining SRLs in this
study. The SRL derived from the BD-95/90 was used unless
evaluation of the potential sources of extrinsic contamination
indicated that an SRL resulting in more or less censoring of
the groundwater data than the BD-95/90 SRL was appropriate.
The BD-95/90, rather than the BD-90/90, was chosen in
order to restrict the acceptable probability of false-positive
detections. Selecting the BD-95/90 as the SRL is equivalent to
dening an acceptable probability of false-positive detections
in eld blanks of approximately 3 percent, whereas selecting
the BD-90/90 as the SRL would be equivalent to dening
an acceptable probability of false-positive detections in eld
blanks of approximately 7 percent.
Statistical Tests Used in Identification of
Representative Field Blanks and Evaluation to
Infer Potential Sources of Contamination
Nonparametric statistical methods were used to test
the signicance of differences in detection frequencies or
concentrations of a VOC between groups of samples, and
of correlations between concentrations of different VOCs.
Nonparametric statistics are robust techniques that generally
are not affected by outliers and do not require that the data
follow any particular distribution (Helsel and Hirsch, 2002).
The signicance level (p) used for hypothesis testing for this
report was compared to a threshold value (α) of 5 percent
(α = 0.05) to evaluate whether the relation was statistically
signicant (p < α). Correlation between concentrations
of different compounds was evaluated using Spearman’s
method to calculate the rank-order coefcient (ρ, rho) and the
signicance level of the correlation (p).
Signicance of differences between concentrations of a
single compound between two sample groups was evaluated
by using the Wilcoxon rank-sum test. The null hypothesis
for the test is that median values of concentration in the
two groups are not signicantly different from one another.
Signicance of differences between three or more sample
groups was evaluated in two stages: the Kruskal-Wallis
test, followed by Tukey’s multiple comparison test if the
Kruskal-Wallis test yielded a result of signicance (Helsel
and Hirsch, 2002). The Kruskal-Wallis test evaluates whether
any of the groups has a signicantly different median
concentration than the others, but does not indicate which
group is different. The Tukey’s multiple comparison test is
performed on the rank-transformed concentration data.
Signicance of differences between detection frequencies
of a single VOC between two sample groups was evaluated
by using contingency tables. For a contingency table
analysis, the data are recorded as a matrix of counts. One
variable is assigned to the columns and the other to the rows,
and the entries in the cells of the matrix are the number of
observations, O
ij
, which fall into the i
th
row and j
th
column
of the matrix. A test statistic is computed by comparing
the observed counts (O
ij
) to the counts expected if the two
variables were independent, and signicance is determined
by comparing the test statistic to the (1 – α) quantile of a
chi-squared distribution.

20 VOC Blank Data and Study Reporting Levels, California GAMA PBP, 2004–2010
Quality-Control Assessment Results
Of the 85 VOCs analyzed, 18 were detected in eld
blanks or source-solution blanks, and 67 were not detected
(table 2). The VOCs detected in blanks may be divided into
three groups:
Hydrocarbons Solvents Other VOCs
Benzene acetone bromodichloromethane
Ethylbenzene 2-butanone carbon disulde
Styrene 1,1-dichloroethene chloroform
Toluene dichloromethane trichlorouoromethane
1,2,4-trimethylbenzene tetrachloroethene
m- and p-xylenes tetrahydrofuran
o-xylene
trichloroethene
Field blanks collected for the GAMA Program contained
a similar set of VOC contaminants as eld blanks collected
at groundwater sites by the USGS NAWQA Program, which
uses similar eld collection, sample handling, and laboratory
methods. Eleven VOCs were detected with frequencies
greater than 5 percent in NAWQA eld blanks collected at
production wells: the hydrocarbons benzene, ethylbenzene,
toluene, 1,2,4-trimethylbenzene, styrene, m- and p-xylenes,
and o-xylene; the solvents acetone and dichloromethane;
and the other VOCs carbon disulde and chloroform (g. 3;
Bender and others, 2011). VOCs detected at greater than
5-percent detection frequency in NAWQA eld blanks
collected at monitoring wells included the 11 detected in
eld blanks from production wells, plus tetrahydrofuran,
2-butanone (methyl ethyl ketone, MEK), 1,4-dichlorobenzene,
chlorobenzene, 1,2-dichloropropane, tetrachloroethene,
bromodichloromethane, and chloromethane. Of these
19 VOCs, 15 were detected in GAMA eld blanks, but only
7 (ethylbenzene, toluene, 1,2,4-trimethylbenzene, m- and
p-xylenes, o-xylene, acetone, and 2-butanone) had detection
frequencies greater than 5 percent (table 4; g. 3). Thiros and
others (2011) suggested that the high detection frequencies
of VOCs in eld blanks collected for the NAWQA Program
may have been due to eld crews inconsistently following
protocols, particularly failure to use the recommended volume
of blank water to rinse sample-collection equipment prior to
collection of eld blanks.
Identification of VOCs for Which the SRL
Approach Can be Applied and of Representative
Quality-Control Field Blanks (QCFBs) for Use in
Calculation of SRLs
The process of identifying a set of representative QCFBs
to be used for calculation of SRLs yielded three results:
(1) the certied blank water itself contributed minimally to
contamination of eld blanks, (2) the SRL approach cannot
be applied to contamination by acetone, 2-butanone, or
tetrahydrofuran, and (3) eld blanks collected with long and
short sampling lines can be combined for the purposes of
generating the set of QCFBs for use in calculation of SRLs.
Minimal Contamination from the Certified
Blank Water
Between May 2004 and September 2010, 12 lots of
certied blank water were available for purchase from the
NWQL (universal blank water, lot numbers 80301, 80401, and
80501; organic blank water, lot numbers 80601, 80606, 80702,
80801, 80803, 80804, 80901, 81002, and 81004). Certicates
of analysis for these lots of certied blank water are available
from the USGS NWQL (http://wwwnwql.cr.usgs.gov/qas.
shtml?obw). Eleven of the 12 lots had certicates of analysis
indicating that no VOCs were detected. Lot 80301 was the
only lot with two certicates of analysis—one produced at the
beginning and one produced at the end of the time period it
was available for purchase (all other lots only had certicates
produced at the beginning). The second certicate for lot
80301 (February 2004) reported acetone at a concentration
of 2.2 µg/L; the LT-MDL in effect during February 2004
was 3 µg/L.
On the basis of the certicates of analysis, certied blank
water may have been a potential source of contamination of
eld blanks or source-solution blanks by acetone, but not for
any of the other VOCs. For the other 17 VOCs detected in
eld blanks or source-solution blanks, processes or conditions
encountered at the eld site, during shipping or storage of
blank water or vials or samples, or at the laboratory must have
been responsible for introducing the VOCs into the blanks.
Acetone, 2-Butanone, and Tetrahydrofuran
Contamination Associated with Methanol
The VOCs associated with the methanol used to clean
eld equipment provide an example of contamination to which
the SRL approach cannot effectively be applied. Moreover,
some of the inferred mechanisms by which eld blanks
may be contaminated by methanol are unlikely to affect
groundwater samples.
Inadvertent Field Test of Contamination by Methanol
The pattern of VOC detections observed in the eld blank
collected on June 25, 2007, led to an unusual opportunity to
demonstrate the importance of the rigorous procedures for
cleaning equipment after samples are collected (Fram and
others, 2009). During sampling, three vials are lled in the
eld for each VOC sample or blank, and the laboratory (the
NWQL) randomly selects one to be analyzed for VOCs and
reserves the other two for reruns that may be necessary if there
are problems with the analysis of the rst vial or if the project

Quality-Control Assessment Results 21
Table 4. Detection frequencies in field, source-solution, and laboratory blanks and in groundwater samples for the 18 volatile organic
compounds (VOCs) and tentatively identified compounds (TICs) detected in field or source-solution blanks, California GAMA Program,
Priority Basin Project, May 2004 through September 2010.
[Quality-control eld blanks (QCFBs) are a subset of all eld blanks and consist of the eld blanks collected at production wells and inferred not to be
contaminated with the methanol used to clean equipment. Abbreviations: n, number]
Detection frequency (percent)
Field blanks
Source-
solution
blanks
(n = 109)
Laboratory
blanks
(n = 2,411)
Groundwater samples
All
(n = 211)
Production
well
(n = 189)
Monitoring
well
(n = 22)
QCFB
(n = 167)
All
(n = 2,026)
Production
well
(n = 1,859)
Monitoring
well
(n = 167)
Hydrocarbons
Benzene 1.4 1.1 4.5 0 0 1.6 1.6 1.2 6.0
Ethylbenzene 10 10 14 6.0 1.8 0.1 0.9 0.6 4.2
Styrene 2.4 2.6 0 0 0 0.2 0.1 0.2 0
Toluene 36 33 59 28 41 4.2 7.7 6.0 26
1,2,4-Trimethylbenzene 7.1 5.8 18 6.0 6.4 0.1 11 11 8.4
m- and p-Xylenes
15 14 27 9.0 6.4 0.04 1.9 1.2 9.6
o-Xylene
9.5 9.0 14 5.4 1.8 0.04 0.7 0.4 4.2
Solvents
Acetone 9.5 7.9 23 1.2 5.5 2.1 0.4 0.3 1.8
2-Butanone 9.5 9.0 14 0 0.9 0.04 0.4 0.3 2.4
1,1-Dichloroethene 0 0 0 0 0.9 0 3.4 3.6 0.6
Dichloromethane 1.9 2.1 0 0.6 0.9 0.7 1.5 1.5 1.2
Tetrachloroethene 1.9 1.6 4.5 1.8 0 0.1 13 13 6.6
Tetrahydrofuran 0.9 0.5 4.5 0 0 0.04 1.2
0.8 5.4
Trichloroethene 1.4 1.1 4.5 0.6 0 0.7 6.2 6.7 1.2
Other VOCs
Bromodichloromethane 0.5 0.5 0 0 0 0 6.3 6.7 2.4
Carbon disulde 2.8 3.2 0 3.0 3.7 1.6 4.3 3.8 9.6
Chloroform 4.7 2.6 23 1.8 0.9 0.2 27 27 18
Trichlorouoromethane 0.5 0.5 0 0.6 0.9 0 2.0 2.2 0
TICs 17 11 73 6.0 19 0.7 14 13 31
(GAMA) requests a rerun to verify a result. Under normal
circumstances, the three vials collected for a sample or a blank
would yield comparable results. Highly unusual conditions
occurred when the June 25, 2007, eld blank was collected
and resulted in the three vials having markedly different
VOC results.
In the eld notes for the site at which the unusual eld
blank was collected, the eld crew recorded that they thought
they might not have rinsed the peristaltic pump used to pump
the blank water from the source bottles through the sampling
equipment and into the sample vials for the eld blank after
the cleaning steps, which usually involve a methanol wash
(which was done) and blank-water rinse (which was likely
omitted). The three VOC vials for the eld blank were the
rst sample containers to be lled during sample collection;
therefore, the VOC results from the rst of these vials would
be the most affected by any contaminants from residual
methanol in the lines or pump. The collection order was not
marked on the three vials.
The NWQL notied GAMA project staff upon noticing a
high number of VOC detections and an unusual chromatogram
for this eld blank. Information in the eld notes led to a
hypothesis that residual methanol may have been the source,
and the remaining two vials were analyzed to test this
hypothesis. Methanol is a polar organic solvent and would be
expected to readily dissolve other polar organic compounds
(if present), as well as (to a lesser degree) less polar and
nonpolar organic compounds. Although the methanol used for
cleaning is labeled as 99.9 percent pure, this level of purity
does not preclude the presence of other organic constituents at
microgram-per-liter concentrations. In addition, methanol may
be exposed to airborne contaminants while being transferred
into the containers used to transport and store it safely in
eld vehicles and mobile laboratories, and while being used
for cleaning. Thus, the methanol likely had opportunities to
accumulate organic contaminants.
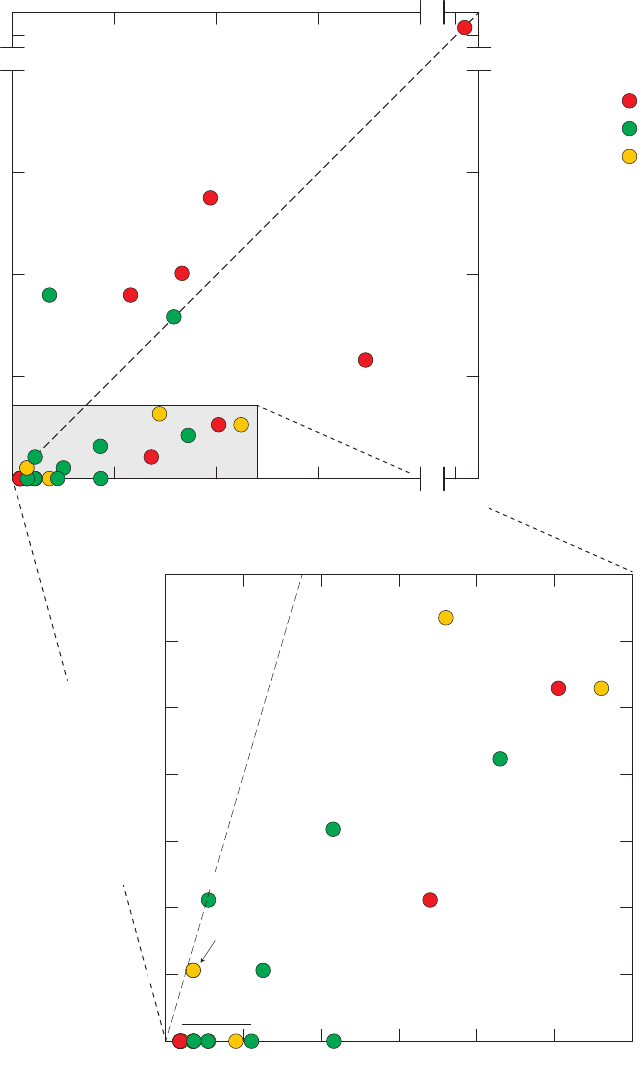
22 VOC Blank Data and Study Reporting Levels, California GAMA PBP, 2004–2010
IP031454_Figure 03a. compare
GAMA production well field blanks,
detection frequency, in percent
0
5
10
15
20
25
40
0 5 10 15 20 25 40
1:1 line
toluene
m- and p-xylenes
1,2,4-trimethylbenzene
ethylbenzene
o-xylene
acetone
2-butanone
*VOCs in descending order of detection frequency in
NAWQA production well field blanks: 1,4-dichlorobenzene,
1,2-dichloropropane, methyl isobutyl ketone,
1,2-dichloroethane, trichlorotrifluoromethane, dichlorodi-
fluoromethane, 1,1,1-trichloroethane, methyl tert-butyl
ether, napthalene, 1,2,3-trimethylbenzene, 2-ethyltoluene.
0
0.5
1.0
1.5
2.0
2.5
3.0
3.5
0 2 4 6 8 10 12
1:1 line
chloroform
dichloromethane
carbon disulfide
benzene
tetrachloroethene
styrene
trichloroethene
tetrahydrofuran
bromodichloromethane
trichlorofluoromethane
chloromethane
*
GAMA: 189 field blanks collected with long or short
sampling lines (includes 22 field blanks having
evidence for contamination with methanol during
collection)
NAWQA: 278 field blanks collected at domestic and
public-supply wells (Bender and others, 2011)
A
NAWQA production well field blanks,
detection frequency, in percent
GAMA production well field blanks,
detection frequency, in percent
EXPLANATION
Hydrocarbons
Solvents
Other VOCs
NAWQA production well field blanks,
detection frequency, in percent
Figure 3. Detection frequencies in field blanks collected at production wells by the National Water-Quality Assessment
(NAWQA) Program and detection frequencies in (A) all field blanks collected with long and short sampling lines by the
GAMA Priority Basin Project, and (B) quality-control field blanks (QCFBs) collected with long and short sampling lines and
inferred to be without contamination by the methanol used to clean field equipment.
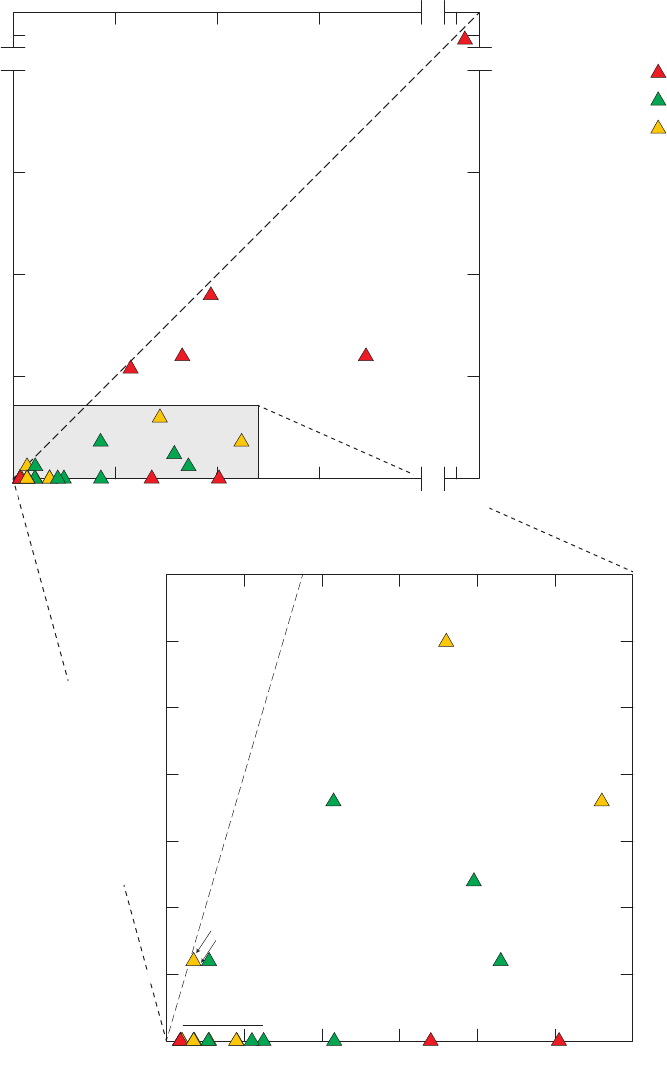
Quality-Control Assessment Results 23
IP031454_Figure 03b. compare QCFB
*VOCs in descending order of detection frequency
in NAWQA production well field blanks:
tetrahydrofuran, 2-butanone,1,4-dichlorobenzene,
1,2-dichloropropane, methyl isobutyl ketone,
1,2-dichloroethane, trichlorotrifluoromethane,
dichlorodifluoromethane, 1,1,1-trichloroethane,
methyl tert-butyl ether, napthalene,
1,2,3-trimethylbenzene, 2-ethyltoluene.
GAMA: 167 field blanks collected with long or
short sampling lines and having no evidence of
contamination by methanol (QCFBs)
NAWQA: 278 field blanks collected at domestic
and public-supply wells (Bender and others, 2011)
EXPLANATION
GAMA production well field blanks,
detection frequency, in percent
0
5
10
15
20
25
40
0 5 10 15 20 25 40
1:1 line
0
0.5
1.0
1.5
2.0
2.5
3.0
3.5
0 2 4 6 8 10 12
1:1 line
B
NAWQA production well field blanks,
detection frequency, in percent
GAMA production well field blanks,
detection frequency, in percent
Hydrocarbons
Solvents
Other VOCs
NAWQA production well field blanks,
detection frequency, in percent
chloroform
dichloromethane
carbon disulfide
benzene
tetrachloroethene
styrene
acetone
chloromethane
trichloroethene
bromodichloromethane
trichlorofluoromethane
*
toluene
m- and p-xylenes
1,2,4-trimethylbenzene
ethylbenzene
o-xylene
Figure 3.—Continued

24 VOC Blank Data and Study Reporting Levels, California GAMA PBP, 2004–2010
Analyses of the three vials yielded different results.
For the purposes of discussion, the vials were numbered
based on the size of an unusually broad peak present on
the chromatograms for all three vials from this eld blank
(g. 4); this peak generally is not present on chromatograms
for groundwater or surface-water samples (Donna Rose,
U.S. Geological Survey National Water Quality Laboratory,
written commun., 2007). On the basis of comparison between
retention times for identied VOCs on the chromatogram and
retention times for a larger suite of VOCs (J&W Scientic,
1998), this large, broad peak was inferred to correspond to
methanol. This inferred methanol peak was not identied
on the basis of the mass spectra because of the masses of
the primary ions that would be produced from methanol are
below the range of masses scanned by the mass spectrometer
(Connor and others, 1998).
Results for the rst, second, and third vials showed a
progressive decrease in the number and concentration of
VOCs detected (table 5). Three solvents (2-butanone, acetone,
and tetrahydrofuran) were detected in the rst and second
vials, and only 2-butanone was detected in the third vial
(table 5). These three solvents are polar organic compounds
with high solubility in methanol and relatively high vapor
pressures. The methanol purchased for cleaning is certied
99.9 percent pure methanol, with a maximum of 0.001 percent
carbonyl compounds, which means that the methanol
could have as much as a total of 10,000 µg/L of carbonyl
compounds, such as acetone and 2-butanone. In addition,
2-butanone, acetone, and tetrahydrofuran are components of
common products, including PVC cement, varnishes, and
cleaners, that may be encountered in the eld. Thus, it is not
unexpected to nd these constituents as contaminants in the
methanol carried by the mobile laboratories.
In addition, the NWQL reported an unusually high
number of tentatively identied compounds (TIC) in the
chromatogram of the rst vial, and fewer TICs in the
chromatograms for the second and third vials (table 5). TICs
are constituents not included in the 85 VOCs analyzed on
NWQL schedule 2020. TICs are tentatively identied on the
basis on their retention times and their mass spectra. The
presence of a large number of TICs suggests some VOCs in
the sample may have come from a source that usually does not
contribute VOCs to groundwater or surface-water samples.
NWQL schedule 2020 was designed to include most VOCs
encountered in groundwater or surface-water samples (Connor
and others, 1998).
Thiros and others (2011) report similar results for VOC
contamination in blanks collected after insufcient rinsing of
eld sample-collection equipment. Field and equipment blanks
contaminated with methanol contained high concentrations of
acetone, 2-butanone, and tetrahydrofuran (8–800 µg/L), low
concentrations of hydrocarbons (less than 1 µg/L), and a high
number of TICs.
On the basis of these results, residual methanol from
cleaning of equipment was inferred to be the source of the
VOC detections in the three vials of the June 25, 2007, eld
blank. The progressive changes in the size of the inferred
methanol peak, the number of TICs, and the number and
concentration of VOCs detected from the rst to the second
to the third vial are inferred to reect the progressive
decrease in the amount of methanol in the blank water as
the pump was ushed with more blank water. (Results from
the third vial were used to represent the eld blank and
are included in table A2.) The association of 2-butanone,
acetone, tetrahydrofuran, and TICs appears to be indicative of
contamination of eld blanks with residual methanol used for
cleaning of equipment.
Rinsing of eld equipment during collection of a eld
blank appears sufcient to prevent methanol contamination
of a groundwater sample collected immediately following
collection of a eld blank contaminated with methanol. The
volume of blank water passing through the pump during
collection of the three VOC vials was less than 1 liter; thus,
the progressive decrease in the amount of methanol in the
three vials suggests that the methanol was being rinsed out
of the pump rapidly. Sample bottles lled after collection
of the VOC vials would be expected to have little or no
contamination from methanol. The groundwater sample
collected immediately following the inadvertent methanol
contamination test described in this report had no detections
of VOCs (Fram and others, 2009; sample TMART-01).
The groundwater sample collected immediately following
collection of the eld blank contaminated with methanol
described by Thiros and others (2011) had no detections of
VOCs that were detected in the contaminated eld blank.
Table 5. Volatile organic compounds (VOCs) detected in a field
blank analyzed in triplicate and determined to be affected by
residual methanol from equipment cleaning, California GAMA
Priority Basin Project, May 2004 through September 2010.
[The three vials were collected sequentially. TICs, tentatively identied
compounds; E, estimated because of a higher degree of uncertainty than
higher concentrations reported for the same compound; µg/L, micrograms per
liter; –, not detected]
Constituent
Concentration
(µg/L)
Vial #1 Vial #2 Vial #3
Solvents
Acetone 30.3 E3.4 –
2-Butanone 155 16.4 E4.1
Tetrahydrofuran 4.36 E0.64 –
Hydrocarbons
Toluene 0.12 E0.02 E0.02
Ethylbenzene E0.07 E0.01 –
m- and p-Xylenes
E0.20 E0.06 –
o-Xylene
E0.08 E0.02 –
Styrene E0.05 – –
1,2,4-Trimethylbenzene E0.02 – –
Other VOCs Number
TICs 13 0 1
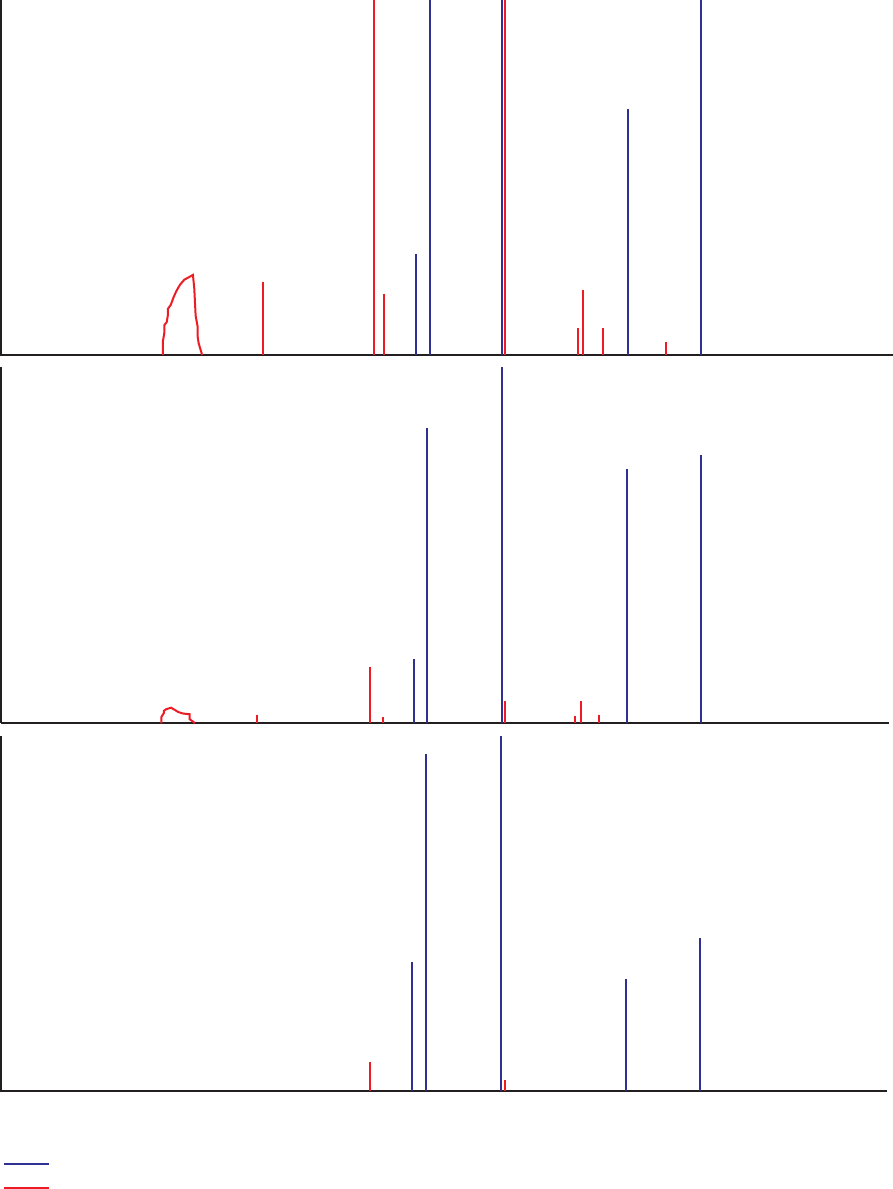
Quality-Control Assessment Results 25
Relative retention time (adjusted)
Voltage (relative)
methanol (inferred)
acetone
methyl ethyl ketone
tetrahydrofuran
toluene
ethylbenzene
m- and p-xylenes
o-xylene
fluorobenzene
1,2-dichloroethane-d4
toluene-d8
1,2,4-trimethylbenzene
bromofluorobenzene
1,2-dichlorobenzene-d4
1st Vial
2nd Vial
3rd Vial
EXPLANATION
Surrogate compounds
Identified VOCs
Chromatograms were adjusted slightly so that the relative retention times for the surrogate compounds and the
relative voltage for the toluene-d8 peak were the same for all three vials. Only peaks for surrogate compounds
and identified volatile organic compounds (VOCs) are shown. Peaks for unidentified VOCs are not shown.
IP031454_Figure 04. chromatographs
Figure 4. Three vials of a field blank affected by methanol, California GAMA Priority Basin Project, June 25, 2007.

26 VOC Blank Data and Study Reporting Levels, California GAMA PBP, 2004–2010
Acetone, 2-Butanone, and Tetrahydrofuran Contamination
in Field Blanks
Occurrences of acetone, 2-butanone, tetrahydrofuran,
and TICs in the full set of 211 eld blanks suggest that 26
(12 percent) may have been affected by contamination from
the methanol used to clean equipment. Fifteen (7.1 percent)
had detections of acetone with concentrations greater than
2 µg/L (maximum 29 µg/L) (g. 5), and 20 (9.5 percent) had
detections of 2-butanone with concentrations ranging from
0.5 to 124 µg/L (g. 6). A threshold of greater than 2 µg/L of
acetone was used to indicate potential contamination from
methanol because the highest concentrations measured in
the source blank water, laboratory instrument blanks, and
source-solution blanks were approximately 2 µg/L. The only
two detections of tetrahydrofuran in eld blanks occurred
in eld blanks that also had detections of 2-butanone and
acetone (g. 7; table A2). The 26 eld blanks inferred
to be contaminated with methanol had signicantly
higher numbers of TICs than the 185 eld blanks without
2-butanone or acetone detections (table 6). The number of
TICs was signicantly positively correlated with 2-butanone
concentration (Spearman’s rho = 0.63, p = 0.001) and with
acetone concentration (Spearman’s rho = 0.53, p = 0.005).
The frequency of this inferred contamination with
methanol was signicantly greater in eld blanks collected
with monitoring-well equipment or long sampling lines
compared to eld blanks collected with short sampling lines
(Kruskal-Wallis test, p = 0.004). Eighteen percent (4 of 22) of
the eld blanks collected with monitoring-well equipment,
19 percent (15 of 77) of the eld blanks collected with long
sampling lines, and 6.2 percent (7 of 112) of eld blanks
collected with short sampling lines were inferred to have
methanol contamination. The differences in frequency of
contamination with methanol may be explained by differences
between methods used to collect eld blanks with the three
congurations of sampling lines and by the differences in
efciency of rinsing the three congurations.
The USGS National Field Manual for the Collection of
Water-Quality Data (http://water.usgs.gov/owq/FieldManual/)
recommends that sampling equipment be rinsed with 8 liters of
certied blank water after the methanol wash step, and that an
additional 6 liters of certied blank water be pumped through
the equipment prior to collecting a eld blank. In a test of eld
methods for collection of VOCs, Thiros and others (2011)
veried that this protocol was sufcient for removing residual
methanol from sampling equipment: none of the eld blanks
collected for their study contained quantiable concentrations
of 2-butanone, acetone, or tetrahydrofuran. Thiros and others
(2011) concluded that high detection frequencies of VOCs
in eld blanks collected for the NAWQA Program likely
indicated that eld crews did not always use the recommended
amount of certied blank water to rinse sample-collection
equipment before collecting eld blanks. Field blanks
collected for the GAMA Program had lower detection
frequencies of VOCs than those collected by the NAWQA
Program, suggesting that GAMA eld crews followed the
recommended rinsing protocols more consistently than did
NAWQA eld crews. Nevertheless, it is possible that some
eld blanks were collected after rinsing with less than 14 liters
of certied blank water.
The portable peristaltic pump used to pump blank water
through the equipment in order to collect the eld blank is not
used for collection of groundwater samples. The peristaltic
pump is also used for pumping the series of cleaning solutions
through sampling equipment after collection of groundwater
samples, and does come in contact with methanol. Use
of a dedicated peristaltic pump for collection of blanks
may reduce the chance of contamination (although even a
dedicated pump would be cleaned between uses with the same
procedure). The second possibility is insufcient rinsing of
the sample-collection equipment with blank water after the
methanol wash step and prior to collection of eld blanks.
In contrast, hundreds of liters of groundwater pass through
the sampling equipment prior to sample collection because
of the time required to purge a well and wait for the eld
parameter readings to stabilize prior to commencement of
sample collection. These differences result in a much greater
likelihood that the eld blanks come in contact with the
methanol used to clean eld equipment.
Acetone, 2-Butanone, and Tetrahydrofuran Contamination
in Groundwater Samples
The detection frequencies of 2-butanone and acetone in
the 2,026 groundwater samples were 0.4 percent each, which
are much lower than the detection frequencies in the eld
blanks (table 4). Fifteen of the 2,026 groundwater samples
had detections of 2-butanone and (or) acetone, and 7 of these
15 also had detections of tetrahydrofuran. An additional
17 groundwater samples had a detection of tetrahydrofuran
without detections of 2-butanone or acetone. Of these
32 groundwater samples, 28 had no detections of solvents
other than acetone or 2-butanone or tetrahydrofuran. Of the
32 groundwater samples, 11 (34 percent) were collected with
monitoring-well equipment, which is signicantly higher
than the percentage of all groundwater samples collected
with monitoring-well equipment (8.2 percent) (contingency
table test, p<0.001). The association between 2-butanone
and acetone detections and the signicantly greater detection
frequency in samples collected with monitoring-well
equipment in the groundwater samples and the eld blanks
suggests that contamination with methanol may have affected
a small number of groundwater samples. The overall detection
frequency in groundwater samples was less than in eld blanks
because the peristaltic pump was not used for groundwater
samples and because of the additional amount of rinsing that
generally occurs during collection of groundwater samples.
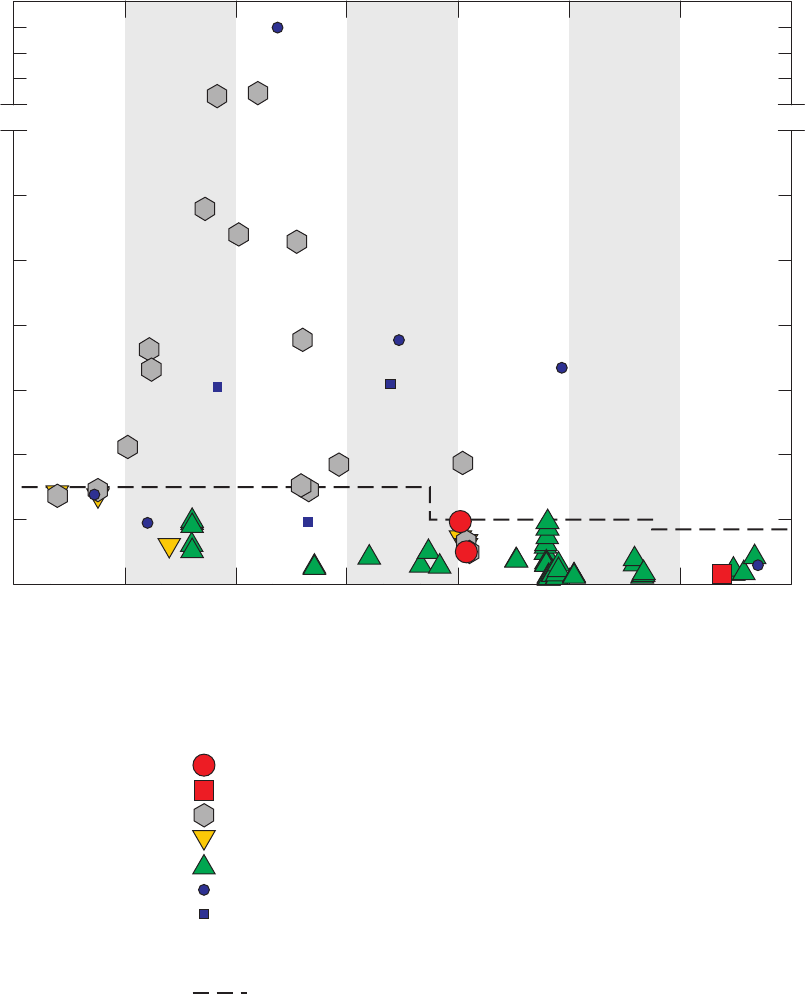
Quality-Control Assessment Results 27
IP031454_Figure 05. acetone
Acetone concentration, in micrograms per liter
Date of sample collection
Quality-control field blank (QCFB, n=167)
Monitoring-well field blank (n=18)
Field blank contaminated by methanol (n=26)
Source-solution blank (n=109)
Laboratory instrument blank (n=2,411)
Groundwater—long or short lines (n=1,859)
Groundwater—monitoring well (n=167)
EXPLANATION
Sample type (only detections are shown)
Threshold
Long-term method detection level (LT-MDL)
The study reporting level (SRL) approach was not applied to acetone because there
is no threshold concentration above which concentrations in groundwater can be
distinguished from concentrations in field blanks. All detections in groundwater
are rejected, and the samples are considered "not analyzed" for acetone.
0
2
4
6
8
10
12
14
20
40
60
80
100
2004 2005 2006 2007 2008 2009 2010
Figure 5. Concentrations of acetone detected in field blanks, source-solution blanks, laboratory
instrument blanks, and groundwater samples, California GAMA Priority Basin Project, May 2004
through September 2010. Non-detections are not shown.
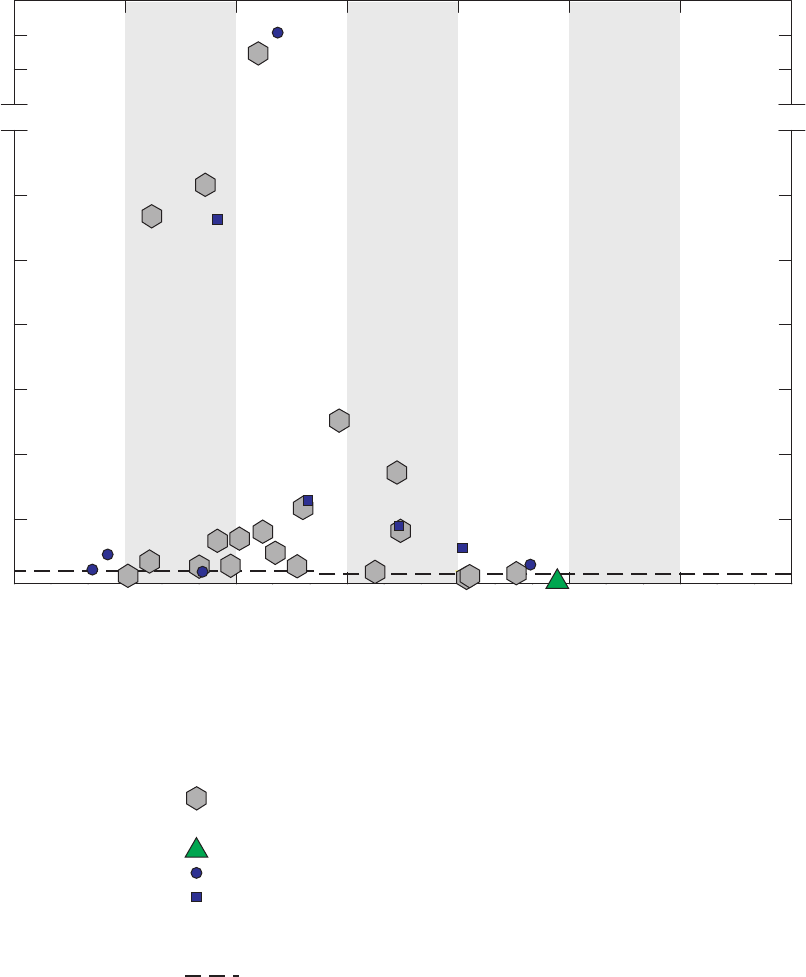
28 VOC Blank Data and Study Reporting Levels, California GAMA PBP, 2004–2010
IP031454_Figure 06. 2-butanone
2-Butanone concentration, in micrograms per liter
Date of sample collection
Quality-control field blank (QCFB, n=167)
Monitoring-well field blank (n=18)
Field blank contaminated by methanol (n=26)
Source-solution blank (n=109)
Laboratory instrument blank (n=2,411)
Groundwater—long or short lines (n=1,859)
Groundwater—monitoring well (n=167)
EXPLANATION
Sample type (only detections are shown)
Threshold
Long-term method detection level (LT-MDL)
0
5
10
15
20
25
30
35
50
100
150
200
2004 2005 2006 2007 2008 2009 2010
The study reporting level (SRL) approach was not applied to 2-butanone because there
is no threshold concentration above which concentrations in groundwater can be
distinguished from concentrations in field blanks. All detections in groundwater
are rejected, and the samples are considered "not analyzed" for 2-butanone.
Figure 6. Concentrations of 2-butanone detected in field blanks, source-solution blanks, laboratory
instrument blanks, and groundwater samples, California GAMA Priority Basin Project, May 2004 through
September 2010. Non-detections are not shown.
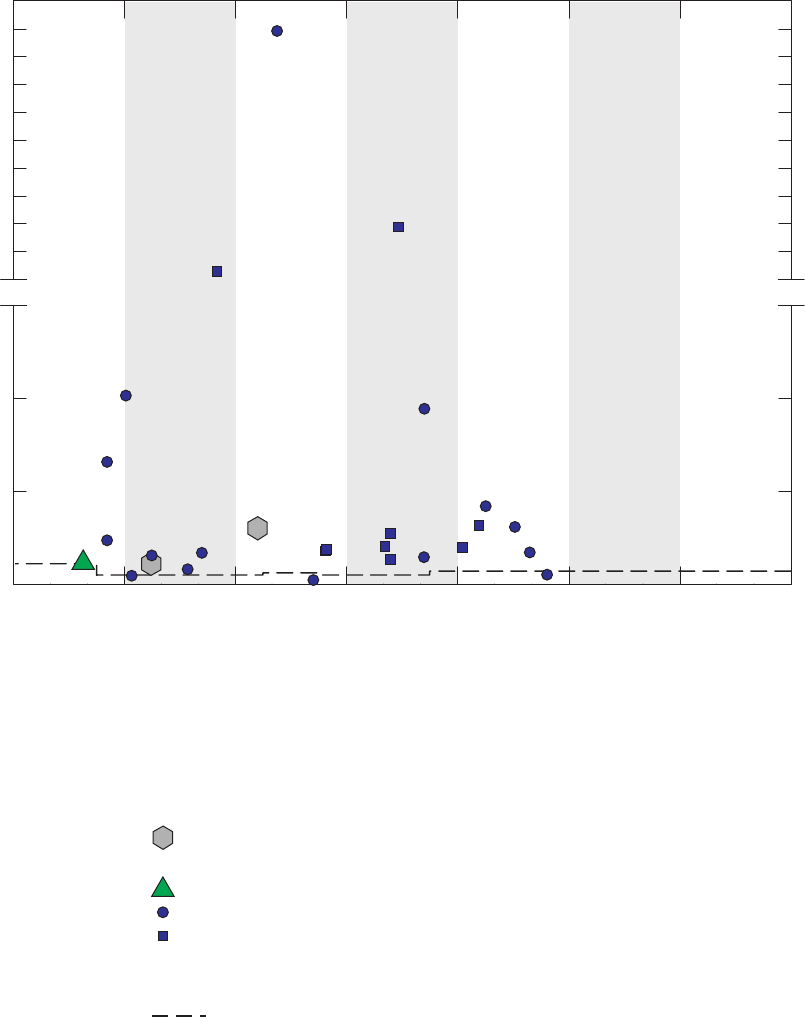
Quality-Control Assessment Results 29
IP031454_Figure 07. thf
Tetrahydrofuran concentration, in micrograms per liter
Date of sample collection
0
5
10
15
50
100
150
200
250
300
350
400
450
500
550
2004 2005 2006 2007 2008 2009 2010
Quality-control field blank (QCFB, n=167)
Monitoring-well field blank (n=18)
Field blank contaminated by methanol (n=26)
Source-solution blank (n=109)
Laboratory instrument blank (n=2,411)
Groundwater—long or short lines (n=1,859)
Groundwater—monitoring well (n=167)
EXPLANATION
Sample type (only detections are shown)
Threshold
Long-term method detection level (LT-MDL)
The study reporting level (SRL) approach was not applied to tetrahydrofuran because there
is no threshold concentration above which concentrations in groundwater can be
distinguished from concentrations in field blanks. All detections in groundwater
are rejected, and the samples are considered "not analyzed" for tetrahydrofuran.
Figure 7. Concentrations of tetrahydrofuran detected in field blanks, source-solution blanks, laboratory
instrument blanks, and groundwater samples, California GAMA Priority Basin Project, May 2004 through
September 2010. Non-detections are not shown.
30 VOC Blank Data and Study Reporting Levels, California GAMA PBP, 2004–2010
Table 6. Detection frequencies for the 17 VOCs and the TICs detected in field blanks and results of statistical tests for differences between subsets of the field blanks,
California GAMA Priority Basin Project, May 2005 through September 2010.
[A result of signicant difference on a statistical test is as a p-value less than the threshold value (α) of 0.05. For cases with a result of signicance on the Kruskal-Wallis test, Tukey’s multiple comparison
test was applied to determine which sample groups were signicantly different. Sampling equipment congurations: M, monitoring-well equipment; L, long sampling lines; S, short sampling lines. Other
abbreviations: VOCs, volatile organic compounds; TICs, tentatively identied compounds; n, number; <, less than; >, greater than; ns, not signicant]
Detection frequency
(percent)
p-value
(Wilcoxon test,
methanol-affected
to unaffected)
Three configurations of unaffected
field blanks, detection frequency
(percent)
p-value (Kruskal-
Wallis test, three
configurations)
Configurations
with significant
differences
Methanol-
affected
field blanks
(n = 26)
Unaffected
field blanks
(n = 185)
Monitoring-well
equipment (M)
(n = 18)
Long sampling
lines (L)
(n = 62)
Short sampling
lines (S)
(n = 105)
Hydrocarbons
Benzene 12 0 <0.001 0 0 0 ns ns
Ethylbenzene 42 5.9 <0.001 5.6 15 1.0 0.002 L > S
Styrene 19 0 <0.001 0 0 0 ns ns
Toluene 77 30 <0.001 50 31 27 ns ns
1,2,4-Trimethylbenzene 7.7 7.0 ns 17 11 2.9 0.036 M > S, L > S
m- and p-Xylene
50 10 <0.001 22 18 3.8 0.002 M > S, L > S
o-Xylene
38 5.4 <0.001 5.6 13 1.0 0.004 L > S
Solvents
Acetone 65 1.6 <0.001 5.6 1.6 1.0 ns ns
2-Butanone 77 0 <0.001 0 0 0 ns ns
Dichloromethane 12 0.5 <0.001 0 0 1.0 ns ns
Tetrachloroethene 3.8 1.6 ns 0 3.2 1.0 ns ns
Tetrahydrofuran 7.7 0 <0.001 0 0 0 ns ns
Trichloroethene 7.7 0.5 0.004 0 1.6 0 ns ns
Other VOCs
Bromodichloromethane 3.8 0 0.007 0 0 0 ns ns
Carbon disulde
3.8 2.7 ns 0 3.2 2.9 ns ns
Chloroform 15 3.2 0.006 17 3.2 1.0 0.002 M > L, M > S
Trichlorouoromethane 0 0.5 ns 0 0 1.0 ns ns
TICs 46 12 <0.001 72 8.1 4.8 <0.001 M > L, M > S

Quality-Control Assessment Results 31
In addition, 2-butanone, acetone, and tetrahydrofuran are
the primary ingredients in the cements used to join polyvinyl
chloride (PVC) piping, and PVC piping may be used in the
distribution system connected to the well. The groundwater
sample with the highest concentrations (80 µg/L of acetone,
154 µg/L of 2-butanone, and 495 µg/L of tetrahydrofuran)
was collected from a well where the owner had just connected
a PVC line to the wellhead to create a sampling port, and a
strong odor of PVC cement was recorded in the eld notes
for the site (Ferrari and others, 2008). It is highly probable
that the detections were the result of contamination from
PVC cement and were not representative of the groundwater
in the aquifer. The presence of PVC piping with relatively
fresh connections was noted at a few other sites from which
the groundwater samples had detections of 2-butanone,
acetone, and (or) tetrahydrofuran (Fram and others, 2009).
However, the presence or absence of these conditions is not
routinely recorded in the eld notes, thus, it is not possible
to assess how many of the detections of these compounds in
groundwater could be due to contamination from PVC cement
contacting the groundwater during sample collection.
The relative concentrations of the three solvents imparted
by contamination from the two known sources (methanol and
PVC cement) do not appear to follow a characteristic pattern.
The groundwater sample with the highest concentrations
of all three solvents does not lie at the end of a trend in the
concentration data for other samples and blanks containing
the solvents. Two other groundwater samples from sites with
documented presence of new PVC cement contained only
tetrahydrofuran (Fram and others, 2009; study unit M5).
The order of the three solvents in the list of ingredients in
different brands of PVC cement varies, suggesting that the
relative amounts of the three solvents vary. Field blanks
containing methanol generally were characterized by the
presence of 2-butanone and acetone, with lesser amounts of
tetrahydrofuran (table 5), although the data do not fall on a
smooth trend. The concentrations of the acetone, 2-butanone,
and tetrahydrofuran contaminants in the methanol may
be variable, which makes sense, as different containers of
methanol may have different histories of exposure to sources
of contamination.
SRLs for Acetone, 2-Butanone, and Tetrahydrofuran
The contamination patterns of acetone, 2-butanone, and
tetrahydrofuran are not amenable to the SRL approach. The
highest concentrations of all three VOCs in groundwater
samples (greater than 100 µg/L) and in eld blanks occurred
in samples collected at sites having conrmed presence
of known sources of extrinsic contamination—fresh PVC
cement at well sites and methanol in eld blanks. Seven eld
blanks contained greater than 10 µg/L of one or more of the
three VOCs. In contrast, the maximum concentration for
all other VOCs detected in eld blanks was 0.69 µg/L. The
observations that eld blanks can contain high concentrations
of acetone, 2-butanone, and tetrahydrofuran, and that
contamination from PVC cement at well sites can produce
high concentrations of these three VOCs in groundwater
samples, indicate that it is not possible to dene a threshold
concentration above which detections in groundwater have
an acceptable probability of being representative of aquifer
conditions rather than due to contamination. Therefore, SRLs
cannot be dened for these three VOCs.
Because SRLs cannot be dened and no quantitative QC
assessment can be made, it is not possible to evaluate whether
detections of 2-butanone, acetone, and tetrahydrofuran in
groundwater samples represent aquifer conditions or extrinsic
contamination. For the GAMA Program, groundwater samples
with reported detections of these three VOCs are dened
as having no data available for these three VOCs. This is
achieved by changing the data-quality-indicator code (DQI)
in NWIS to “Q,” for “reviewed and rejected” and by adding
the following result-level remark: “Upon careful review,
these data have been rejected per Fram and others, 2012,
USGS SIR 2012-5139.” Data for groundwater samples having
non-detections of 2-butanone, acetone, and tetrahydrofuran
are not similarly rejected. Extrinsic contamination produces
a positive bias; therefore, a non-detection indicates both
the absence of contamination and the absence of detectable
concentrations of the VOC in groundwater. Note that “not
analyzed” is not the same as “not detected.” Rejecting all
reported detections of these three VOCs means that detection
frequencies for these VOCs in groundwater cannot be dened.
Differences Between Sample-Collection
Equipment Configurations
Because the frequency of contamination attributable to
methanol was signicantly different in eld blanks collected
with different sampling equipment congurations, it was
prudent to assess whether there were signicant differences for
other constituents. Of the 185 eld blanks without methanol
contamination, 18 were collected with monitoring-well
equipment, 62 were collected with long sampling lines, and
105 were collected with short sampling lines. Signicant
differences between the eld blanks collected using the three
equipment congurations were found for hydrocarbons,
chloroform, and TICs (table 6).
Field blanks collected with long sampling lines had
signicantly greater concentrations of m- and p-xylenes,
o-xylene, ethylbenzene, and 1,2,4-trimethylbenzene than
eld blanks collected with short sampling lines, and eld
blanks collected with monitoring-well equipment had
signicantly greater concentrations of m- and p-xylenes and
1,2,4-trimethylbenzene than eld blanks collected with short
sampling lines (table 6). However, detection frequencies
of ethylbenzene, m- and p-xylenes, and o-xylene were
much greater in blanks (of any conguration) than in the
groundwater samples (table 4); thus these differences between
sample-collection equipment congurations are not considered
relevant for the quality-control assessment of the groundwater
VOC data.

32 VOC Blank Data and Study Reporting Levels, California GAMA PBP, 2004–2010
Chloroform was the most frequently detected VOC
in groundwater samples (27 percent; table 4), thus the
quality-control assessment for chloroform is vitally important
and could have a noticeable effect on the interpretation of
the groundwater-quality data. Chloroform concentrations
were signicantly greater in eld blanks collected with
monitoring-well equipment than in eld blanks collected
with either long or short sampling lines, and there was no
signicant difference between eld blanks collected with the
long and with the short sampling lines (table 6).
TICs usually are not used in the interpretation of the
groundwater-quality data; however, they may be an indicator
of the presence of contamination by VOCs not generally
present in groundwater. The occurrence of TICs in eld blanks
collected with monitoring-well equipment was signicantly
more frequent than the occurrence in eld blanks collected
with either long or short sampling lines.
Quality-Control Field Blanks (QCFBs)
Of the 211 eld blanks, 167 were included in the set of
QCFBs that was used to calculate SRLs. The 26 eld blanks
with evidence of contamination by methanol and 18 other
eld blanks collected with monitoring-well equipment were
excluded from the set of QCFBs.
Field blanks collected with monitoring-well equipment
had signicantly more detections of chloroform, toluene,
1,2,4-trimethylbenzene, and m- and p-xylenes than eld blanks
collected with long or short sampling lines (table 6). However,
with only 18 eld blanks collected with monitoring-well
equipment, SRLs can be established with far less condence
than for the set of 167 QCFBs: The 18
th
-ranked monitoring-
well eld blank corresponds to the BD-95/56. In the absence
of more quantitative estimates, the SRLs determined from
the QCFBs were also applied to groundwater samples
collected with monitoring-well sampling equipment, except
in the case of chloroform where detections of chloroform in
monitoring-well eld blanks suggested that an SRL with a
higher concentration was warranted.
Evaluation of Potential Sources of
Contamination, Selection of SRLs, and
Application of SRLs to Groundwater Data for
VOCs Detected in Blanks
The 15 VOCs that were detected in eld or source-
solution blanks and considered to be amenable to the SRL
approach were divided into groups on the basis of chemical
class and inferred mechanism of contamination. For each
group, the following topics are discussed: (1) inferred
mechanism(s) of contamination, (2) comparison of SRLs
determined by the different methods, (3) selection of an
appropriate SRL (if any) and results of application of that
SRL to the groundwater data, and (4) comparison to SRLs
determined from NAWQA VOC eld-blank data by Bender
and others (2011).
SRLs were implemented in NWIS by changing the
reported value to “< SRL,” where “SRL” is the value of the
SRL for that VOC, and by adding the following result-level
remark: “Upon careful review, these data have been censored
per Fram and others, 2012, USGS SIR 2012-5139. Bench
chemist values can be obtained from NWQL.”
Hydrocarbons
Chemically, the seven hydrocarbons detected in blanks
all are benzene rings with 0 to 3 aliphatic hydrocarbon
substituents. All are components of gasoline and other
petroleum-based fuels, materials, and combustion products.
They are divided into three groups for discussion based on
similarities in inferred mechanisms of contamination.
Ethylbenzene, m- and p-Xylenes, o-Xylene, Benzene, and
Styrene
Ethylbenzene, m- and p-xylenes, and o-xylene had
higher detection frequencies in QCFBs and source-solution
blanks than in groundwater samples, whereas the detection
frequencies of benzene and styrene were lower in the QCFBs
and source-solution blanks than in groundwater samples
(table 4; gs. 8–12). These ve hydrocarbons are present in
fuels used in and exhaust produced by operation of vehicles
and generators, and emissions from fuel combustion generally
are the dominant source of these hydrocarbons in ambient air
(for example, Daisey and others, 1994; Monod and others,
2001). Although it is also possible that these compounds could
enter the blanks and the groundwater samples through entirely
different avenues, this is unlikely to be the case. Correlations
among the ve hydrocarbons and the ratios of hydrocarbon
species in blanks and groundwater samples were examined to
evaluate the hypothesis that fuel vapors or exhaust were the
source of contamination.
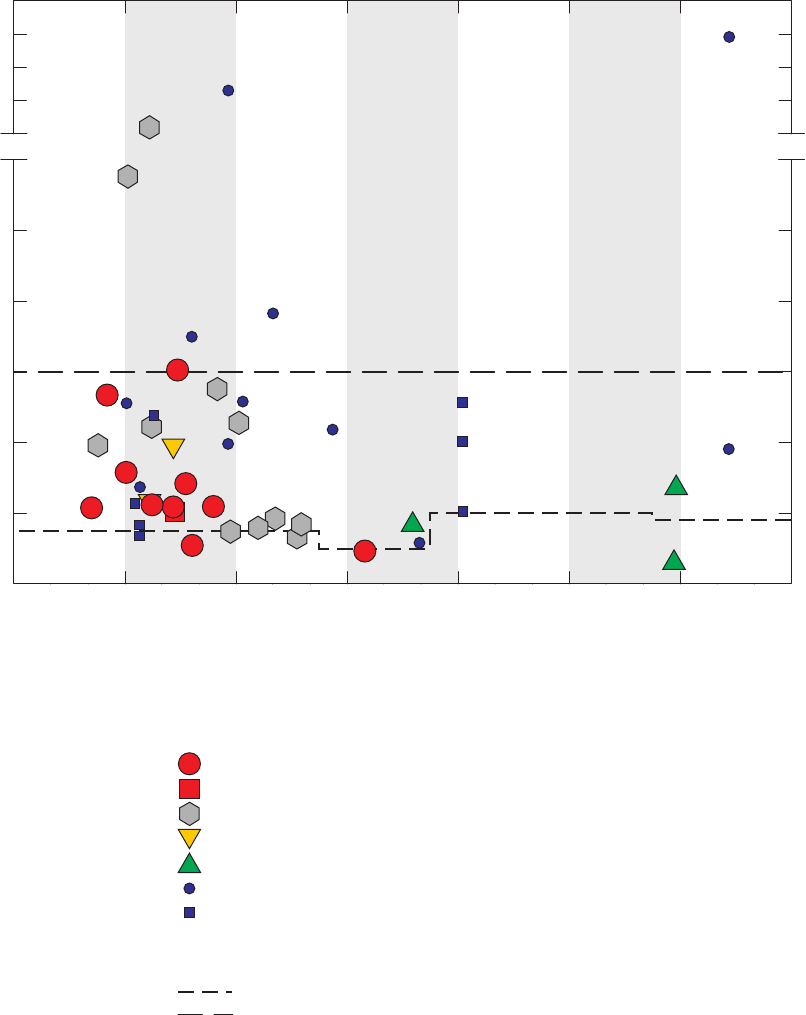
Quality-Control Assessment Results 33
IP031454_Figure 08. ethylb
Ethylbenzene concentration, in micrograms per liter
Date of sample collection
0
0.02
0.04
0.06
0.08
0.10
0.12
0.20
0.40
0.60
0.80
1.00
2004 2005 2006 2007 2008 2009 2010
Quality-control field blank (QCFB, n=167)
Monitoring-well field blank (n=18)
Field blank contaminated by methanol (n=26)
Source-solution blank (n=109)
Laboratory instrument blank (n=2,411)
Groundwater—long or short lines (n=1,859)
Groundwater—monitoring well (n=167)
Sample type (only detections are shown)
Thresholds
Long-term method detection level (LT-MDL)
Study reporting level (SRL)
EXPLANATION
Figure 8. Concentrations of ethylbenzene detected in field blanks, source-solution blanks,
laboratory blanks, and groundwater samples, California GAMA Priority Basin Project, May 2004
through September 2010. Non-detections are not shown.
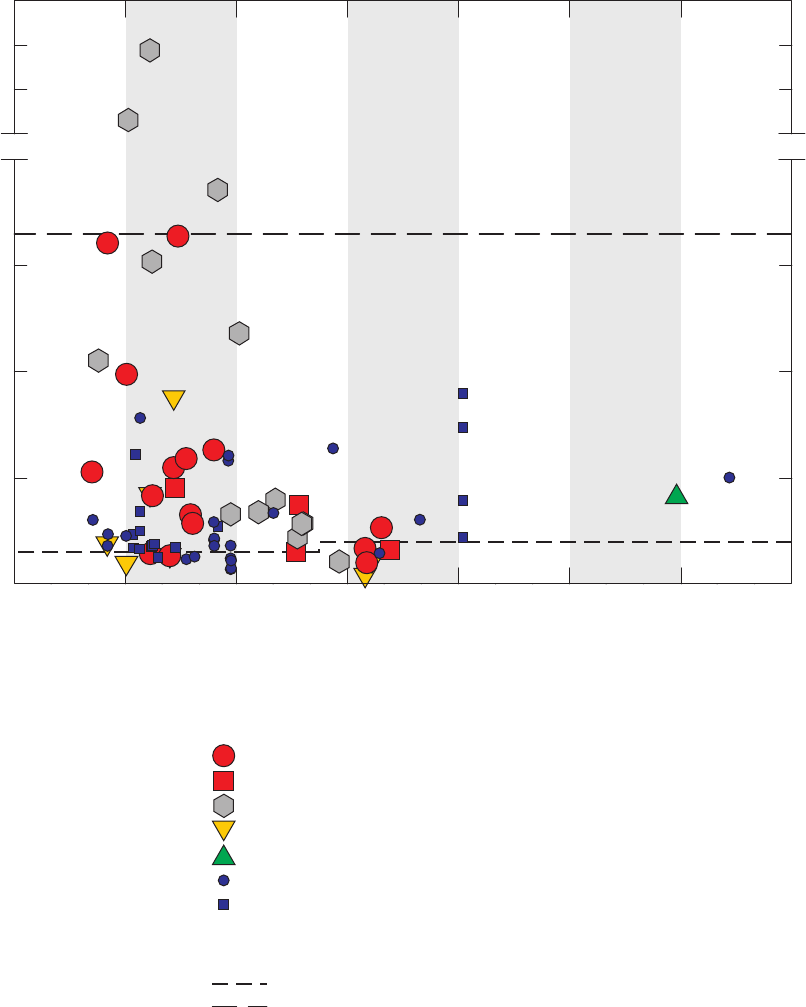
34 VOC Blank Data and Study Reporting Levels, California GAMA PBP, 2004–2010
IP031454_Figure 09. m-&p-xylenes
Quality-control field blank (QCFB, n=167)
Monitoring-well field blank (n=18)
Field blank contaminated by methanol (n=26)
Source-solution blank (n=109)
Laboratory instrument blank (n=2,411)
Groundwater—long or short lines (n=1,859)
Groundwater—monitoring well (n=167)
Sample type (only detections are shown)
Thresholds
Long-term method detection level (LT-MDL)
Study reporting level (SRL)
m- and p-Xylene concentration, in micrograms per liter
Date of sample collection
0
0.1
0.2
0.3
0.4
0.8
1.2
1.6
2004 2005 2006 2007 2008 2009 2010
EXPLANATION
Figure 9. Concentrations of m- and p-xylenes detected in field blanks, source-solution blanks,
laboratory blanks, and groundwater samples, California GAMA Priority Basin Project, May 2004
through September 2010. Non-detections are not shown.
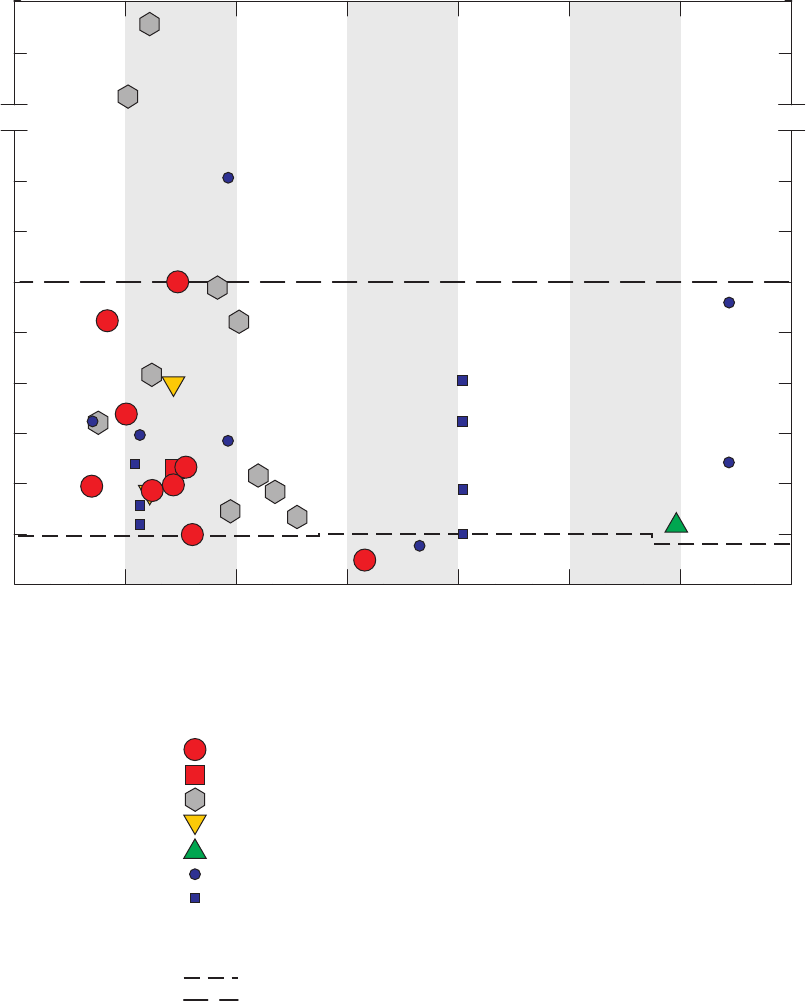
Quality-Control Assessment Results 35
IP031454_Figure 10. o-xylenes
Quality-control field blank (QCFB, n=167)
Monitoring-well field blank (n=18)
Field blank contaminated by methanol (n=26)
Source-solution blank (n=109)
Laboratory instrument blank (n=2,411)
Groundwater—long or short lines (n=1,859)
Groundwater—monitoring well (n=167)
Sample type (only detections are shown)
Thresholds
Long-term method detection level (LT-MDL)
Study reporting level (SRL)
o-Xylene concentration, in micrograms per liter
Date of sample collection
0
0.02
0.04
0.06
0.08
0.10
0.12
0.14
0.16
0.18
0.20
0.40
0.60
2004 2005 2006 2007 2008 2009 2010
EXPLANATION
Figure 10. Concentrations of o-xylene detected in field blanks, source-solution blanks,
laboratory blanks, and groundwater samples, California GAMA Priority Basin Project,
May 2004 through September 2010. Non-detections are not shown.
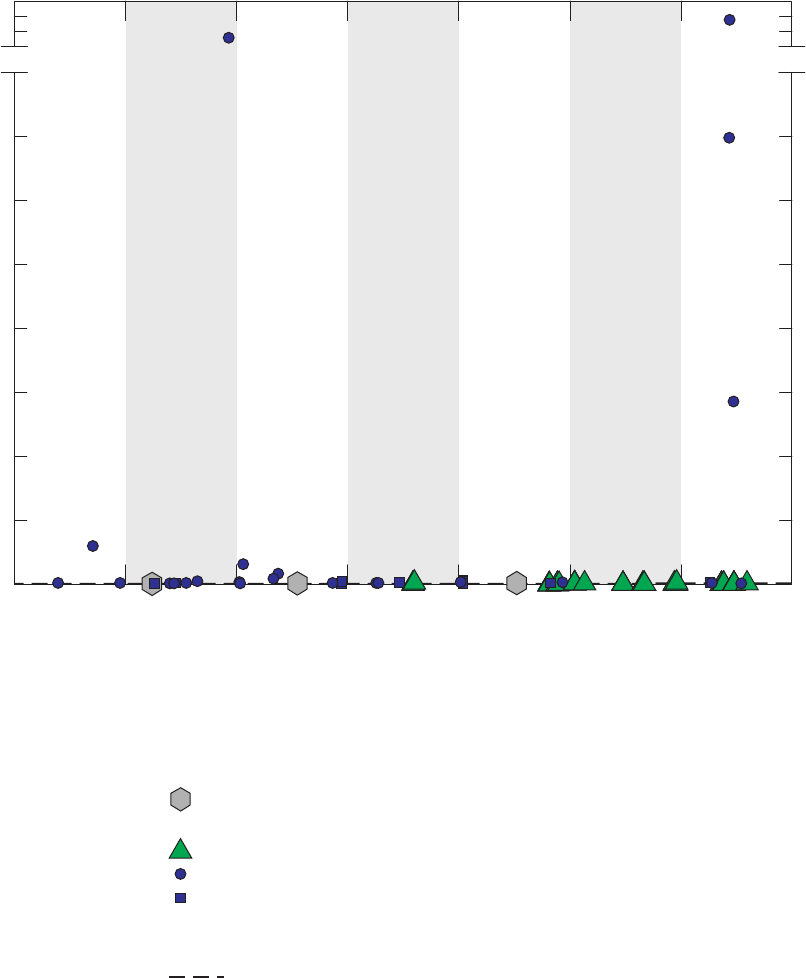
36 VOC Blank Data and Study Reporting Levels, California GAMA PBP, 2004–2010
IP031454_Figure 11. benzene
Quality-control field blank (QCFB, n=167)
Monitoring-well field blank (n=18)
Field blank contaminated by methanol (n=26)
Source-solution blank (n=109)
Laboratory instrument blank (n=2,411)
Groundwater—long or short lines (n=1,859)
Groundwater—monitoring well (n=167)
EXPLANATION
Sample type (only detections are shown)
Threshold
Long-term method detection level (LT-MDL)
Benzene concentration, in micrograms per liter
Date of sample collection
0
1
2
3
4
5
6
7
8
50
100
150
200
2004 2005 2006 2007 2008 2009 2010
A study reporting level (SRL) was not needed for benzene.
Figure 11. Concentrations of benzene detected in field blanks, source-solution blanks,
laboratory blanks, and groundwater samples, California GAMA Priority Basin Project,
May 2004 through September 2010. Non-detections are not shown.
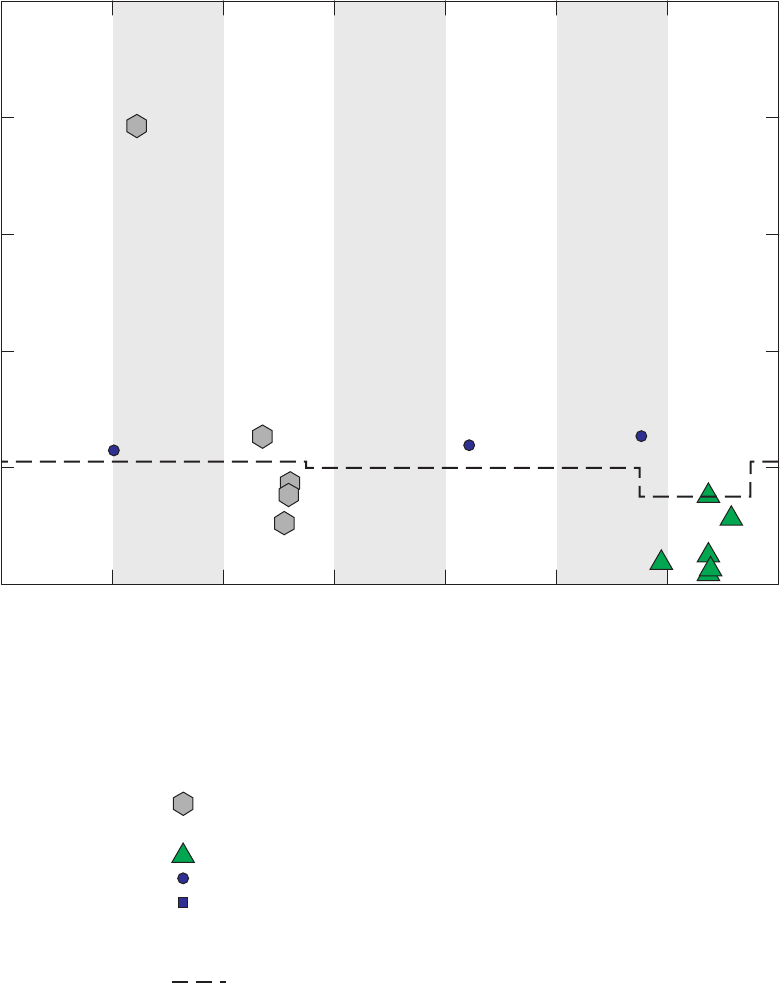
Quality-Control Assessment Results 37
IP031454_Figure 12. styrene
Quality-control field blank (QCFB, n=167)
Monitoring-well field blank (n=18)
Field blank contaminated by methanol (n=26)
Source-solution blank (n=109)
Laboratory instrument blank (n=2,411)
Groundwater—long or short lines (n=1,859)
Groundwater—monitoring well (n=167)
EXPLANATION
Sample type (only detections are shown)
Threshold
Long-term method detection level (LT-MDL)
0
0.02
0.04
0.06
0.08
0.10
Styrene concentration, in micrograms per liter
Date of sample collection
2004 2005 2006 2007 2008 2009 2010
A study reporting level (SRL) was not needed for styrene.
Figure 12. Concentrations of styrene detected in field blanks, source-solution blanks, laboratory
blanks, and groundwater samples, California GAMA Priority Basin Project, May 2004 through
September 2010. Non-detections are not shown.

38 VOC Blank Data and Study Reporting Levels, California GAMA PBP, 2004–2010
Inferred Mechanisms of Contamination
Concentrations of ethylbenzene, m- and p-xylenes,
and o-xylene in the blanks are signicantly correlated with
one another (p<0.001 for Spearman’s rho tests between
each pair). Concentrations of the three compounds in the
QCFBs, source-solution blanks, eld blanks from monitoring
wells, and eld blanks affected by methanol contamination
all lie on the same linear correlations that correspond
to ethylbenzene/m- and p-xylenes and o-xylene/m- and
p-xylenes ratios of approximately 0.2 and 0.4, respectively
(g. 13A,B). These ratios are similar to those found in vehicle
exhaust and ambient urban air (Daisey and others, 1994;
Monod and others, 2001). These relations suggest that the
QCFBs, source-solution blanks, eld blanks from monitoring
wells, and eld blanks affected by methanol contamination
are all subject to contamination from the same source of
hydrocarbons, which is likely vehicle exhaust fumes.
Most groundwater samples containing ethylbenzene,
o-xylene, and m- and p-xylenes had ratios of hydrocarbons
similar to those observed in eld and source-solution blanks
(g. 13A,B), suggesting that the groundwater samples may
have been contaminated with the same source of hydrocarbons
as the blanks—vehicle exhaust fumes. VOCs from vehicle
exhaust fumes also could have been present in the aquifer due
to recharge of recent precipitation; however, other information
about the groundwater samples suggests that the ethylbenzene,
o-xylene, and m- and p-xylenes were unlikely to have been the
result of aquifer conditions. Of the groundwater samples with
hydrocarbon ratios similar to those in the blanks or detection
of low concentration of m- and p-xylenes without detections
of ethylbenzene or o-xylene, 45 percent had tritium activities
less than 1 TU, suggesting absence of signicant amounts of
modern recharge. Of those with tritium activities greater than
1 TU, 60 percent were from sites with less than 20 percent
urban land use in the area within 500 meters of the well site,
suggesting absence of signicant sources of vehicle exhaust
fumes. In the dataset as a whole, percentage of urban land
use around the well site was not correlated with detection of
ethylbenzene, o-xylene, or m- and p-xylenes in groundwater
samples (Wilcoxon rank-sum test, p > 0.05).
Five groundwater samples had ethylbenzene/m- and
p-xylenes and (or) o-xylene/m- and p-xylenes ratios greater
than 1, which suggests a different source of hydrocarbons.
The two samples with the highest ratios were collected from
the same site (TLR-07) in 2005 and 2010 in study unit V7
(southeast San Joaquin Valley; Burton and Belitz, 2008),
and also contained greater than 75 µg/L of benzene. That
area of the southeast San Joaquin Valley has extensive oil
and gas production, thus the source of the hydrocarbons in
groundwater may be the petroleum deposits. Hydrocarbons
in natural petroleum deposits or anthropogenic sources of
petroleum products (such as spills and leaks) will dissolve in
groundwater. The dissolved hydrocarbons are then subject to
biodegradation under aquifer conditions, and they biodegrade
at different rates; thus, hydrocarbon ratios in groundwater may
differ from those in petroleum.
Concentrations of benzene and styrene in the blanks
were correlated with concentrations of ethylbenzene, m- and
p-xylenes, and o-xylene (p < 0.001 for styrene and p < 0.001
to 0.003 for benzene, Spearman’s rho test), and the ratios of
benzene and styrene to m- and p-xylenes in eld blanks were
similar to the ratios in ambient air (g. 13C,D). The detection
frequencies of benzene and styrene in blanks, however, were
much lower than those of the other hydrocarbons (table 4).
The median detected concentrations of benzene and styrene in
eld blanks were less than or equal to the maximum LT-MDL;
the median detected concentrations of ethylbenzene, m- and
p-xylenes, and o-xylene in eld blanks were greater than the
maximum LT-MDL. This suggests that although the ambient
air with vehicle exhaust may contaminate sampling equipment
(or the methanol) with all ve hydrocarbons, the resulting
concentrations of benzene and styrene commonly may be
below detection levels. All six eld blanks containing benzene
and styrene were contaminated with methanol, and ve of the
six blanks (83 percent) also had detections of ethylbenzene, m-
and p-xylenes, and o-xylene (table A2).
Among groundwater samples with detections of benzene
or styrene, the detection frequency of ethylbenzene, m-
and p-xylenes, or o-xylene (33 percent) was signicantly
lower than in the blanks (contingency table test, p = 0.021).
Furthermore, the ratios between benzene or styrene and m- and
p-xylenes in groundwater samples were not the same as the
ratios in blanks (g. 13C,D). These ratios suggest that the
detections of styrene and benzene in groundwater likely were
not caused by contamination.
The relative detection frequencies of ethylbenzene,
m- and p-xylenes, and o-xylene hydrocarbons in laboratory
instrument blanks, source-solution blanks, the various
subsets of eld blanks, and groundwater samples (tables 4,
6) provided data for developing a hypothesis about the
mechanism of contamination from vehicle exhaust. The
presence of hydrocarbons in source-solution blanks indicates
that potential sources of contamination are the source
blank water, laboratory processes, the vials, or something
encountered during travel, either before or after sample
collection. The absence of detections on the certicates of
analysis for the source blank water suggests that the source
blank water itself is not the source of contamination, and the
much lower detection frequencies in laboratory instrument
blanks suggest that laboratory processes are not the source.
Quality-Control Assessment Results 39
IP031454_Figure 13. correlations
0
0.4
0.8
1.2
1.6
2.0
4.0
6.0
Toluene, in micrograms per liter
0
0.2
0.4
0.6
0.8
Ethylbenzene, in micrograms per liter
0
0.1
0.2
0.3
0.4
0.5
0.6
o-Xylene, in micrograms per liter
0
0.2
0.4
0.6
0.8
1.0
1.5
2.0
1,2,4-trimethylbenzene, in micrograms per liter
0
0 0.2 0.4 0.6 0.8 1.0 1.2
0.02
0.04
0.06
0.08
0.10
Styrene, in micrograms per liter
m- and p-Xylenes, in micrograms per liter
0 0.2 0.4 0.6 0.8 1.0 1.2
m- and p-Xylenes, in micrograms per liter
0
2
4
6
8
50
100
150
200
Benzene, in micrograms per liter
EXPLANATION
Field blank—short
lines (n=105)
Field blank—long
lines (n=62)
Field blank—moni-
toring well (n=18)
Field blank contam-
inated by methanol
(n=26)
Source-solution
blank (n=109)
Groundwater—long
or short lines
(n=1,859)
Ratio of compounds
in California
ambient urban air
(Daisey and
others, 1994)
A
B
C
D
E
F
Figure 13. Relations between m- and p-xylenes and (A) ethylbenzene, (B) o-xylene, (C) styrene,
(D) benzene, (E) toluene, and (F) 1,2,4-trimethylbenzene detected in field blanks, source-solution blanks,
and groundwater samples, California GAMA Priority Basin Project, May 2004 through September 2010.

40 VOC Blank Data and Study Reporting Levels, California GAMA PBP, 2004–2010
The fact that the detection frequencies in groundwater samples
are less than in source-solution blanks suggests that processes
occurring during travel after sample collection are not the
source. That leaves the vials and processes occurring during
transit of the source blank water to the eld site as potential
sources of contamination to the source-solution blanks. Both
the vials and the source blank water may be exposed to fuel
exhaust or vapors from fuel used in vehicles during transit or
storage. The bottles of source blank water tend to be tightly
sealed, and caps on the unused VOC vials generally are
loosely attached. This difference in capping may point to the
vials as the problem, but there is no way to be certain with
this dataset.
The potential sources of contamination to eld blanks
are the same as those for source-solution blanks, with the
addition of contact with sample-collection equipment.
Detection frequencies of ethylbenzene, m- and p-xylenes,
and o-xylene were signicantly higher in eld blanks than in
source-solution blanks (table 4), indicating that contact with
sample-collection equipment was a source of contamination.
Detection frequencies of the three hydrocarbons were
signicantly higher in QCFBs collected with long sampling
lines compared to those collected with short sampling lines
(table 6), indicating that more contact with eld equipment
yields more contamination. Detection frequencies of the three
hydrocarbons were signicantly higher in eld blanks affected
by methanol compared to those not affected by methanol
(table 6); however, the concentrations of hydrocarbons in
the inadvertent eld test of methanol contamination (table 5)
were similar to the concentrations in QCFBs (gs. 8–10). This
suggests that the methanol itself was not the source of the
hydrocarbons. The purpose of the methanol rinse is to wash
organic compounds off of the sample-collection equipment;
many organic compounds, including hydrocarbons, are more
soluble in methanol than they are in water.
If the methanol is effective for removing hydrocarbons
from the eld collection equipment, then why did eld
blanks with no evidence for contamination with methanol
still have relatively high frequencies of contamination with
hydrocarbons (table 6)? This observation may be explained
by the timing of the methanol rinse. To reduce the use of
methanol by eld crews, sample-collection equipment was
cleaned in the laboratory (where fume hoods are available
to limit exposure) whenever possible. Sets of clean sample-
collection equipment may be exposed to fuel exhaust or vapor
from fuel used in vehicles during travel in the eld vehicles.
According to protocols, sample-collection equipment and
peristaltic pumps that were last cleaned in the laboratory
would require rinsing with 6 liters of certied blank water in
the eld before collection of a eld blank. It is possible that
rinsing with 6 liters of blank water may not be sufcient to
remove hydrocarbons that sorbed onto the clean equipment
during transit to the eld site. The lower detection frequencies
in the groundwater samples compared to the eld blanks
suggest that the additional amount of rinsing of equipment and
vials that occurs during collection of groundwater samples was
more effective for removing the hydrocarbons.
SRLs for Ethylbenzene, m- and p-Xylenes, o-Xylene, Benzene,
and Styrene
The different methods for calculating SRLs yield
SRLs for ethylbenzene, m- and p-xylenes, and o-xylene
that would result in vastly different amounts of censoring
to the groundwater data (table 7). On the basis of the
inferred mechanisms of contamination for eld blanks and
groundwater samples, a large portion of the detections in
groundwater samples may be the result of contamination,
suggesting that SRLs that result in censoring of a large portion
of the groundwater data may be more appropriate. However,
the hydrocarbon ratios suggest that hydrocarbons in a few of
the groundwater samples are derived from a distinct source;
thus, some detections of hydrocarbons in groundwater samples
likely do reect hydrocarbon occurrence in the aquifer rather
than contamination, and these data should not be censored.
The SRLs derived from the maximum concentration
in the QCFBs, 0.06 µg/L, 0.33 µg/L, and 0.12 µg/L, were
selected for ethylbenzene, m- and p-xylenes, and o-xylene,
respectively (table 8). These SRLs result in censoring nearly
all of the groundwater data for ethylbenzene and o-xylene
and all of the groundwater data for m- and p-xylenes (table 8;
gs. 8–10). Detections of ethylbenzene, m- and p-xylenes,
and o-xylene occurred in 11 of the 32 study units (N3, N6,
S1, S2, S3, V1, V3, V4, V5, V7, and V9; table 9), and of the
71 total detections, 66 were censored by application of the
SRLs (table 8).
Four groundwater samples contained concentrations
of ethylbenzene greater than the SRL. Ethylbenzene/m- and
p-xylenes and o-xylene/m- and p-xylenes ratios in these
samples were considerably higher than the ratios calculated
for eld blanks (g. 13A,B). Three of these four samples had
additional characteristics suggesting geogenic sources of
hydrocarbons: benzene and hydrocarbons were the only VOCs
detected, groundwater samples had tritium < 1 TU, and the
wells were relatively deep (Landon and Belitz, 2012).
In contrast, if the BD-95/90, BD-90/90, or maximum
LT-MDL SRLs had been selected, many detections in
groundwater samples with concentrations and ratios of
hydrocarbons indistinguishable from those in the eld blanks
would have been retained as detections representative of
aquifer conditions. Thirty groundwater samples had detections
of ethylbenzene, m- and p-xylenes, or o-xylene censored
by application of SRLs equal to the highest concentration
measured in QCFBs; these detections would not have been
censored had the BD-90/90 values been selected as the SRLs.

Quality-Control Assessment Results 41
Table 7. Values of study reporting levels (SRLs) for the 18 VOCs detected in field blanks or source-solution blanks determined from the set of 167 quality-control field blanks
using four methods, and changes in detection frequencies in the set of 2,026 groundwater samples with application of the different SRLs, California GAMA Priority Basin Project,
May 2004 through September 2010.
[LT-MDL, long-term method detection level; BD-95/90, 90-percent upper condence limit of the 95th percentile; BD-90/90, 90-percent upper condence limit of the 90th percentile; QCFB, quality-control eld
blanks; µg/L, micrograms per liter; %, percent; –, not detected; NA, not applicable]
Detection
frequency
in 2,026
groundwater
samples
(percent)
BD-90/90 BD-95/90 Maximum QCFB Maximum LT-MDL
90th
percentile
(µg/L)
SRL
BD-90/90
(µg/L)
Detection
frequency
after
application
of SRL
(percent)
95th
percentile
(µg/L)
SRL
BD-95/90
(µg/L)
Detection
frequency
after
application
of SRL
(percent)
SRL
maximum
QCFB (µg/L)
Detection
frequency
after
application
of SRL
(percent)
SRL
maximum
LT-MDL
(µg/L)
Detection
frequency
after
application
of SRL
(percent)
Hydrocarbons
Benzene 1.6 – – no change – – no change – no change 0.013 1.4
Ethylbenzene 0.9 – – no change 0.022 0.022 0.7 0.060 0.2 0.02 0.7
Styrene 0.1 – – no change – – no change – no change 0.021 no change
Toluene 7.7 0.036 0.048 1.6 0.060 0.104 0.8 0.686 0.2 0.03 2.6
1,2,4-Trimethylbenzene 11 – – no change 0.035 0.069 3.9 0.556 0.2 0.028 8.4
m- and p-Xylenes
1.9 –
0.033 1.5 0.083 0.118 0.3 0.328 0 0.04 1.1
o-Xylene
0.7 – – no change 0.020 0.040 0.4 0.120 0.05 0.02 0.6
Solvents
Acetone
1
0.4 – – NA
1
– – NA
1 2
1.938 NA
1
3 0.2
2-Butanone
1
0.4 – – NA
1
– – NA
1
– NA
1
1 0.4
1,1-Dichloroethene 3.4 – – no change – – no change – no change 0.012 no change
Dichloromethane 1.5 – – no change – – no change 0.028 1.1 0.03 1.0
Tetrachloroethene 13 – – no change – – no change 0.148 5.1 0.03 9.6
Tetrahydrofuran
1
1.2 – – NA
1
– – NA
1
– NA
1
1.1 1.0
Trichloroethene 6.2 – – no change – – no change 0.093 3.8 0.019 6.0
Other VOCs
Bromodichloromethane 6.3 – – no change – – no change – no change 0.02 6.2
Carbon disulde
4.3 – – no change – 0.056 1.7
3
0.092 1.2 0.03 3.3
Chloroform 27 – – no change – – no change 0.127 9.3 0.02 23
Trichlorouoromethane 2.0 – – no change – – no change 0.100 1.2 0.08 1.4
1
The SRL approach cannot be applied to acetone, 2-butanone, and tetrahydrofuran. Detections in groundwater samples reported by the laboratory were reviewed and rejected.
2
Maximum concentrations of acetone in the source-solution blanks and laboratory blanks were 2.842 µg/L and 1.957 µg/L, respectively.
3
Maximum concentrations of carbon disulde in the source-solution blanks and laboratory blanks were 0.089 µg/L and 0.490 µg/L, respectively.

42 VOC Blank Data and Study Reporting Levels, California GAMA PBP, 2004–2010
Table 8. Study reporting levels (SRLs) and number of data censored by application of the SRLs, California GAMA Priority Basin Project,
May 2004 through September 2010.
[SRL method: BD-95/90, eld blank having rank corresponding to the upper 90-percent condence interval of the 95th percentile determined using the binomial
distribution; max QCFB, maximum concentration in the set of quality-control eld blanks; max LT-MDL, maximum long-term method detection level used
during period samples were analyzed. Other abbreviations: NA, not applicable; n, number; µg/L, micrograms per liter]
Constituent SRL SRL method
Detection frequency
(percent)
Long and short sampling
lines (n = 1,859)
Monitoring-well
equipment (n = 167)
Original SRL applied Original SRL applied
Hydrocarbons
Benzene No SRL BD-95/90 1.2 1.2 6.0 6.0
Ethylbenzene SRL = 0.06 µg/L max QCFB 0.6 0.2 4.2 0
Styrene No SRL BD-95/90 0.2 0.2 0 0
Toluene SRL = 0.69 ug/L max QCFB 6.0 0.2 26 0.6
1,2,4-Trimethylbenzene SRL = 0.56 µg/L max QCFB 11 0.2 8.4 0.6
m- and p-Xylenes
SRL = 0.33 µg/L max QCFB 1.2 0 9.6 0
o-Xylene
SRL = 0.12 µg/L max QCFB 0.4 0.1 4.2 0
Solvents
Acetone Report all detections as “not analyzed” NA
1
0.3 0 1.8 0
2-Butanone Report all detections as “not analyzed” NA
1
0.3 0 2.4 0
1,1-Dichloroethene No SRL BD-95/90 3.6 3.6 0.6 0.6
Dichloromethane No SRL BD-95/90 1.5 1.5 1.2 1.2
Tetrachloroethene No SRL BD-95/90 13 13 6.6 6.6
Tetrahydrofuran Report all detections as “not analyzed” NA
1
0.8 0 5.4 0
Trichloroethene No SRL BD-95/90 6.7 6.7 1.2 1.2
Other VOCs
Bromodichloromethane No SRL BD-95/90 6.7 6.7 2.4 2.4
Carbon disulde SRL = 0.03 LT-MDL 3.8 3.0 9.6 6.6
Chloroform No SRL for long or short lines;
SRL = 0.02 µg/L for monitoring wells
BD-95/90
LT-MDL
27 27 18
14.4
Trichlorouoromethane No SRL BD-95/90 2.2 2.2 0 0
1
The SRL approach was not applied to acetone, 2-butanone, or tetrahydrofuran because there is no threshold concentration above which concentrations in
groundwater samples can be considered representative of environmental conditions (see text for discussion).
Of these 30 samples, 8 (27 percent) had detections of benzene
and at least two of the other four characteristics suggestive of
geogenic sources of hydrocarbons (elevated ethylbenzene/
m-and p-xylenes or o-xylene/m- and p-xylenes ratios, no
VOCs other than hydrocarbons and carbon disulde detected,
tritium < 1 TU, and deep wells). However, concentrations
of ethylbenzene, m- and p-xylenes, and o-xylene in these
8 samples were indistinguishable from concentrations in the
other 22 samples that showed no relations between detections
of ethylbenzene, m- and p-xylenes, and o-xylene and presence
or absence of detections of other VOCs, groundwater age, well
depth, or land use.
SRLs dened on the basis of the maximum concentration
in the QCFBs may not be robust because collection of
additional eld blanks may result in an increase in the
maximum concentration. Because of the relatively large
number of QCFBs, however, the probability that additional
eld blanks collected under the same conditions would yield a
higher concentration is relatively small. For 167 eld blanks,
the probability that the maximum measured concentration is
the true maximum concentration is 98.6 to 100 percent, at a
90-percent condence level.

Quality-Control Assessment Results 43
Table 9. Raw detection frequencies by study unit of volatile organic compounds (VOCs) before and after application of study reporting limits (SRLs), California GAMA Priority
Basin Project, May 2004 through September 2010.
[Detection frequencies are not area-weighted; they are raw detection frequencies indicating the percentage of detections among the total number of groundwater samples. Thus, original detection frequencies
may not be the same as those reported for grid well networks in the Data Series Reports for individual study units. Study unit names given in table 1. Detection frequencies of zero are indicated by the – symbol]
Study
unit
Number
of
samples
Ethylbenzene
1,2,4-
Trimethyl-
benzene
Toluene
m- and p-
Xylenes
o-Xylene Acetone 2-Butanone
Tetrahy-
drofuran
Carbon
disulfide
Chloroform
Initial Final Initial Final Initial Final Initial Final Initial Final Initial Final Initial Final Initial Final Initial Final Initial Final
Desert study units
D1 57 – – 3.5 – 40 – – – – – – – – – – – – – 37 37
D2 59 – – 12 – 5.1 1.7 – – – – – – – – 3.4 – – – 29 29
D3 35 – – – – 29 – – – – – – – – – – – – – 23 23
D4 28 – – 14 – – – – – – – – – – – – – –
– 14 14
D5 52 – – 23 5.8 5.8 – – – – – 1.9 – – – – – – – 27 27
Mountain study units
M1 83 – – 4.8 – 3.6 – – – – – – – – – 1.2 – 1.2 – 22 22
M2 75 – – 6.7 – 8.0 – – – – – – – – – 2.7 – 5.3 2.7 12 12
M3 50 – – – – 4.0 – – – – – – – – – – – – – 14 14
M4 30 – – – – 6.7 – – – – – 3.3 – 3.3 – 3.3 – 3.3 3.3 17 17
M5 53 – – 40 – 3.8 – – – – – – – – – 3.8 – 1.9 1.9
30 30
M6
1
72 – – 61 – 1.4 – – – – – 1.4 – – – – – 4.2 4.2 13 13
North and Central Coast study units
N1 30 – – 30 – 3.3 – – – – – – – – – – – 3.3 3.3 27 27
N2 28 – – 36 – – – – – – – – – – – – – 7.1 7.1 25 25
N3 108 0.9 – 17 – 5.6 – 3.7 – 1.9 – 0.9 – 1.9 – 1.9 – 7.4 6.5 17 17
N4 79 – – – – 7.6 – – – – – 2.5 – 1.3 – 3.8 – 5.1 3.8 27 27
N5 54 – – – – 1.9 – – – – – – – 1.9 – 1.9 – 1.9 – 19 19
N6
97 1.0 1.0 7.2 – 4.1 – 1.0 – – – – – 1.0 – 2.1 – 6.2 5.2 22 22
N7 70 – – 26 – 5.7 – – – – – – – – – 1.4 – – – 16 16
South Coast study units
S1 53 – – – – 13 1.9 1.9 – – – – – – – 1.9 – 3.8 3.8 17 15
S2 69 1.4 – 2.9 – 5.8 1.4 1.4 – – – – – – – 1.4 – 7.2 5.8 45 45
S3 52 – – 1.9 – 5.8 – 1.9 – – – – – – – – – 17 15 79 79
S4 99 – – 19 – 5.1 – – – – – – – – – – – – – 72 72
S5 58
– – – – 6.9 – – – – – – – – – – – 1.7 1.7 31 31

44 VOC Blank Data and Study Reporting Levels, California GAMA PBP, 2004–2010
Table 9. Raw detection frequencies by study unit of volatile organic compounds (VOCs) before and after application of study reporting units (SRLs), California GAMA Priority
Basin Project, May 2004 through September 2010.—Continued
[Detection frequencies are not area-weighted; they are raw detection frequencies indicating the percentage of detections among the total number of groundwater samples. Thus, original detection frequencies
may not be the same as those reported for grid well networks in the Data Series Reports for individual study units. Study unit names given in table 1. Detection frequencies of zero are indicated by the – symbol]
Study
unit
Number
of
samples
Ethylbenzene
1,2,4-
Trimethyl-
benzene
Toluene
m- and p-
Xylenes
o-Xylene Acetone 2-Butanone
Tetrahy-
drofuran
Carbon
disulfide
Chloroform
Initial Final Initial Final Initial Final Initial Final Initial Final Initial Final Initial Final Initial Final Initial Final Initial Final
Central Valley study units
V1 66 4.5 – 6.1 – 7.6 – 6.1 – 6.1 – – – 1.5 – 1.5 – 1.5 1.5 12 12
V2 87 – – 10 – 1.1 – – – – – 1.1 – 1.1 – – – 4.6 3.5 16 16
V3 87 1.1 – 1.1 – 14 – 5.7 – – – 1.1 – – – 1.1 – 14 6.9 33 33
V4 75 6.7 – 9.3 1.3 35 – 11 – 5.3 – – – – – 2.7 – 2.7
1.3 29 27
V5 78 1.3 1.3 2.6 – 3.8 1.3 1.3 – – – – – – – – – 3.8 2.6 26 24
V6 35 – – 5.7 – 2.9 – – – – – – – – – – – – – 17 17
V7 101 3.0 2.0 5.0 – 5.0 – 13 – 3.0 1.0 1.0 – 1.0 – 1.0 – 7.9 6.9 28 28
V8 50 2.0 – 4.0 – 4.0 – – – – – – – – – – – 4.0 4.0 28 26
V9 56 1.8 – 1.8 – 1.8 – – – 1.8 – – – – – – – 11 8.9 7.1 5.4
All 2,026 0.9 0.2 11 0.2 7.7 0.2 1.9 – 0.7 0.05 0.4 – 0.4 – 1.2 – 4.3 3.3 27
26
1
An additional 18 samples were collected for study unit M6 in October 2010.

Quality-Control Assessment Results 45
Bender and others (2011) also reported detection
frequencies of ethylbenzene, m- and p-xylenes, and o-xylene
in eld blanks collected at production wells and at monitoring
wells greater than detection frequencies in groundwater
samples collected at those site types. Field blanks collected
at production wells by the GAMA Program (this study) and
by the NAWQA Program (Bender and others, 2011) had
similar detection frequencies for each of these three VOCs
(g. 3). However, the SRLs calculated by Bender and others
(2011) have much lower concentrations (g. 14) because
they used the BD-90/90 method to calculate SRLs. For the
278 production well eld blanks used by Bender and others
(2011), the BD-90/90 corresponds to the 258
th
-ranked eld
blank, which yielded SRLs of 0.008 µg/L for ethylbenzene
and 0.02 µg/L for m- and p-xylenes (the method yielded no
SRL for o-xylene because the 258
th
-ranked eld blank was
a non-detection). These SRLs result in little censoring of
groundwater data. Application of the BD-90/90 method to the
167 QCFBs in this study would have resulted in (1) no SRLs
for ethylbenzene or o-xylene (table 7) because the 156
th
-
ranked eld blank was a non-detection, and (2) an SRL of
0.033 µg/L for m- and p-xylenes. The BD-90/90 method does
not yield an SRL if the detection frequency in the eld blanks
is less than approximately 7 percent.
Benzene and styrene were detected in laboratory
instrument blanks and in eld blanks affected by methanol
(tables 4, 6; gs. 11, 12). Neither was detected in the QCFBs;
therefore, none of the four methods for determining SRLs
yielded concentrations. The BD-99/90 for benzene in
laboratory instrument blanks was 0.006 µg/L, which was
lower than all of the concentrations detected in groundwater
samples (g. 11). No SRLs are recommended for benzene or
styrene on the basis of detections in the blanks (table 8).
Toluene
Toluene, like ethylbenzene, m- and p-xylenes, and
o-xylene, was detected more frequently in blanks than in
groundwater samples; it is discussed separately, however,
because the patterns of toluene detections differed from those
of the other hydrocarbons. Toluene was the most frequently
detected VOC in laboratory instrument blanks, source-solution
blanks, and eld blanks (table 4; g. 15).
Inferred Mechanisms of Contamination
The relations between toluene and other hydrocarbons
and of the relative detection frequencies of toluene in
laboratory instrument blanks, source-solution blanks, the
various subsets of eld blanks, and groundwater samples
suggest that there are multiple sources of contamination for
toluene. Although toluene concentrations in blanks were
signicantly correlated to concentrations of ethylbenzene,
m- and p-xylenes, and o-xylene in blanks (p < 0.001 for
Spearman’s rho tests), the relations were not dominated by
single linear correlations as they were among ethylbenzene
and the xylenes (g. 13E). Contamination of equipment
and vials by vehicle exhaust of fuel fumes may result in
contamination of blanks and groundwater samples by toluene
along with ethylbenzene and the xylenes; however, additional
signicant sources of toluene contamination are required to
account for the relative detection frequencies.
Unlike ethylbenzene and the xylenes, toluene was
detected less frequently in QCFBs (28 percent) than in
source-solution blanks (41 percent) (table 4), and there was
no signicant difference in toluene occurrence between
QCFBs collected with long and short sampling lines (table 6).
This suggests that contact with eld equipment was not the
dominant source of contamination by toluene. The presence
of toluene in laboratory instrument blanks (4.2 percent)
indicates that there was a source of contamination in
laboratory processes. The detection frequency of toluene
in source-solution blanks was signicantly higher than in
laboratory instrument blanks, suggesting that either the vials
or processes occurring during transit to the eld site also
are sources of contamination. The detection frequency in
groundwater samples (7.7 percent) was signicantly lower
than in source-solution blanks or eld blanks, indicating that
processes occurring during transit after sample collection
could not have been a large source of contamination. These
observations suggest that the primary sources of contamination
were toluene that enters the bottles of source blank water after
the initial certicates of analysis are produced and toluene that
was present in the vials at the time of purchase and (or) that
entered the vials during transit to the eld.
Contamination of blanks by toluene derived from
contact with eld equipment is discernible when the blank
data are divided into different concentration ranges. Of the
320 total eld blanks and source-solution blanks, 121 have
detections of toluene (tables A2, A3). Two-thirds of the
toluene detections had concentrations less than 0.03 µg/L (a
value equal to the maximum LT-MDL, table 7), and one-third
had concentrations between 0.03 µg/L and 0.69 µg/L.
The group of eld and source-solution blanks with higher
toluene concentrations had hydrocarbon ratios and relations
between detection frequencies and sample-collection
equipment congurations similar to those observed for eld
blanks contaminated with ethylbenzene, o-xylene, and m-and
p-xylenes. The group with higher toluene concentrations had
a signicantly higher detection frequency of m- and p-xylenes
(68 percent) compared to the group with lower toluene
concentrations (12 percent detection frequency of m- and
p-xylenes; contingency table tests, p<0.001). Toluene and
m- and p-xylene concentrations had a strong linear correlation
in the group with higher toluene concentrations (g. 13D).
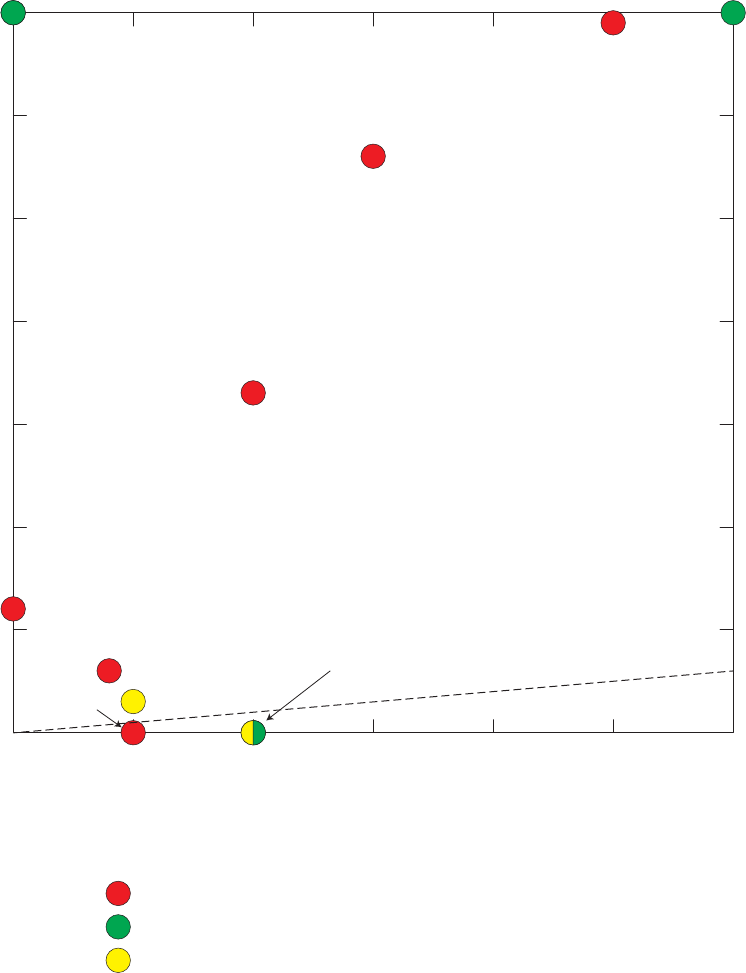
46 VOC Blank Data and Study Reporting Levels, California GAMA PBP, 2004–2010
IP031454_Figure 14. compare
NAWQA study reporting level, in micrograms per liter
0 0.01 0.02 0.03 0.04 0.05 0.06
GAMA study reporting level, in micrograms per liter
0
0.1
0.2
0.3
0.4
0.5
0.6
0.7
toluene
1,2,4-trimethylbenzene
m- and p-xylenes
o-xylene
dichloromethane
chloroform
carbon disulfide
ethylbenzene
styrene
1:1 line
2-butanone*
tetrahydrofuran*
acetone*
Hydrocarbons
Solvents
Other VOCs
EXPLANATION
*For GAMA, all detections of acetone, 2-butanone, and
tetrahydrofuran in groundwater samples are censored. For
NAWQA, acetone’s SRL is 1 microgram per liter, and
2-butanone and tetrahydrofuran have no SRLs. [NAWQA
SRLs are the SRLs determined for public-supply and
domestic wells by Bender and others (2011).]
Figure 14. Concentrations of study reporting levels (SRLs) established from field blanks
collected for the California GAMA Priority Basin Project, May 2004 through September 2010, and
SRLs established from field blanks collected at production wells for the National Water-Quality
Assessment (NAWQA) Program (Bender and others, 2011).
Quality-Control Assessment Results 47
IP031454_Figure 15. toluene
2004 2005 2006 2007 2008 2009 2010
0
0.02
0.04
0.06
0.08
0.10
Toluene concentration, in micrograms per liter
Date of sample collection
Quality-control field blank (QCFB, n=167)
Monitoring-well field blank (n=18)
Field blank contaminated by methanol (n=26)
Source-solution blank (n=109)
Laboratory instrument blank (n=2,411)
Groundwater—Long or short lines (n=1,859)
Groundwater—Monitoring well (n=167)
EXPLANATION
Sample type (only detections are shown)
Thresholds
Long-term method detection level (LT-MDL)
Study reporting level (SRL)
0
0.2
0.4
0.6
0.8
1.2
2
4
6
8
1.0
Toluene concentration, in micrograms per liter
Figure 15. Concentrations of toluene detected in field blanks, source-solution blanks, laboratory
blanks, and groundwater samples, California GAMA Priority Basin Project, May 2004 through
September 2010. Non-detections are not shown.

48 VOC Blank Data and Study Reporting Levels, California GAMA PBP, 2004–2010
The ratio was slightly higher than observed in ambient urban
air (g. 13E), suggesting that there may be a systematic
fractionation. The group with higher toluene concentrations
also had a signicantly higher proportion of eld blanks
(80 percent eld blanks, 20 percent source-solution blanks)
compared to the group with the lower toluene concentrations
(54 percent eld blanks) (contingency test, p = 0.006),
suggesting that contact with eld equipment increased
contamination with toluene over the contamination present
in source-solution blanks. The detection frequency of toluene
with a concentration greater than 0.03 µg/L was signicantly
greater in QCFBs collected with long sampling lines compared
to short sampling lines, and in eld blanks contaminated
with methanol compared to QCFBs (contingency table tests,
p = 0.013 and p <0.001, respectively). This is similar to the
pattern observed for ethylbenzene, o-xylene, and m- and
p-xylenes (table 6), suggesting that higher concentrations of
toluene contamination in eld blanks likely have the same
origin as contamination with ethylbenzene, o-xylene, and
m- and p-xylenes—exposure of the water or sampling
equipment to fuel exhaust vapors.
In contrast, the group of blanks with lower concentrations
of toluene appeared to be contaminated by toluene from a
different source(s). There were no signicant differences
in detection frequency of toluene with concentrations less
than 0.03 µg/L between methanol-contaminated eld blanks
compared to QCFBs (contingency table test, p = 0.42), or
between QCFBs collected with long sampling lines compared
to short sampling lines (contingency table test, p = 0.78).
These patterns are consistent with the source of contamination
being the vials and the source-blank water, as inferred
from comparison of detection frequencies in laboratory
instrument blanks, source-solution blanks, eld blanks, and
groundwater samples.
SRL for Toluene
The detection frequency of toluene in groundwater
without censoring is 7.7 percent. On the basis of the
inferred mechanisms of contamination for eld blanks
and groundwater samples, a large portion of the detections
in groundwater samples may be the result of extrinsic
contamination, suggesting that an SRL that results in
censoring of a large portion of the groundwater data may
be most appropriate. However, the highest concentration
measured in groundwater samples was 10 times higher than
the highest concentration measured in eld blanks, suggesting
that at least some of the detections in groundwater are likely to
represent intrinsic, rather than extrinsic contamination.
SRLs derived from the four methods all result in
substantial reduction in the detection frequency of toluene
in groundwater samples (table 7). If an SRL were calculated
using the maximum QCFB method, detection frequency in
groundwater samples would decrease from 7.7 to 0.2 percent,
and if the maximum LT-MDL method were used, the detection
frequency would be 2.6 percent. The detection frequencies
that resulted by using SRLs computed from the BD-95/90 and
BD-90/90 were 0.8 and 1.6 percent, respectively. Given the
multiple potential sources of extrinsic toluene contamination
and the likelihood that some of the detections in groundwater
are indicative of intrinsic contamination, the SRL based on
the QCFB method—0.69 µg/L—was selected (table 8). Of
the 156 toluene detections in groundwater samples, 152 were
censored by application of the SRL.
Bender and others (2011) also reported detection
frequencies of toluene in eld blanks collected at production
wells and at monitoring wells greater than detection
frequencies in groundwater samples collected at those site
types. The detection frequency in eld blanks collected at
production wells was 34 percent, which is similar to the
detection frequency observed in eld blanks collected for
GAMA (g. 3); however, the SRL calculated by Bender and
others (2011) had a much lower concentration than the SRL
selected during this study (g. 14). Bender and others (2011)
used the BD-90/90 method to calculate the SRL of 0.05 µg/L
for data from production wells; the BD-90/90 method applied
to the QCFBs in this study would have yielded an SRL with
nearly the same concentration (table 7).
1,2,4-Trimethylbenzene
The occurrence patterns of 1,2,4-trimethylbenzene in
blanks and groundwater samples were quite different from
the patterns observed for any of the other hydrocarbons. The
1,2,4-trimethylbenzene concentration was not signicantly
correlated with concentrations of toluene or m- and p-xylenes
(p>0.05, Spearman’s rho tests; g. 13F). Fifty-nine percent
of blanks and 49 percent of groundwater samples containing
1,2,4-trimethylbenzene had no other detections of VOCs.
Detections of 1,2,4-trimethylbenzene commonly occurred in
clusters in time (g. 16). Detection frequency in groundwater
samples (11 percent) was greater than in QCFBs (6.0 percent)
or source-solution blanks (6.4 percent) (table 4), and the
ranges of concentrations measured in the groundwater samples
and blanks were similar (g. 13F).
Quality-Control Assessment Results 49
IP031454_Figure 16. 1,2,4-tmb
1,2,4-Trimethylbenzene concentration, in micrograms per liter
Date of sample collection
2004 2005 2006 2007 2008 2009 2010
0
0.05
0.10
0.15
0.20
0.25
0.5
1.0
1.5
2.0
Quality-control field blank (QCFB, n=167)
Monitoring-well field blank (n=18)
Field blank contaminated by methanol (n=26)
Source-solution blank (n=109)
Laboratory instrument blank (n=2,411)
Groundwater—Long or short lines (n=1,859)
Groundwater—Monitoring well (n=167)
EXPLANATION
Sample type (only detections are shown)
Thresholds
Long-term method detection level (LT-MDL)
Study reporting level (SRL)
Figure 16. Concentrations of 1,2,4-trimethylbenzene detected in field blanks, source-solution blanks,
laboratory blanks, and groundwater samples, California GAMA Priority Basin Project, May 2004 through
September 2010. Non-detections are not shown.

50 VOC Blank Data and Study Reporting Levels, California GAMA PBP, 2004–2010
Inferred Mechanisms of Contamination
An understanding of the probable source of
contamination was useful for selecting an appropriate
recommended SRL for 1,2,4-trimethylbenzene. As with the
other hydrocarbons, the relative detection frequencies in
laboratory instrument blanks, source-solution blanks, the
various subsets of eld blanks, and groundwater samples
provided data as to the likely source of contamination
with 1,2,4-trimethylbenzene. The detection frequencies
of 1,2,4-trimethylbenzene in source-solution blanks and
QCFBs were not signicantly different (table 4), suggesting
that contact with eld sample-collection equipment was
not a source of contamination. However, QCFBs collected
with monitoring-well equipment and QCFBs collected with
long sampling lines had signicantly greater occurrence of
1,2,4-trimethylbenzene than QCFBs collected with short
sampling lines (table 6), suggesting that contact with eld
sample-collection equipment was a source of contamination.
1,2,4-Trimethylbenzene was the only hydrocarbon that
did not have signicantly greater occurrence in eld
blanks contaminated with methanol (table 6), suggesting
that unlike the other hydrocarbons, the occurrence of
1,2,4-trimethylbenzene in eld blanks was not related to
the amount of rinsing of sampling equipment that occurred
during collection of the eld blanks. These seemingly
contradictory observations suggest that contamination with
1,2,4-trimethylbenzene was caused by a difference between
sample collection with short sampling lines and sample
collection with long sampling lines or monitoring-well
equipment that was not related to increased contact
with equipment.
One difference between sites sampled with short
sampling lines and sites sampled with long sampling lines
or monitoring-well equipment is that samples for radon-222
analysis were more likely to be collected with the latter two
equipment types. The scintillation media in the vials used
to collect radon-222 samples is a mixture of mineral oil and
1,2,4-trimethylbenzene (Horton, 1983; Whittaker and others,
1989; Vitz and Martin, 1991). Therefore, samples collected
with long sampling lines or monitoring-well equipment were
more likely to be collected under conditions where a potential
source of 1,2,4-trimethylbenzene was present than were
samples collected with short sampling lines.
Radon-222 samples were not collected at all sites
sampled for the GAMA-PBP. Radon-222 samples were
collected at 616 (30 percent) of the 2,026 sites sampled (see
references in table A1 for data). In most study units for which
radon-222 samples were collected, they were only collected
at sites where samples for the larger suite of analytes were
collected. Samples for radon-222 were not collected at sites
sampled for only the core suite of analytes. Most sites at which
the larger suite of analytes were collected were sampled with
long sampling lines or monitoring-well equipment, and most
sites at which only the core suite of analytes were collected
were sampled with short sampling lines. Long sampling lines
or monitoring-well equipment were used at 82 percent of the
sites at which a sample for radon-222 was collected. Samples
for radon-222 were collected at 37 percent of the sites at which
eld blanks were collected These data indicate that a potential
source of contamination of 1,2,4-trimethylbenzene—the vials
used to collect radon-222 samples—were more likely to be
present at sites where long sampling lines or monitoring-well
equipment was used, which may account for the higher
occurrence of 1,2,4-trimethylbenzene in eld blanks collected
with long sampling lines compared to short sampling lines.
Further examination of the correlations between
collection of radon-222 samples and occurrence of
1,2,4-trimethylbenzene provided additional evidence
that collection of radon-222 samples is responsible for
contamination of groundwater samples and blanks by
1,2,4-trimethylbenzene. The detection frequency of
1,2,4-trimethylbenzene in groundwater samples from sites
where a sample for radon-222 was collected (29 percent)
was signicantly greater than the detection frequency
in groundwater samples from sites where a sample for
radon-222 was not collected (4.1 percent) (contingency
table test, p<0.001) (g. 17A). The detection frequency
of 1,2,4-trimethylbenzene in eld and source-solution
blanks collected at sites where radon-222 samples were
collected (16 and 13 percent, respectively) also were
signicantly greater than the detection frequency in eld
and source-solution blanks from sites where radon-222
samples were not collected (2.4 and 1.6 percent, respectively)
(contingency table tests, p<0.001 and p=0.019) (g. 17A).
There were no signicant differences in detection frequencies
between eld blanks and source-solution blanks.
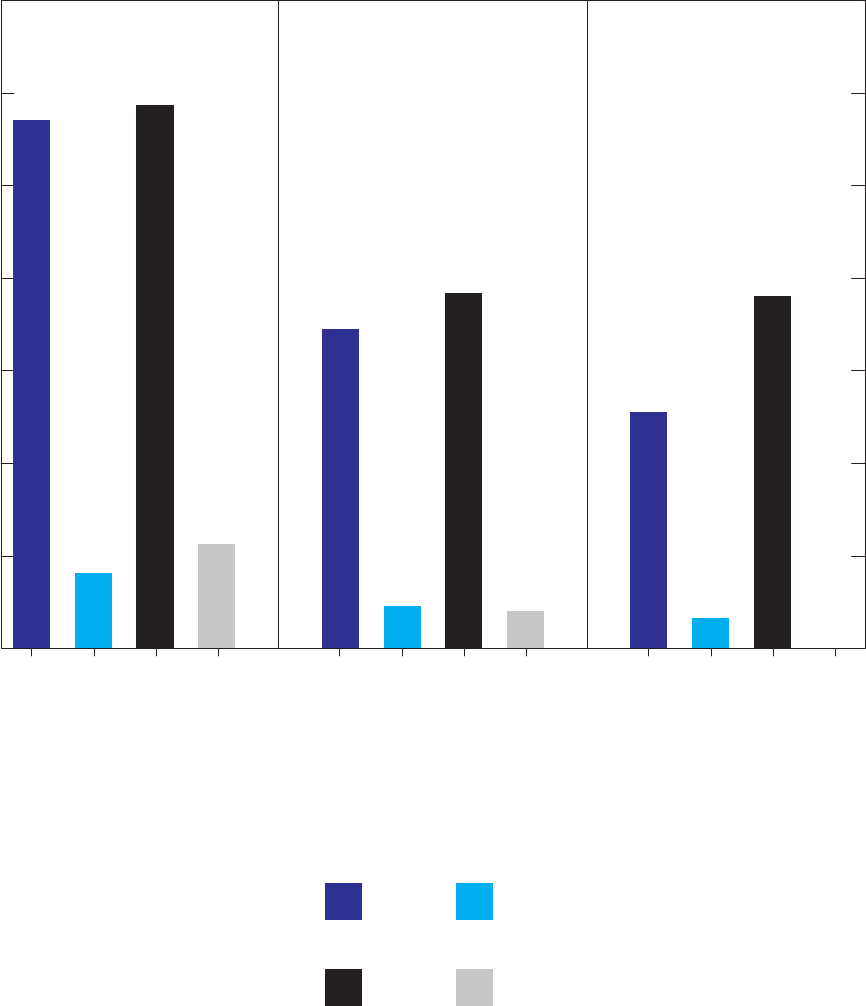
Quality-Control Assessment Results 51
IP031454_Figure 17a. 1,2,4-tmb
A
1,2,4-Trimethylbenzene detection frequency, in percent
0
5
10
15
20
25
30
35
EXPLANATION
Radon collected at site
Radon collected at previous site
Groundwater samples Field blanks Source-solution blanks
YES
NOYES
NO
n = 813 n = 1,525
n = 576 n = 1,026
Radon collected at same site or at previous site
Yes No
Yes No
Same Previous
n = 87 n = 129
n = 52 n = 98
Yes No
Yes No
Same Previous
n = 47 n = 60
n = 21 n = 43
Yes No
Yes No
Same Previous
The number of sites in each category at which groundwater
samples, field blanks, or source-solution blanks were
collected is given below the bar.
Figure 17. Relations between detection frequencies of 1,2,4-trimethylbenzene in groundwater samples and
blanks and (A) whether or not samples for analysis of radon-222 were collected at the same site or previous
site, and (B) which GAMA field vehicle visited the site, California GAMA Priority Basin Project, May 2004
through September 2010.
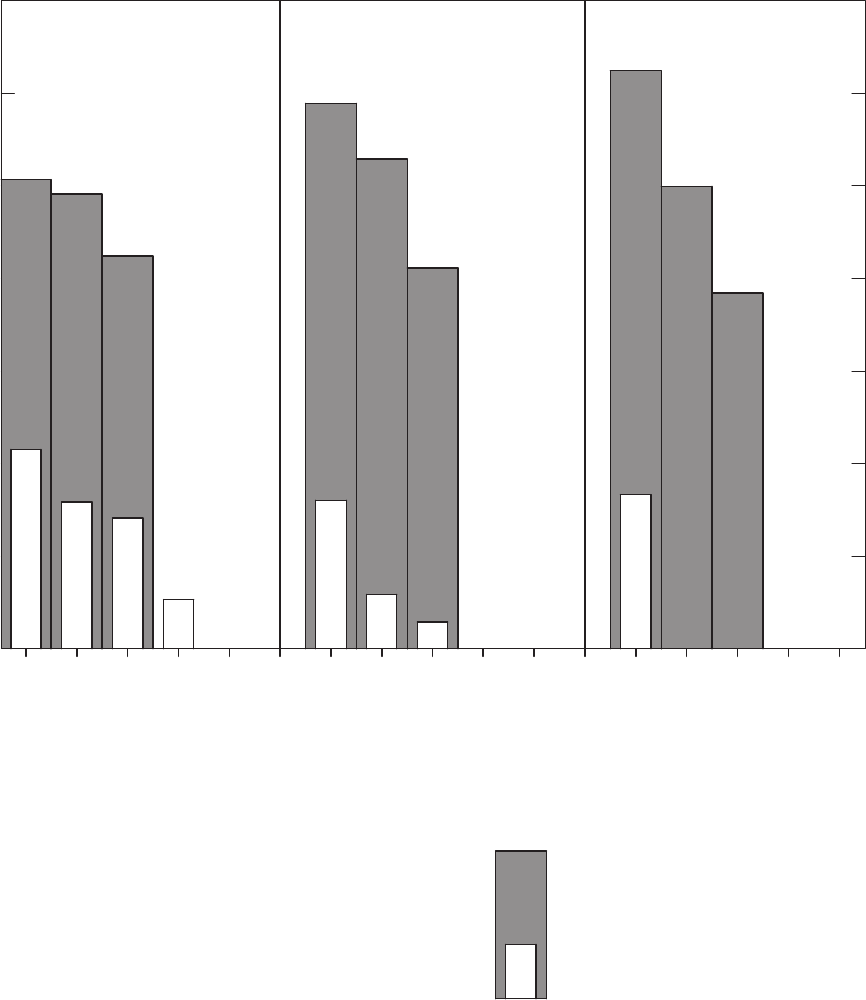
52 VOC Blank Data and Study Reporting Levels, California GAMA PBP, 2004–2010
Percentage of sites
0
10
20
30
40
50
70
60
W
n = 501
X
n = 289
G
n = 318
B
n = 112
V
n = 282
W
n = 56
X
n = 34
G
n = 34
B
n = 2
V
n = 21
W
n = 24
X
n = 14
G
n = 13
B
n = 3
V
n = 9
Groundwater samples Field blanks Source-solution blanks
Vehicle visiting site
EXPLANATION
USGS-GAMA vehicles
W = White lab
X = X-Lab
G = Green Lab
B = Blue Lab
V = Van
Sample for radon
collected
1,2,4-Trimethylbenzene
detected
Five field vehicles were used to visit sites and collect samples for the California GAMA Priority Basin Project
between May 2004 and September 2010. The number of sites visited by each vehicle for collection of
groundwater samples, field blanks, or source-solution blanks is given below the vehicle letter code.
Percentage of sites
IP031454_Figure 17b. 1,2,4-tmb
B
Figure 17.—Continued

Quality-Control Assessment Results 53
The detection of 1,2,4-trimethylbenzene in groundwater
samples and in blanks also had similar relations to whether or
not radon-222 samples had been collected at a previous site
visited by a particular sampling vehicle. The GAMA-PBP uses
ve different sampling vehicles, and the identity of the vehicle
was recorded for nearly all sites visited between October 2005
and September 2010. Nearly all of the detections of
1,2,4-trimethylbenzene in groundwater samples and all of the
detections in eld blanks and source-solution blanks occurred
at sites visited by three of the vehicles, the X-Lab, the White
Lab, or the Green Lab (g. 17B). The other two vehicles
(the Blue Lab and the Van Lab) were never used at sites
where samples were collected for radon-222, and although
24 percent of the groundwater samples were collected in these
two vehicles, only 2.9 percent of the 1,2,4-trimethylbenzene
detections in groundwater samples occurred in samples
collected using these two vehicles. The six detections of
1,2,4-trimethylbenzene in groundwater samples that were
collected in the Blue Lab were collected during two different
weeks (one week in study unit V2, one week in study unit
V7), and in both cases, groundwater samples collected in the
White Lab in the same study unit during the same week had
detections of 1,2,4-trimethylbenzene.
How and when does the 1,2,4-trimethylbenzene from
the radon-222 vials reach the VOC vials? The VOC sample
is collected and vials are sealed at the beginning of the
sample collection sequence, and the radon-222 sample is
collected near the end of the sample collection sequence. At
sites sampled with long sampling lines or monitoring-well
equipment, VOCs are collected inside the eld vehicle, and
radon is collected outside at the well head. Furthermore, eld
blanks and source-solution blanks are not collected for radon-
222. Thus, direct exposure of VOC samples at the eld site to
the 1,2,4-trimethylbenzene in the radon-222 sample vial used
at the same eld site is unlikely.
The correlation between 1,2,4-trimethylbenzene
occurrence and sampling vehicle (g. 17B) and whether or
not a sample for radon-222 was collected at the previous
site (g. 17A) suggest that radon-222 sampling can cause
contamination of eld vehicles with 1,2,4-trimethylbenzene.
1,2,4-Trimethylbenzene is highly soluble in the mineral oil
and would be expected to volatilize gradually, potentially
contaminating the vehicle over time. The fact that detection
frequencies of 1,2,4-trimethylbenzene were not signicantly
different between eld blanks and source-solution blanks
may suggest that the 1,2,4-trimethylbenzene was present in
the atmosphere in the vehicle and entered the blank water
by partial equilibration between the blank water and the
atmosphere. The kits used for radon sampling are stored in
the vehicle, and gloves that may have come in contact with
the scintillation uid during collection of the radon samples
generally are disposed of inside the vehicle. Field personnel
had not been told that the scintillation uid may present a
contamination problem.
SRL for 1,2,4-Trimethylbenzene
The methods for calculating SRLs yield SRLs for
1,2,4-trimethylbenzene that would result in vastly different
amounts of censoring to the groundwater data (table 7).
Application of the BD-90/90 method would result in no
censoring of the groundwater data, and at the other extreme,
use of the maximum concentration measured in the QCFBs
as the SRL would result in reducing the detection frequency
in groundwater samples from 11 to 0.2 percent. Because
of the strong association between 1,2,4-trimethylbenzene
contamination in blanks and groundwater samples and
presence of materials connected with collection of samples
for radon-222, it is likely that a large portion of the detections
in groundwater samples may be the result of contamination.
This suggests that an SRL that results in censoring of a large
portion of the groundwater data may be most appropriate.
The SRL derived from the maximum concentration
in the QCFBs, 0.556 µg/L, was selected (table 8) and
results in censoring nearly all of the groundwater data
for 1,2,4-trimethylbenzene (table 8; g. 16). Uncensored
detections of 1,2,4-trimethylbenzene occurred in 216
groundwater samples distributed across 25 of the 32 study
units (table 9). After application of the SRL, there are only
four detections in two study units.
Other information about the four groundwater samples
having detections of 1,2,4-trimethylbenzene after application
of the SRL suggests that these four detections also may be
the result of extrinsic contamination and not representative
of aquifer conditions. Three of the samples were collected in
the Green Lab (during study unit D5 data collection). All 52
sites for study unit D5 were sampled by using the Green Lab
or the X-Lab, and samples for radon-222 were collected at
46 percent of the sites. In addition to the three samples with
detections of 1,2,4-trimethylbenzene in groundwater with
concentrations above the SRL, eight samples had detections
with concentrations below the SRL that were censored by
application of the SRL. The vehicle used for one sample was
not recorded (study unit V4). Among the four groundwater
samples with 1,2,4-trimethylbenzene concentrations greater
than the SRL, one had no other VOCs detected, two had
detections of toluene at concentrations less than the SRL, and
two had detections of low concentrations of chloroform. This
suggests that the detections of 1,2,4-trimethylbenzene with
concentrations greater than the SRL likely also are the result
of extrinsic contamination. Even though these four detections
would not be censored by application of the SRL, it may
be appropriate to censor the detections on the basis of the
additional information about the samples.

54 VOC Blank Data and Study Reporting Levels, California GAMA PBP, 2004–2010
Bender and others (2011) also reported detection
frequencies of 1,2,4-trimethylbenzene in eld blanks
collected at production wells and at monitoring wells
greater than detection frequencies in groundwater samples
collected at those site types. The detection frequency in
eld blanks collected at production wells was 17 percent,
which is considerably higher than the detection frequency
observed in eld blanks collected for the GAMA-PBP
(g. 3); however, the SRL calculated by Bender and others
(2011) had a much lower concentration than the SRL selected
in this study (g. 14). Bender and others (2011) used the
BD-90/90 method to calculate the SRL of 0.03 µg/L for data
from production wells; the BD-90/90 method applied to the
QCFBs in this study would have yielded no SRL because the
detection frequency of 1,2,4-trimethylbenzene in the QCFBs
was less than 7 percent. Approximately 54 percent of the
9,000 groundwater sites sampled by the NAWQA Program
have data for radon-222 (U.S. Geological Survey, 2012).
Information concerning relations between eld vehicles
used at sites at which samples for radon-222 were collected
and occurrence of 1,2,4-trimethylbenzene in blanks and
groundwater samples is not available.
Chlorinated Organic Solvents
Dichloromethane and 1,1-dichloroethene were
detected in source-solution blanks, and dichloromethane,
tetrachloroethene, and trichloroethene were detected in
QCFBs (table 4; gs. 18–21). The detection frequencies of all
four solvents in groundwater samples were greater than the
detection frequencies in QCFBs (table 4).
Dichloromethane, 1,1-Dichloroethene, and
Trichloroethene
The detection frequencies of dichloromethane and
trichloroethene in the QCFBs were similar to the detection
frequencies in the laboratory instrument blanks (table 4), and
the concentrations detected in the QCFBs were within the
range of concentrations detected in the laboratory instrument
blanks (gs. 18, 21). These similarities suggest that laboratory
sources of these two VOCs are sufcient to account for
the observed detections in the QCFBs. Concentrations of
dichloromethane and trichloroethene in eld blanks affected
by methanol were signicantly greater than concentrations
in eld blanks not affected by methanol (table 6).
Dichloromethane and trichloroethene are both highly soluble
in methanol; thus their presence in eld blanks contaminated
by methanol is not surprising.
Because the detection frequencies of dichloromethane
and trichloroethene in the QCFBs are less than 1 percent and
the detected concentrations are low compared to most of the
concentrations detected in groundwater samples, it is not
necessary to censor the dichloromethane and trichloroethene
data on the basis of detections in blanks. Application of the
BD-95/90 method yields the result of no SRL for either VOC
(table 7) because the detection frequencies of the two VOCs
in the QCFBs are less than 3 percent. For the 167 QCFBs, the
BD-95/90 method selects the 163
rd
-ranked blank as the SRL;
if the detection frequency in the QCFBs is less than 3 percent,
the 163
rd
-ranked blank is a non-detection.
1,1-Dichloroethene was not detected in the QCFBs
(table 4; g. 19). Therefore, no SRL was dened.
Tetrachloroethene
The detection frequency of tetrachloroethene in the
QCFBs was signicantly greater than in the laboratory
instrument blanks (table 4; contingency table test, p <0.001;
g. 20), indicating that there is a source of contamination
beyond processes occurring during laboratory analysis.
However, detection frequencies in the QCFBs and source-
solution blanks were not signicantly different (table 4;
contingency table test, p = 0.16), suggesting that contact with
eld sample-collection equipment is not a major source of
extrinsic contamination. Given the low detection frequency
of tetrachloroethene in the QCFBs (1.8 percent), and the
lack of denitive pattern of detection frequencies pointing
to a likely source of contamination, no censoring of the data
for tetrachloroethene in groundwater samples appears to be
needed. Application of the BD-95/90 method yields the result
of no SRL for tetrachloroethene (table 7).
Other VOCs
The remaining four VOCs detected in blanks belong to
three classes of VOCs and have been lumped together as the
group “other VOCs” for convenience. Trichlorouoromethane
is a refrigerant, bromodichloromethane and chloroform are
trihalomethanes, and carbon disulde is naturally occurring
and is used in industrial organic syntheses. The four VOCs
are divided into three groups for discussion on the basis of
patterns of detection in blanks.
Bromodichloromethane and Trichlorofluoromethane
Bromodichloromethane was detected in one
eld blank contaminated with methanol (g. 22), and
trichlorouoromethane was detected in one QCFB and one
source-solution blank collected at the same site (g. 23). The
detection frequencies in groundwater samples were greater
than in blanks (table 4). Given the low detection frequencies in
QCFBs for bromodichloromethane and trichlorouoromethane
(0 and 0.6 percent, respectively), no SRLs are needed
for bromodichloromethane or trichlorouoromethane.
Application of the BD-95/90 method yields no SRLs for either
VOC (table 7).
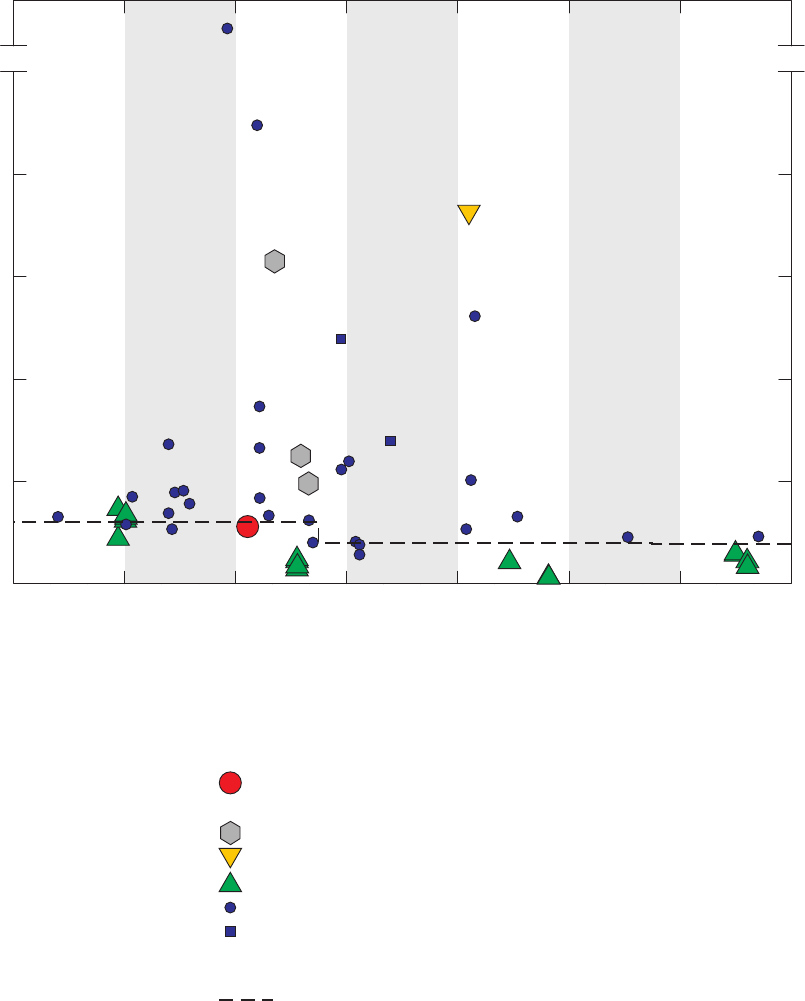
Quality-Control Assessment Results 55
IP031454_Figure 18. ch2cl2
Quality-control field blank (QCFB, n=167)
Monitoring-well field blank (n=18)
Field blank contaminated by methanol (n=26)
Source-solution blank (n=109)
Laboratory instrument blank (n=2,411)
Groundwater—Long or short lines (n=1,859)
Groundwater—Monitoring well (n=167)
EXPLANATION
Sample type (only detections are shown)
Threshold
Long-term method detection level (LT-MDL)
Dichloromethane concentration, in micrograms per liter
Date of sample collection
0
0.05
0.10
0.15
0.20
0.25
1
2
2004 2005 2006 2007 2008 2009 2010
A study reporting level (SRL) was not needed for dichloromethane.
Figure 18. Concentrations of dichloromethane detected in field blanks, source-solution blanks,
laboratory blanks, and groundwater samples, California GAMA Priority Basin Project, May 2004
through September 2010. Non-detections are not shown.
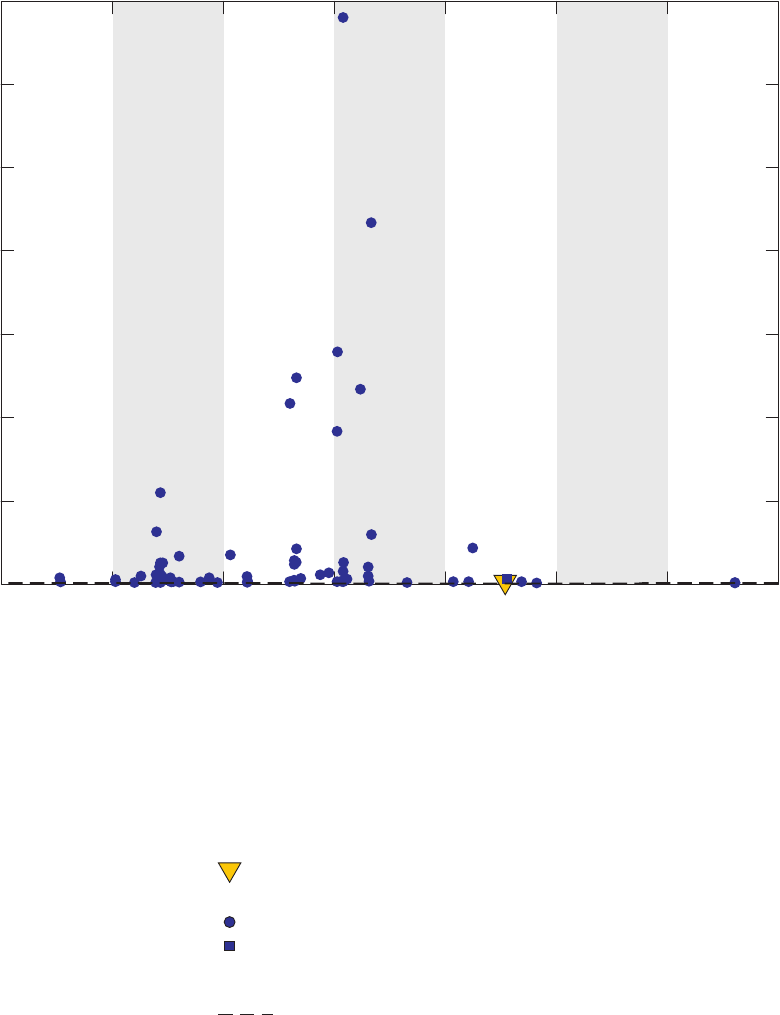
56 VOC Blank Data and Study Reporting Levels, California GAMA PBP, 2004–2010
IP031454_Figure 19. 1,1dce
Quality-control field blank (QCFB, n=167)
Monitoring-well field blank (n=18)
Field blank contaminated by methanol (n=26)
Source-solution blank (n=109)
Laboratory instrument blank (n=2,411)
Groundwater—Long or short lines (n=1,859)
Groundwater—Monitoring well (n=167)
EXPLANATION
Sample type (only detections are shown)
Threshold
Long-term method detection level (LT-MDL)
A study reporting level (SRL) was not needed for 1,1-dichloroethene.
1,1-Dichloroethene concentration, in micrograms per liter
Date of sample collection
0
1
2
3
4
5
6
7
2004 2005 2006 2007 2008 2009 2010
Figure 19. Concentrations of 1,1-dichloroethene detected in field blanks, source-solution blanks,
laboratory blanks, and groundwater samples, California GAMA Priority Basin Project, May 2004 through
September 2010. Non-detections are not shown.
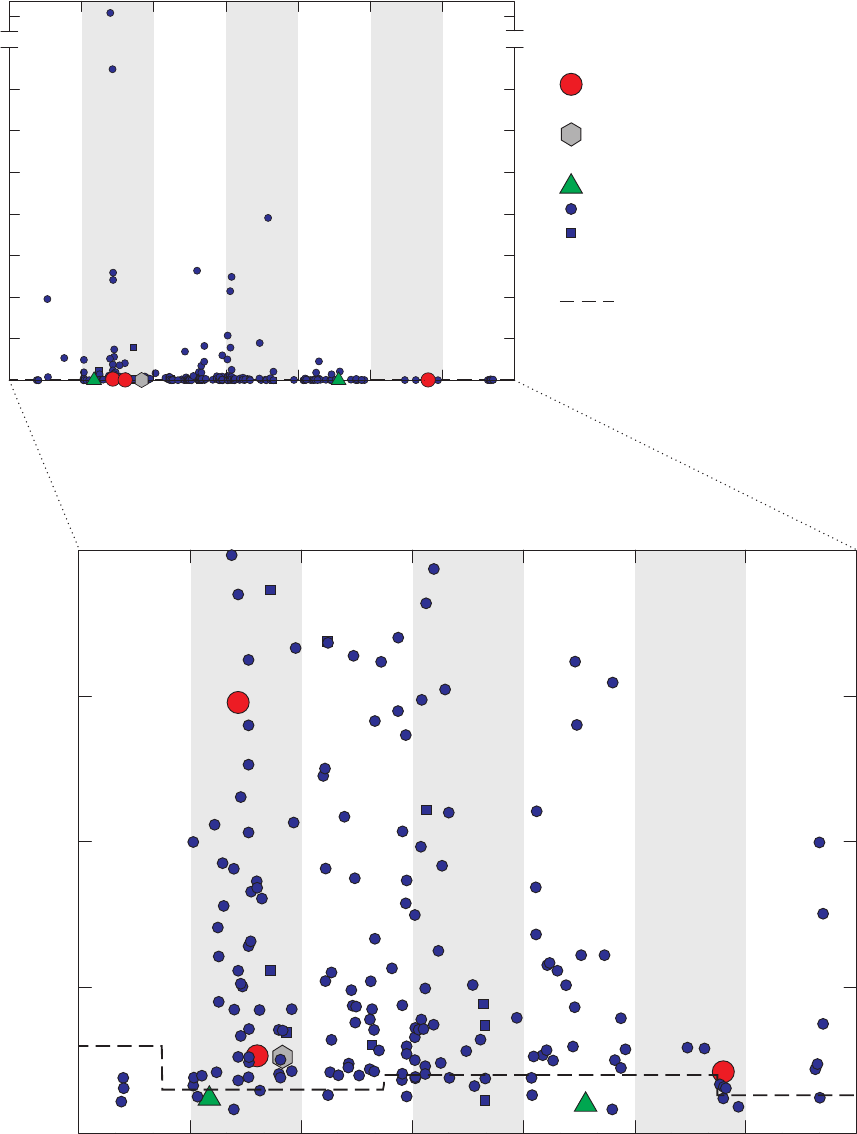
Quality-Control Assessment Results 57
IP031454_Figure 20. pce
Quality-control field blank (QCFB, n=167)
Monitoring-well field blank (n=18)
Field blank contaminated by methanol (n=26)
Source-solution blank (n=109)
Laboratory instrument blank (n=2,411)
Groundwater—Long or short lines (n=1,859)
Groundwater—Monitoring well (n=167)
EXPLANATION
Sample type (only detections are shown)
Threshold
Long-term method detection level (LT-MDL)
A study reporting level (SRL) was not needed
for tetrachloroethene.
0
0.05
0.10
0.15
0.20
Tetrachloroethene concentration, in micrograms per liter
0
5
10
15
20
25
30
35
40
100
200
300
Tetrachloroethene concentration, in micrograms per liter
2004 2005 2006 2007 2008 2009 2010
Date of sample collection
Figure 20. Concentrations of tetrachloroethene detected in field blanks, source-solution blanks,
laboratory blanks, and groundwater samples, California GAMA Priority Basin Project, May 2004
through September 2010. Non-detections are not shown.
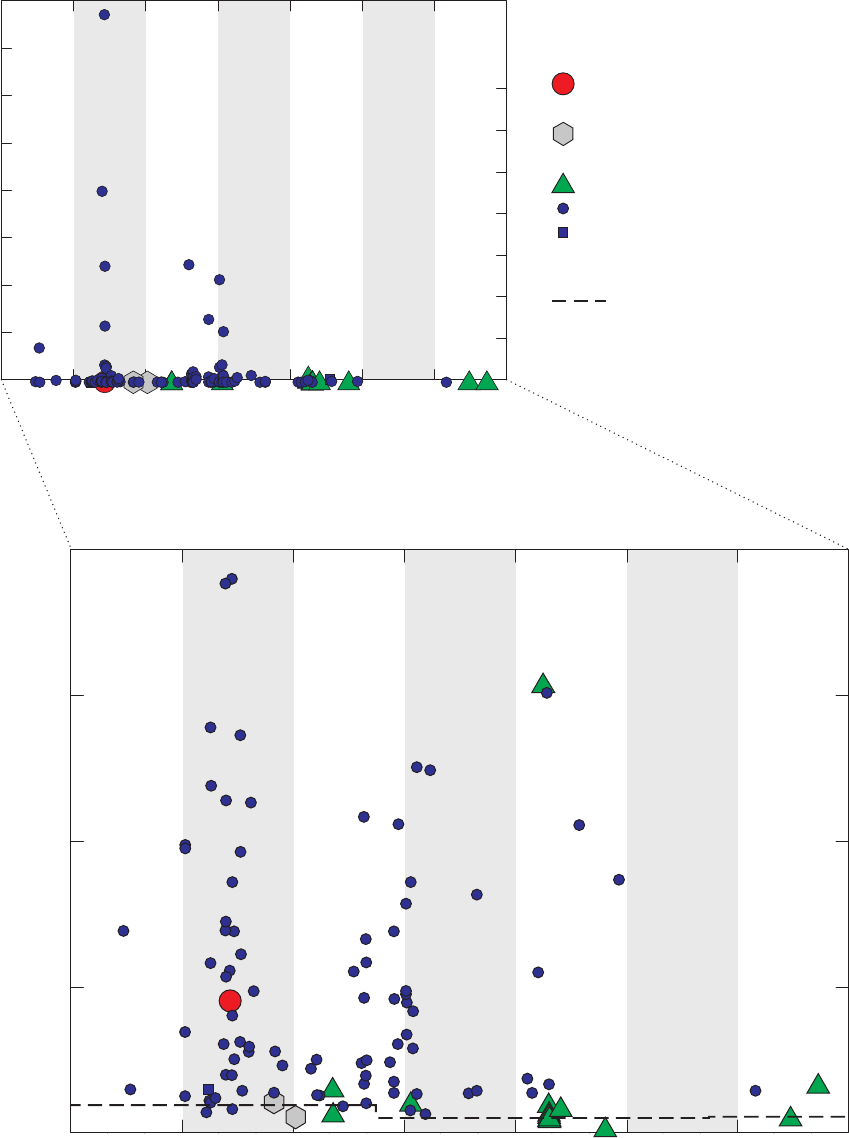
58 VOC Blank Data and Study Reporting Levels, California GAMA PBP, 2004–2010
IP031454_Figure 21. tce
Quality-control field blank (QCFB, n=167)
Monitoring-well field blank (n=18)
Field blank contaminated by methanol (n=26)
Source-solution blank (n=109)
Laboratory instrument blank (n=2,411)
Groundwater—Long or short lines (n=1,859)
Groundwater—Monitoring well (n=167)
EXPLANATION
Sample type (only detections are shown)
Threshold
Long-term method detection level (LT-MDL)
A study reporting level (SRL) was not needed
for trichloroethene.
0
0.10
0.20
0.30
0.40
Trichloroethene concentration, in micrograms per liter
0
10
20
30
40
50
60
70
80
Trichloroethene concentration, in micrograms per liter
2004 2005 2006 2007 2008 2009 2010
Date of sample collection
Figure 21. Concentrations of trichloroethene detected in field blanks, source-solution blanks,
laboratory blanks, and groundwater samples, California GAMA Priority Basin Project, May 2004
through September 2010. Non-detections are not shown.
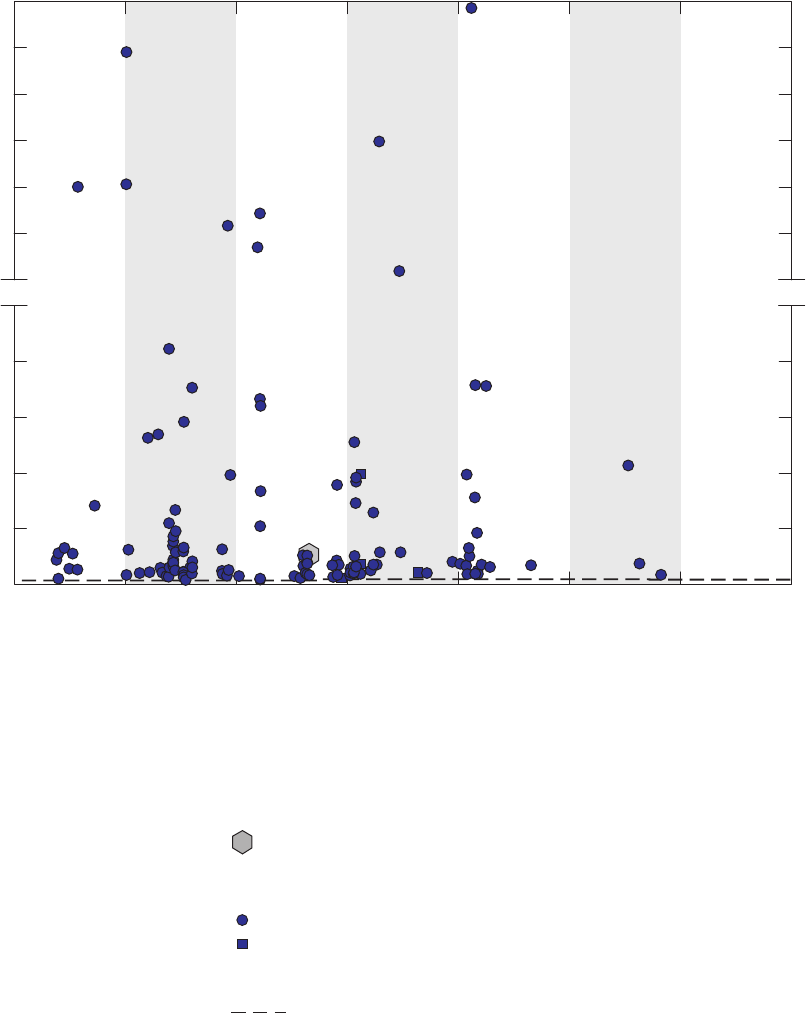
Quality-Control Assessment Results 59
IP031454_Figure 22. bdcm
Quality-control field blank (QCFB, n=167)
Monitoring-well field blank (n=18)
Field blank contaminated by methanol (n=26)
Source-solution blank (n=109)
Laboratory instrument blank (n=2,411)
Groundwater—Long or short lines (n=1,859)
Groundwater—Monitoring well (n=167)
EXPLANATION
Sample type (only detections are shown)
Threshold
Long-term method detection level (LT-MDL)
A study reporting level (SRL) was not needed for bromodichloromethane.
Date of sample collection
0
0.2
0.6
0.4
0.8
2.0
1.0
3.0
5.0
4.0
7.0
6.0
2004 2005 2006 2007 2008 2009 2010
Bromodichloromethane concentration, in micrograms per liter
Figure 22. Concentrations of bromodichloromethane detected in field blanks, source-solution
blanks, laboratory blanks, and groundwater samples, California GAMA Priority Basin Project,
May 2004 through September 2010. Non-detections are not shown.
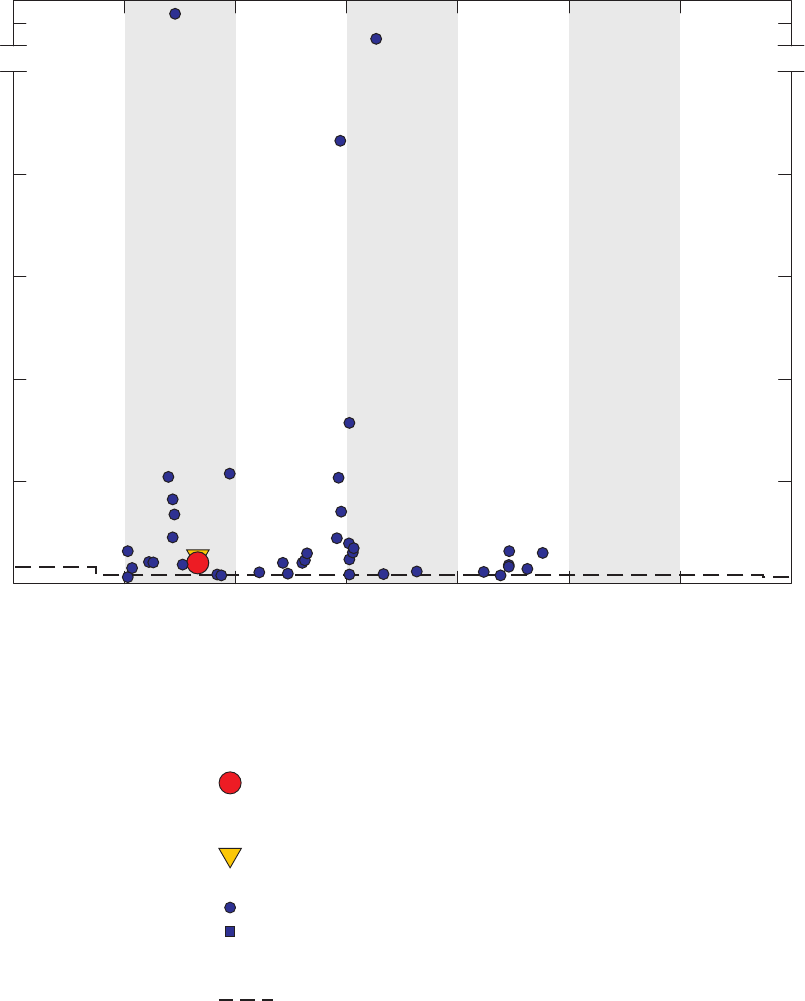
60 VOC Blank Data and Study Reporting Levels, California GAMA PBP, 2004–2010
IP031454_Figure 23. chcl3f
Quality-control field blank (QCFB, n=167)
Monitoring-well field blank (n=18)
Field blank contaminated by methanol (n=26)
Source-solution blank (n=109)
Laboratory instrument blank (n=2,411)
Groundwater—Long or short lines (n=1,859)
Groundwater—Monitoring well (n=167)
EXPLANATION
Sample type (only detections are shown)
Threshold
Long-term method detection level (LT-MDL)
A study reporting level (SRL) was not needed for trichlorofluoromethane.
Trichlorofluoromethane concentration, in micrograms per liter
Date of sample collection
0
0.5
1.0
1.5
2.0
2.5
10
30
20
2004 2005 2006 2007 2008 2009 2010
Figure 23. Concentrations of trichlorofluoromethane detected in field blanks, source-solution blanks,
laboratory blanks, and groundwater samples, California GAMA Priority Basin Project, May 2004
through September 2010. Non-detections are not shown.

Quality-Control Assessment Results 61
Carbon Disulfide
Carbon disulde has anthropogenic and natural
sources. It has been an important industrial chemical since
the 1800s, primarily because of its ability to solubilize fats,
rubber, phosphorous, and other substances (Agency for Toxic
Substances and Disease Registry, 1996). The most important
current industrial uses are in the manufacturing of rayon,
cellophane, and carbon tetrachloride. Carbon disulde was
used as a fumigant, primarily for insect control in stored grain,
until registration was cancelled in 1985 (U.S. Environmental
Protection Agency, 1985). Natural microbial reduction of
sulfate produces carbon disulde in soils, marshes, stratied
lakes, and other anaerobic environments, and carbon disulde
is emitted to the atmosphere from the oceans and from
volcanic eruptions (for example, Chin and Davis, 1993; Devai
and DeLaune, 1995; Agency for Toxic Substances and Disease
Registry, 1996).
Inferred Source of Contamination
Comparisons of detection frequencies and concentrations
of carbon disulde in laboratory instrument blanks, source-
solution blanks, and eld blanks suggest that there are sources
of contamination during analysis of samples in the laboratory
and in sample collection or handling in the eld. The detection
frequency in laboratory instrument blanks (1.6 percent) was
lower than in other types of blanks (table 4); however, the
differences were not statistically signicant (contingency table
tests, p >0.05), and the concentrations detected in all three
types of blanks were similar (g. 24).
There were no signicant differences in detection
frequencies of carbon disulde between source-solution
blanks (3.7 percent), methanol-affected eld blanks
(3.8 percent), eld blanks collected with long sampling lines
(3.2 percent), or eld blanks collected with short sampling
lines (2.9 percent) (tables 4, 6), indicating that contact
with eld sampling equipment likely was not the source of
contamination during sample collection and handling.
On the basis of results from two sets of laboratory
experiments, the likely source of contamination by carbon
disulde is the nitrile gloves used by both laboratory and
eld personnel. Soaking a nitrile glove in 1,000 mL of blank
water for 20 minutes yielded 38 µg/L carbon disulde in
the water (Worthington and others, 2007). In a separate
experiment, soaking four types of nitrile gloves used by eld
or laboratory personnel in blank water for 24 hours leached
800 to 11,600 micrograms per gram (µg/g) of carbon disulde
from the gloves (Lisa Olsen and Donna Rose, U.S. Geological
Survey, written commun., 2011). One glove (approximately
10 grams) soaked in 1,000 mL of water would yield 80 to
1,160 µg/L carbon disulde in the water. The carbon disulde
leached from gloves in these experiments may be sufcient
to account for the low concentrations observed in eld and
source-solution blanks (0.01 µg/L to 0.09 µg/L). If blank
water dripping off a glove contained 100 µg/L of carbon
disulde, then the median detected concentration observed
in eld blanks and source-solution blanks (0.056 µg/L)
would correspond to a mixture of 0.056 percent drip water
and 99.944 percent source-blank water. This is equivalent to
approximately ½ drop of drip water in a 40-mL VOC vial.
SRL for Carbon Disulfide
The occurrence pattern of carbon disulde in
groundwater samples is largely consistent with the pattern
expected for the occurrence of carbon disulde from natural
sources; therefore, selection of an SRL that results in little
censoring of the data may be most appropriate. Carbon
disulde can form naturally under anoxic conditions by
reaction between organic matter and dissolved sulde
(for example, Devai and DeLaune, 1995). The detection
frequency of carbon disulde in groundwater samples
considered anoxic (10 percent) was signicantly greater than
the detection frequency in groundwater samples considered
oxic (1.5 percent) (contingency table test, p <0.001). [For
the purposes of this report, samples are considered anoxic if
dissolved oxygen concentration was less than 1 milligram
per liter (mg/L) or if iron concentration was greater than
100 µg/L or if manganese concentration was greater than
50 µg/L. Anoxic samples were not further classied because
of insufcient data: of the 2,026 groundwater samples, 1,783
had dissolved oxygen data, 1,315 had iron and manganese
data, and 1,243 had data for dissolved oxygen and for iron
and manganese.]
The methods for determining SRLs yield SRLs that result
in censoring of vastly different amounts of the groundwater
data. The BD-90/90 method does not yield an SRL because
the detection frequency of carbon disulde in the QCFBs is
less than 7 percent, and therefore would result in no censoring
of the groundwater data. The other methods yield SRLs
ranging from 0.056 µg/L (BD-95/90) to 0.092 µg/L (maximum
QCFB) (table 7).
Application of the BD-95/90 as the SRL would reduce
the detection frequency to 5.0 percent in anoxic samples
and 0.08 percent in oxic samples. However, many of the
detections censored by application of this SRL appear to
be representative of aquifer conditions. Of the 18 oxic
groundwater samples having carbon disulde less than
0.056 µg/L, 11 samples (61 percent) had detections of
chlorinated solvents and 11 samples were from wells
surrounded by more than 50 percent urban land use, which are
factors that are correlated with industrial sources of carbon
disulde to groundwater. Many detections in groundwater
samples appear to be representative of aquifer conditions;
however, these detections would be censored by the
application of an SRL as high as 0.056 µg/L.
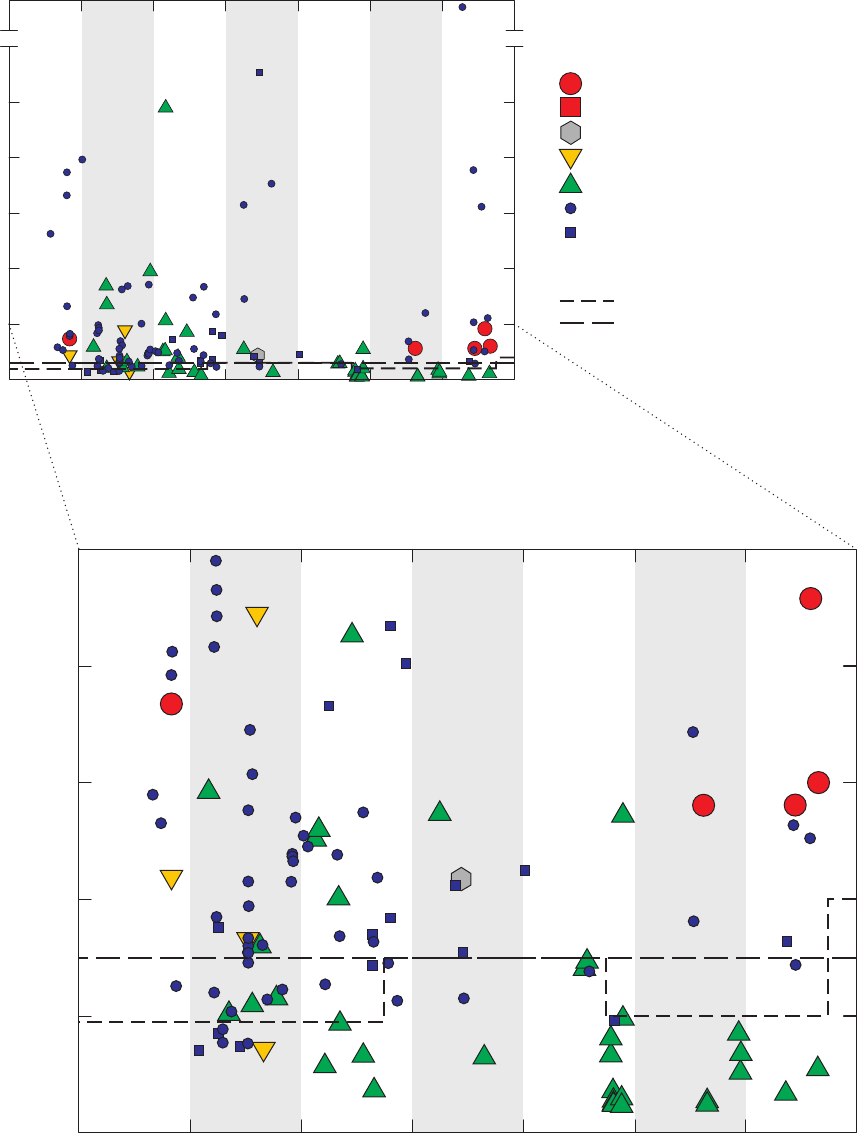
62 VOC Blank Data and Study Reporting Levels, California GAMA PBP, 2004–2010
IP031454_Figure 24. cs2
Quality-control field blank (QCFB, n=167)
Monitoring-well field blank (n=18)
Field blank contaminated by methanol (n=26)
Source-solution blank (n=109)
Laboratory instrument blank (n=2,411)
Groundwater—Long or short lines (n=1,859)
Groundwater—Monitoring well (n=167)
EXPLANATION
Sample type (only detections are shown)
Thresholds
Long-term method detection level (LT-MDL)
Study reporting level (SRL)
0
0.02
0.04
0.08
0.06
0.10
0
0.1
0.2
0.3
0.4
0.5
0.6
0.6
1.2
2004 2005 2006 2007 2008 2009 2010
Date of sample collection
Carbon disulfide concentration, in micrograms per liter
Carbon disulfide concentration, in micrograms per liter
Figure 24. Concentrations of carbon disulfide detected in field blanks, source-solution blanks,
laboratory blanks, and groundwater samples, California GAMA Priority Basin Project, May 2004
through September 2010. Non-detections are not shown.

Quality-Control Assessment Results 63
The results for the laboratory instrument blanks indicate
that an SRL is needed for carbon disulde. The BD-99/90
for carbon disulde in the laboratory instrument blanks was
0.022 µg/L, which is higher than the LT-MDL for some
periods of time between May 2004 and September 2010
(g. 24). A BD-99/90 concentration greater than the LT-MDL
may indicate that the set of samples used to establish the
LT-MDL was not representative of the true variability,
which would result in the LT-MDL having been too low a
concentration. The SRL for carbon disulde (0.03 µg/L) was
dened as the highest concentration LT-MDL used for carbon
disulde between May 2004 and September 2010. Application
of this SRL reduced the overall detection frequency in
groundwater samples from 4.3 percent to 3.3 percent (tables 7,
8). Detection frequencies in anoxic and oxic samples
decreased to 8.4 percent and 0.9 percent, respectively.
The detection frequencies of carbon disulde in eld
blanks (7.2 percent) and groundwater samples (approximately
8 percent) collected at production wells by the NAWQA
Program (Bender and others, 2011) were greater than
the detection frequencies observed in this study (3.2 and
3.8 percent, respectively; table 4; g. 3). The SRL calculated
by Bender and others (2011) had a lower concentration than
the SRL selected in this study (g. 14). Bender and others
(2011) used the BD-90/90 method to calculate the SRL of
0.01 µg/L for data from production wells; the BD-90/90
method applied to the QCFBs in this study would have yielded
no SRL because the detection frequency of carbon disulde in
the QCFBs was less than 7 percent.
Chloroform
The trihalomethane chloroform was the most frequently
detected VOC in groundwater samples (27 percent; table 4).
Chloroform was detected in 1.8 percent of the QCFBs
(table 4), and the patterns of detection of chloroform
in eld blanks, source-solution blanks, and laboratory
instrument blanks are consistent with the primary source
of contamination being the tap water used to rinse eld
equipment. Most tap water has been disinfected with chlorine
solutions during the drinking-water treatment process.
Chlorine solutions can react with organic matter present in
the water, forming trihalomethanes and other halogenated
disinfection byproducts.
Inferred Source of Contamination
The occurrence of chloroform was signicantly higher in
eld blanks contaminated with methanol (15 percent) than in
ones not contaminated with methanol (3.2 percent) (table 6).
Among the eld blanks not contaminated with methanol, the
occurrence of chloroform was signicantly greater in eld
blanks collected at monitoring wells (17 percent) compared to
eld blanks collected with long sampling lines (3.2 percent)
or short sampling lines (1.0 percent). The lines used for the
monitoring-well sampling equipment are longer and more
complex than those used for the long and short sampling lines
sampling congurations. There may be higher probability that
a small amount of tap water would remain in the equipment
even after rinsing with a sufcient amount of blank water to
remove the methanol. The median detected concentration of
chloroform in eld blanks was 0.038 µg/L (g. 25; table A2).
If the concentration of chloroform in tap water were 32 µg/L
[the average concentration of trihalomethanes in Sacramento,
California, tap water in 2010 (City of Sacramento, 2010)],
then the median detected concentrations observed in the eld
blanks would correspond to a mixture of 0.12 percent tap
water and 99.88 percent source-blank water. This is equivalent
to approximately one drop of tap water in a 40-mL VOC vial.
SRL for Chloroform
The methods for determining SRLs yield SRLs that result
in censoring of vastly different amounts of the groundwater
data. The BD-90/90 and BD-95/90 methods do not yield SRLs
and therefore would result in no censoring of the groundwater
data. Use of the maximum LT-MDL method would yield an
SRL of 0.02 µg/L and result in a slight decrease in detection
frequency in groundwater from 27 percent to 23 percent
(table 7). At the other extreme, application of the maximum
concentration detected in the QCFBs (0.127 µg/L) as the
SRL would result in reducing the detection frequency of
chloroform in groundwater to 9.3 percent. The fact that the
detection frequency in the QCFBs (1.8 percent) is so much
lower than the detection frequency in groundwater samples
suggests that contamination has a negligible effect on
chloroform detections; therefore, an SRL that results in little
or no censoring of the groundwater data is warranted. On this
basis, either the BD-95/90 method (no SRL) or maximum
LT-MDL method would yield appropriate values for the SRL
for chloroform (table 7). The BD-95/90 method was selected
for consistency with other VOCs.
The occurrence of chloroform in eld blanks collected
with monitoring-well equipment (17 percent) was signicantly
greater than the occurrence in eld blanks collected with long
(3.2 percent) or short sampling lines (1.0 percent) (table 6),
suggesting that an SRL may be warranted for groundwater
samples collected with monitoring-well equipment. There
were 18 eld blanks collected at monitoring wells that were
not affected by methanol, which is an insufcient number to
dene a BD-95/90. The maximum LT-MDL for chloroform,
0.02 µg/L, was used as the SRL for groundwater samples
collected with monitoring-well equipment. Application of
this SRL decreases the detection frequency of chloroform
in groundwater samples collected with monitoring-well
equipment from 18 percent to 14 percent (table 8). Bender and
others (2011) also reported that the detection frequency in eld
blanks collected at monitoring wells by the NAWQA Program
(28 percent) was signicantly greater than the frequency in
eld blanks collected at production wells (11 percent).
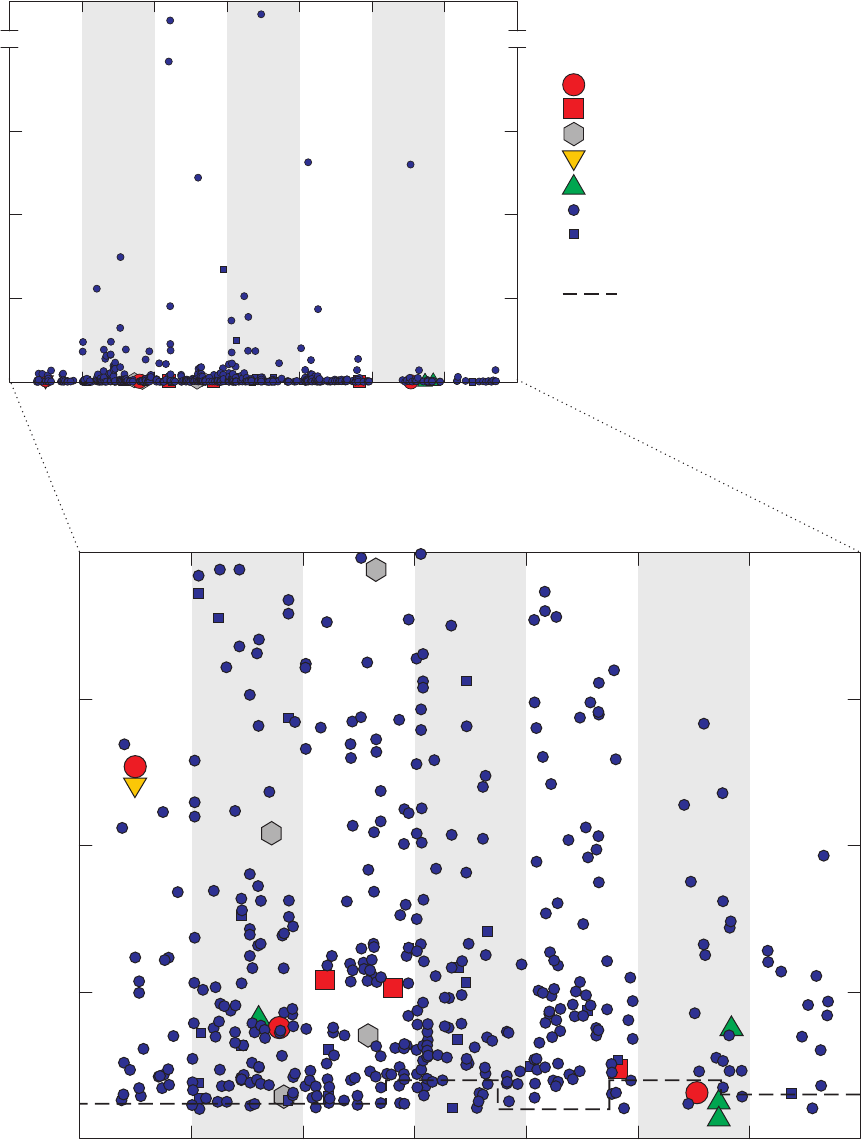
64 VOC Blank Data and Study Reporting Levels, California GAMA PBP, 2004–2010
IP031454_Figure 25. chcl3
Quality-control field blank (QCFB, n=167)
Monitoring-well field blank (n=18)
Field blank contaminated by methanol (n=26)
Source-solution blank (n=109)
Laboratory instrument blank (n=2,411)
Groundwater—Long or short lines (n=1,859)
Groundwater—Monitoring well (n=167)
EXPLANATION
Sample type (only detections are shown)
Threshold
Long-term method detection level (LT-MDL)
0
0.05
0.10
0.15
0.20
0
5
10
15
20
25
50
2004 2005 2006 2007 2008 2009 2010
Date of sample collection
Chloroform concentration, in micrograms per liter
Chloroform concentration, in micrograms per liter
A study reporting level (SRL) was not needed
for chloroform for samples collected with long
or short sampling lines. An SRL equal to the
highest LT-MDL (0.02 microgram per liter) was
needed for samples collected with monitoring-
well equipment.
Figure 25. Concentrations of chloroform detected in field blanks, source-solution blanks,
laboratory blanks, and groundwater samples, California GAMA Priority Basin Project, May 2004
through September 2010. Non-detections are not shown.

Application of SRLs and Maximum LT-MDLS 65
The detection frequency of chloroform in eld blanks
collected at production wells (11 percent) by the NAWQA
Program (Bender and others, 2011) was signicantly greater
than the detection frequency observed in this study (g. 3).
Bender and others (2011) used the BD-90/90 method to
calculate the SRL of 0.02 µg/L for data from production wells;
the BD-90/90 method applied to the QCFBs in this study
would have yielded no SRL because the detection frequency
of chloroform in the QCFBs was only 1.8 percent.
Application of SRLs and
Maximum LT-MDLS
The GAMA-PBP uses 10-percent detection frequency
in a study unit as a threshold for identifying organic
constituents that may be of concern (for example, Landon
and others, 2010). There are three primary issues associated
with comparing detection frequencies at low concentrations:
(1) discerning between VOC detections that are the result
of extrinsic contamination and those that are representative
of aquifer conditions; (2) comparing data collected at
different times if laboratory reporting levels have changed
over time; and (3) dening an acceptable probability of
false-positive detections. The rst issue is addressed by
censoring water-quality data by using SRLs, and the latter
two issues require examining the reporting of detections with
concentrations near the LT-MDLs.
Application of SRLs had a noticeable effect on the
identication of organic constituents that may be of concern.
Initially, 20 VOCs had raw detection frequencies greater
than 10 percent in at least 1 of the 32 study units. Of these
20 VOCs, 5 have SRLs that were determined in this report:
m- and p-xylenes, toluene, 1,2,4-trimethylbenzene, carbon
disulde, and chloroform. Application of the SRLs for
the hydrocarbons resulted in large changes in detection
frequencies: initial raw detection frequencies for m- and
p-xylenes, toluene, and 1,2,4-trimethylbenzene were greater
than or equal to 10 percent in 2, 5, and 11 of the 32 study
units, respectively, and after application of the SRLs, there
were no study units with raw detection frequencies greater
than 10 percent (table 9). Initial raw detection frequency for
carbon disulde was greater than 10 percent in three GAMA
study units; after application of the SRL it was greater than
10 percent in one study unit (study unit S3). Application of
the SRL for chloroform caused no change in the number
of study units with raw detection frequency greater than
10 percent (table 9).
There were a total of 2,580 detections of 60 different
VOCs in the 2,026 groundwater samples. Of those
2,580 detections, 489 were censored by application
of the recommended SRLs (table 8). Toluene and
1,2,4-trimethylbenzene account for 74 percent of the
detections censored. Of the remaining 2,091 detections in
groundwater samples, 231 had concentrations below the
highest LT-MDL used during the study period. Nearly half of
the detections with concentrations below the highest LT-MDL
were of three VOCs: tetrachloroethene (49 of 259 detections
had concentrations below 0.03 µg/L, g. 20), chloroform (35
of 539 detections had concentrations below 0.02 µg/L, g. 25),
and methyl tert-butyl ether (29 of the 113 detections had
concentrations below 0.08 µg/L, not shown). All detections
of four other VOCs had concentrations below the highest
LT-MDL: 4-isopropyltoluene (3), bromomethane (1), methyl
tert-pentyl ether (1), and sec-butylbenzene (1).
Effect of LT-MDL Changes on VOC
Detection Frequencies
After application of SRLs, chloroform and
tetrachloroethene were the two most commonly detected
VOCs in GAMA groundwater samples collected between
May 2004 and September 2010 (table 7). Comparisons were
made between the detection frequencies of chloroform and
tetrachloroethene in the 32 study units sampled during that
period. Therefore, it was important to evaluate whether
changes in LT-MDLs affected reporting of detections with low
concentrations. This was evaluated by comparing data from
periods with different LT-MDLs.
Of the 2,026 groundwater samples, 1,357 were
analyzed during periods when the LT-MDL for chloroform
was 0.01 µg/L, and 699 were analyzed when the LT-MDL
was 0.015 µg/L or 0.02 µg/L. Samples in the two groups
were divided into seven categories by concentration
(non-detections, detections with concentrations less than
0.02 µg/L, and detections with concentrations in ve different
ranges between 0.02 µg/L and 40 µg/L), and the frequencies
in each category were compared (g. 26A). There were no
signicant differences in frequencies in any category between
samples analyzed during periods with the higher and lower
LT-MDLs. During periods when the LT-MDL was 0.01 µg/L,
74 percent of samples had a non-detection of chloroform,
and 3.8 percent had a detection with concentration less than
0.02 µg/L. During periods that the LT-MDL was 0.015 µg/L
or 0.02 µg/L, 71 percent of samples had a non-detection of
chloroform, and 3.6 percent had a detection with concentration
less than 0.02 µg/L. These results suggest that changes in
LT-MDL may not have affected reporting of detections
with concentrations less than the maximum LT-MDL.
Therefore, detection frequencies of chloroform in study units
sampled during periods having different LT-MDLs should
be able to be compared without re-censoring the data to the
maximum LT-MDL.
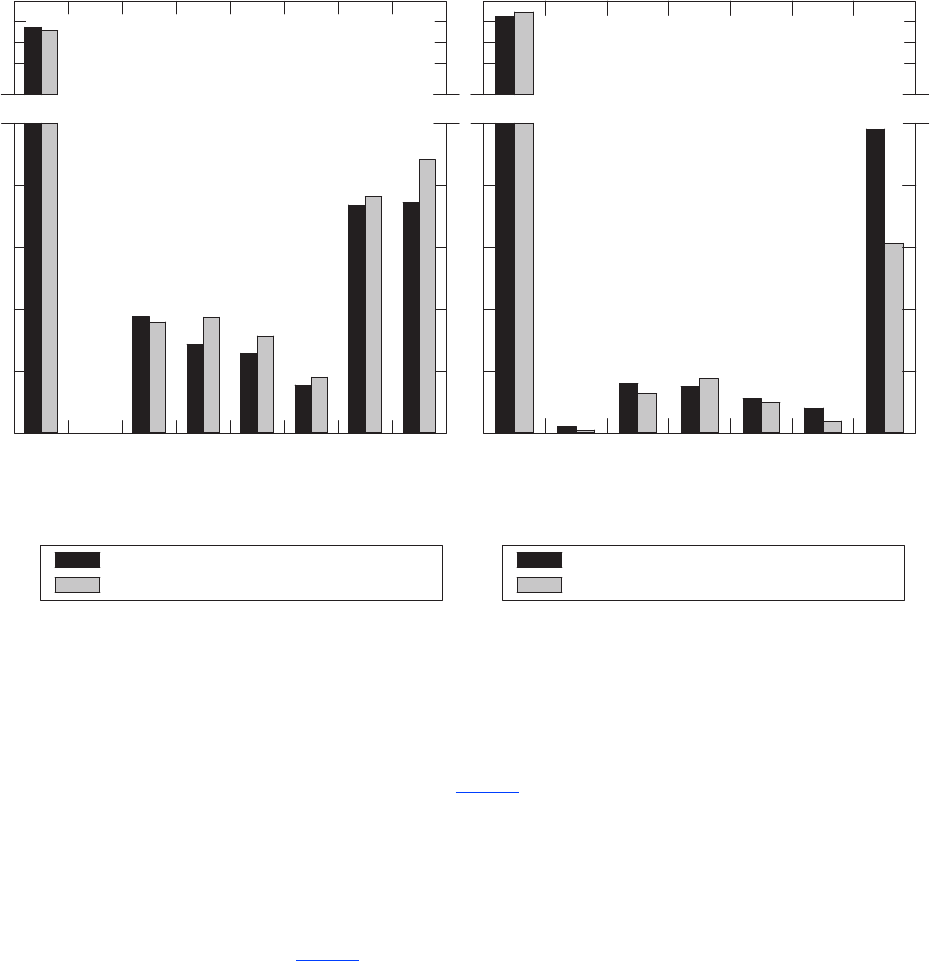
66 VOC Blank Data and Study Reporting Levels, California GAMA PBP, 2004–2010
IP031454_Figure 26. ranges
Percentage of groundwater samples
0
2
4
6
8
20
40
60
80
100
0.02 0.04 0.05 0.15 400.030.01 0.02 0.04 0.05 2200.030.01Not
detected
Not
detected
Chloroform concentration, in micrograms per liter Tetrachloroethene concentration, in micrograms per liter
LT-MDL = 0.01 microgram per liter (n=1,357)
LT-MDL = 0.015 or 0.02 microgram per liter (n=669)
LT-MDL = 0.015 microgram per liter (n=999)
LT-MDL = 0.02 or 0.03 microgram per liter (n=1,027)
A
B
Figure 26. Percentages of groundwater samples in concentration range categories for different long-term method
detection levels (LT-MDLs) for (A) chloroform and (B) tetrachloroethene.
A similar analysis for tetrachloroethene was also
conducted, with statistically signicant differences in two
of the seven categories and no signicant differences in
ve of the categories. Of the 2,026 groundwater samples,
999 were analyzed during periods when the LT-MDL was
0.015 µg/L, and 1,027 were analyzed during periods when
the LT-MDL was 0.02 µg/L or 0.03 µg/L. The percentage of
samples having a non-detection for tetrachloroethene was
signicantly greater during the period with higher LT-MDL
(89 percent) than during the period with lower LT-MDL
(85 percent) (contingency table test, p = 0.003; g. 26B).
However, the types of study units sampled during the two
periods were not the same. Periods with the higher LT-MDLs
had a signicantly higher percentage of samples from Desert
or Mountain study units (28 percent) than did periods with the
lower LT-MDL (20 percent) (contingency table test, p <0.001).
These study units generally have lower population densities
and therefore may have fewer sources of tetrachloroethene
to groundwater. There were no signicant differences in the
percentages of samples having detections with concentrations
in the four categories with concentrations between 0.01 and
0.05 µg/L. The percentage of samples having detections with
concentrations greater than 0.05 µg/L was signicantly lower
during periods with the higher LT-MDL than during periods
with the lower LT-MDL (contingency table test, p = 0.002)
(g. 26B); this difference is consistent with the difference in
the population densities of study units sampled during the
two periods. These observations—no signicant difference
in ve of the seven categories and plausible explanation for
signicant differences in the other two categories—suggest
that the lower detection frequency of tetrachloroethene in
samples analyzed during periods when the LT-MDL was
0.02 µg/L or 0.03 µg/L compared to periods when the
LT-MDL was 0.015 µg/L may reect true differences in the
samples rather than being an artifact of differences in reporting
of detections with low concentrations between the periods.
These results suggest that changes in LT-MDLs
between May 2004 and September 2010 did not signicantly
affect the reporting of detections with low concentrations.
Therefore, differences in detection frequencies of VOCs in
GAMA study units sampled at different times likely reect
differences between the aquifers and are not artifacts of the
LT-MDL changes.

Assessment of Methods Used for Determining Study Reporting Levels 67
Table 10. Probability of false-positive detections
at fractions of the long-term method detection level
(LT-MDL), and numbers of detections with concentrations
below the threshold, California GAMA Priority Basin
Project, May 2004 through September 2010.
[Probability calculated assuming that the standard deviation(s) and
number of samples (n = 24) used in the calculation of the original
LT-MDL remain constant]
Threshold
concentration
Probability of
false-positive
detection
(percent)
Number of detections
with concentrations
less than threshold
LT-MDL 1.0 231
3/4 LT-MDL 3.7 169
1/2 LT-MDL 11 35
1/4 LT-MDL 27 3
1/10 LT-MDL 40 0
LT-MDLs and Probabilities of
False-Positive Detections
Depending on project objectives and how the data will be
used, it may be appropriate to include detections with greater
than a 1-percent probability of being false-positive detections
(concentrations below the LT-MDL) in the dataset. However,
if concentrations below the LT-MDL are included, the level of
condence in these detections should be stated in the report.
The probability (α) of false-positive detection for a detection
with concentration less than the LT-MDL can be estimated
from the equation for the LT-MDL:
23,0.01
(revision of Equation 1) and
LTMDL
LTMDL
tt
s
= =
(5)
23,1
where
is the fraction of the LT-MDL, and
is the probability.
f LTMDL
f LTMDL
tt
s
f
× −α
×
= =
α
(6)
The probabilities were calculated by assuming that the
number of samples used to determine the LT-MDL (n = 24)
and the standard deviation of the values for those samples
(s) remained the same as in the original determination of the
LT-MDL. The probability of false-positive detection increases
from 1 percent at the LT-MDL to 40 percent at one-tenth of the
LT-MDL (table 10).
After application of the SRLs, a total of 231 detections
of VOCs had concentrations less than the maximum LT-MDL.
Most had concentrations between the LT-MDL and one-half
of the LT-MDL. The difference between the minimum and
maximum LT-MDL was less than a factor of 2 for most VOCs
(table 2); therefore, many of these detections may have had
concentrations greater than the LT-MDL in effect at the time
the samples were analyzed. Thirty-ve detections of VOCs
had concentrations below one-half of the LT-MDL (table 10).
The probability of false-positive detection at concentrations
less than one-half of the LT-MDL is greater than 11 percent.
Of these 35 detections, 12 were of tetrachloroethene.
Assessment of Methods Used for
Determining Study Reporting Levels
Three philosophical issues relevant to analysis of
eld-blank data were introduced earlier in this report: use of
statistical or deterministic methods for analysis of eld-blank
data, use of methods based on contamination having a
characteristic pattern of concentrations or a characteristic
detection frequency, and use of different methods for
different VOCs.
In this report we have followed a statistical approach
in that blanks and environmental samples are treated as
independent populations. In other words, a eld blank
collected at a particular site is considered representative of
conditions under which environmental samples are collected
at all sites, and eld blanks are not directly compared to
the “paired” environmental sample collected at the same
site. Even in the evaluations of hypotheses about specic
sources of contamination, a statistical approach was
followed. Contamination, even from known sources, is a
probabilistic process.
68 VOC Blank Data and Study Reporting Levels, California GAMA PBP, 2004–2010
The case of 1,2,4-trimethylbenzene provides an example
of the probabilistic nature of contamination. The detection
frequencies of 1,2,4-trimethylbenzene at concentrations
less than the SRL were 11 percent in eld blanks collected
with long sampling lines and 17 percent in groundwater
samples collected with long sampling lines. The eld blanks
likely were contaminated by a mechanism that also would
affect groundwater samples, namely airborne contact with
1,2,4-trimethylbenzene that had contaminated eld vehicles
from storage of radon sampling kits or materials that had
come in contact with radon sampling vials. However, of the
seven eld blanks collected with long sampling lines that
had detection of 1,2,4-trimethylbenzene, only one was paired
with an environmental sample that also had a detection of
1,2,4-trimethylbenzene. The association between radon
sampling and 1,2,4-trimethylbenzene likely would not have
been apparent from only comparing the paired eld blank and
environmental sample data.
The reason for this apparent discrepancy is that not all of
the eld blanks or environmental samples were contaminated.
There was an 11-percent probability that a eld blank
collected with long sampling lines would be contaminated
with 1,2,4-trimethylbenzene and a 17-percent probability that
an environmental sample collected with long sampling lines
would be contaminated. Thus, if no other factors caused a
greater or lesser tendency toward co-occurrence at the same
site, there was a 1.8-percent probability that a eld blank and
environmental sample collected at the same site would both
be contaminated, which is in agreement with the observed
detection frequency in the data collected with long sampling
lines (1 co-occurrence in 62 instances, which is a frequency of
1.6 percent).
After examining the different methods of determining
SRLs for a range of VOCs, we reached the conclusion that
selection of the most appropriate method for determining
SRLs depended on the hypothesized or inferred mechanisms
and frequencies of contamination of eld blanks and
environmental samples. We found that using different methods
for different VOCs yielded SRLs that resulted in more rational
censoring of groundwater data than attempting to apply a
single approach for all compounds.
For most VOCs having signicantly lower detection
frequencies in eld blanks than in groundwater samples,
the method selected for determining SRLs was the binomial
probability method, using the BD-95/90 concentration as the
SRL. For dichloromethane, tetrachloroethene, trichloroethene,
chloroform, and trichlorouoromethane, application of
this method resulted in no SRL because the BD-95/90 was
a non-detection (detection frequency in QCFBs was less
than 3 percent). Maximum LT-MDLs could also have been
selected as SRLs for these VOCs; however, censoring was
not considered necessary on the basis of detections in blanks
because detection frequencies in the QCFBs (0.6 percent for
dichloromethane, trichloroethene, and trichlorouoromethane;
1.8 percent for chloroform and tetrachloroethene) were so
low. Selection of the maximum QCFBs as SRLs would have
resulted in unwarranted, high degrees of censoring of the
groundwater data. Comparison of detection frequencies in
source-solution blanks, groundwater samples, and different
types of eld blanks did not result in well-dened hypotheses
for the sources and mechanisms of contamination to eld
blanks or groundwater samples.
In contrast, for VOCs having higher detection frequencies
in eld blanks than in groundwater samples, application
of the binomial probability method would have resulted in
insufcient censoring. Ethylbenzene, m- and p-xylenes, and
o-xylene had higher detection frequencies in eld blanks
than in groundwater samples, and the concentrations detected
in blanks were similar to most concentrations detected in
groundwater samples. Hydrocarbon ratios indicated that
the likely source of contamination to eld blanks and most
groundwater samples was fuel exhaust or fumes. Comparison
among detection frequencies in different types of eld blanks
suggested that the primary mechanism of contamination was
contact with eld sampling equipment, and differences in the
amount of rinsing of eld equipment plausibly accounted for
the higher detection frequencies in eld blanks compared to
groundwater samples. The hydrocarbon ratios also indicated
that the ethylbenzene and o-xylene in the groundwater samples
with the highest concentrations (which were much higher
than all of the concentrations in blanks) were likely from a
different source. Selection of the maximum concentrations
detected in the QCFBs as SRLs resulted in censoring of nearly
all detections in groundwater. If the BD-95/90 values had been
selected as the SRLs, many detections in groundwater with
hydrocarbon ratios and concentrations indistinguishable from
those in eld blanks would have been retained.
For VOCs with similar detection frequencies in eld
blanks and groundwater, the choice of the most appropriate
method for determining an SRL was more complicated. In
the case of 1,2,4-trimethylbenzene, the highest concentration
detected in the QCFBs was deemed the most appropriate
because it resulted in censoring of the most data; nearly all
occurrences of 1,2,4-trimethylbenzene in groundwater samples
could be accounted for by the same source and mechanism as
were inferred for contamination of the eld blanks. The likely
source of the 1,2,4-trimethylbenzene was the scintillation
uid in the vials used for collection of radon samples, and
the likely mechanism was pervasive contamination of eld
vehicles due to presence of materials (kits, used gloves,
etc.) associated with sampling for radon. Selection of the
SRL from the binomial probability method (BD-95/90 or
BD-90/90) would have resulted in insufcient censoring of the
groundwater data, although for different reasons than for the
other hydrocarbons.

Summary and Conclusions 69
In the case of carbon disulde, the BD-95/90 and
maximum concentration in the QCFBs methods both would
have resulted in over-censoring of the groundwater data. The
inferred source and mechanism of contamination—contact
with the gloves worn by eld and laboratory personnel—does
affect eld blanks and groundwater samples. However, the
occurrence pattern of carbon disulde in groundwater samples
was broadly consistent with geochemical predictions (higher
frequency of detection in anoxic groundwater), suggesting that
extrinsic contamination was not the dominant source of carbon
disulde to the samples; therefore, the data were largely
representative of aquifer conditions. The highest LT-MDL was
selected as the SRL because it resulted in censoring of fewer
data than the BD-95/90 SRL would have caused.
Summary and Conclusions
Volatile organic compounds (VOCs) were analyzed
in quality-control samples collected for the California
Groundwater Ambient Monitoring and Assessment (GAMA)
Program Priority Basin Project (PBP). The project is being
conducted by the U.S. Geological Survey (USGS) in
cooperation with the California State Water Resources Control
Board to assess and monitor the quality of groundwater
resources used for drinking-water supply and to improve
public knowledge of groundwater quality in California.
From May 2004 through September 2010, a total of 2,026
groundwater samples, 211 eld blanks, and 109 source-
solution blanks were collected and analyzed for concentrations
of 85 VOCs. Results from these eld and source-solution
blanks, and from 2,411 laboratory instrument blanks analyzed
during the same time period were used to assess the quality of
data for the 2,026 groundwater samples.
Of the 85 VOCs analyzed, 18 were detected in eld
blanks or source-solution blanks, and 67 were not detected.
The VOCs detected in blanks can be divided into three groups:
Hydrocarbons Solvents Other VOCs
benzene acetone bromodichloromethane
ethylbenzene 2-butanone carbon disulde
styrene 1,1-dichloroethene chloroform
toluene dichloromethane trichlorouoromethane
1,2,4-trimethylbenzene tetrachloroethene
m- and p-xylenes tetrahydrofuran
o-xylene trichloroethene
The objective of the evaluation of the VOC-blank data
was to determine if study reporting levels (SRLs) were needed
for any of the VOCs detected in blanks to ensure the quality
of the data from groundwater samples. An SRL is equivalent
to a raised reporting limit that is used in place of the reporting
limit used by the analyzing laboratory [laboratory reporting
level (LRL) or long-term method detection level (LT-MDL)]
to reduce the probability of reporting false positives.
Evaluation of VOC-blank data was done in three stages:
(1) identication of a set of representative quality-control
eld blanks (QCFBs) to be used for calculation of SRLs
and identication of VOCs amenable to the SRL approach,
(2) evaluation of potential sources of contamination to blanks
and groundwater samples by VOCs detected in eld blanks,
and (3) selection of appropriate SRLs from among the SRLs
dened using different approaches for determining SRLs for
VOCs detected in eld blanks and application of those SRLs
to the groundwater data.
An important conclusion from this study is that to
ensure the quality of the data from groundwater samples, it
was necessary to apply different approaches of determining
SRLs from eld-blank data to different VOCs, rather than
use the same approach for all VOCs. There are multiple
potential sources and mechanisms of extrinsic contamination
of blanks and groundwater samples; these mechanisms do not
have equal probabilities of affecting blanks and groundwater
samples. The differences in detection frequencies and
concentrations among different types of blanks (laboratory
instrument blanks, source-solution blanks, and eld
blanks collected with three different sampling equipment
congurations) and groundwater samples were used to infer
the sources and mechanisms of contamination for each
VOC detection in eld blanks. Other chemical data for the
groundwater samples (oxidation-reduction state, co-occurrence
of VOCs, groundwater age) and ancillary information
about the well sites (land use, presence of known sources of
contamination) were used to evaluate whether the patterns of
detections of VOCs in groundwater samples, before and after
application of potential SRLs, were plausible.
The SRL approach assumes that extrinsic contamination
adds relatively low concentrations of VOCs to samples,
and that there is a threshold concentration above which
detections in groundwater samples have an acceptably
small probability of being false positives. Contamination
with acetone, 2-butanone, and tetrahydrofuran did not
follow this pattern; therefore, these three VOCs were not
amenable to the SRL approach. An inadvertent eld test
indicated that contamination with methanol can introduce
2-butanone, acetone, and tetrahydrofuran into eld blanks,
and observations from eld sites indicated that the presence
of fresh PVC-cement can also contaminate groundwater
samples and eld blanks with these VOCs. In both cases, there
was no threshold concentration above which detections in
groundwater samples could be assumed to represent aquifer
conditions rather than extrinsic contamination. Reported
detections of 2-butanone, acetone, and tetrahydrofuran
in groundwater samples were coded as “reviewed and
rejected” in NWIS, which is interpreted to be the same
as if the groundwater sample was not analyzed for those
VOCs. Detection frequencies for acetone, 2-butanone, and
tetrahydrofuran in groundwater samples therefore cannot
be dened.
70 VOC Blank Data and Study Reporting Levels, California GAMA PBP, 2004–2010
Of the 211 eld blanks, 167 constituted the set of
QCFBs that was used to assess the quality of the groundwater
data for VOCs. The 26 eld blanks containing evidence of
contamination with methanol [presence of acetone and (or)
2-butanone] were not included in the QCFBs. Contamination
with methanol primarily was related to steps in the sample
collection process at which there are small differences in
sample collection procedures between eld blanks and
groundwater samples; thus, eld blanks contaminated with
methanol were not considered representative of conditions
under which groundwater samples were collected. The 18 eld
blanks collected with monitoring-well equipment and not
contaminated with methanol also were not included in the
QCFBs because they had signicantly higher concentrations
and detection frequencies of chloroform than eld blanks
collected with other sampling equipment congurations. There
were no signicant differences between eld blanks collected
with long sampling lines (62 eld blanks) and short sampling
lines (105 eld blanks); these were grouped together as the
QCFBs. Because the small number of eld blanks collected
with monitoring-well equipment precluded robust calculation
of separate SRLs for groundwater samples collected with
monitoring-well equipment, the SRLs determined from the
QCFBs were applied to groundwater samples collected with
all three sampling equipment congurations.
Four potential SRL values were dened for each VOC
using three approaches: two potential SRL values were dened
using a binomial probability method based on one-sided,
nonparametric upper condence limits, one was dened as
equal to the maximum concentration detected in the eld
blanks, and one was dened as the maximum LT-MDL used
during the period samples were collected for the project.
These four SRL values were compared, and one value was
selected for each VOC as the SRL for use with GAMA
groundwater data.
Ethylbenzene, m- and p-xylenes, and o-xylene had
higher detection frequencies in QCFBs than in groundwater.
All blanks and most groundwater samples had the same
ratios of ethylbenzene and o-xylene to m- and p-xylenes,
and concentrations in groundwater samples and eld blanks
were similar, implying a common source of contamination.
Hydrocarbon ratios and comparisons between detection
frequencies in different types of blanks suggest that the likely
source is fuel or exhaust components sorbed onto sampling
lines. The highest concentrations detected in the QCFBs
[ethylbenzene, 0.06 microgram per liter (µg/L); m- and
p-xylenes, 0.33 µg/L; and o-xylene, 0.12 µg/L] were selected
as the SRLs because they resulted in the most censoring of
groundwater data. Application of these SRLs resulted in
censoring of 14 of 18 ethylbenzene detections, all 49 m- and
p-xylenes detections, and 13 of 14 o-xylene detections in the
2,026 groundwater samples.
Toluene was the most frequently detected VOC in
QCFBs, source-solution blanks, and laboratory instrument
blanks, and detection frequencies in blanks were greater
than in groundwater. Comparisons between detection
frequencies in different types of blanks suggest two sources
of toluene contamination: the source of contamination with
low concentrations may be the vials used for VOC samples
and (or) contamination of the source-blank water during
transit to eld sites or storage in bottles, and the source
of contamination with high concentrations may be fuel
or exhaust components sorbed onto sampling lines. The
highest concentration detected in the QCFBs, 0.69 µg/L,
was selected as the SRL because it resulted in the most
censoring of groundwater data. Application of this SRL
resulted in censoring of 152 of the 156 detections of toluene in
groundwater samples.
1,2,4-Trimethylbenzene detections in blanks and
groundwater samples were not correlated with detections
of other hydrocarbons. Three of the ve eld mobile labs
used during the GAMA-PBP were used at sites where
samples for radon were collected (approximately 30 percent
of the 2,026 groundwater sampling sites), and detections
of 1,2,4-trimethylbenzene in groundwater and blanks were
conned to samples collected at sites visited by those mobile
labs. Radon samples are collected in vials containing a
scintillation cocktail composed of 1,2,4-trimethylbenzene
and mineral oil. Although radon samples are collected at the
wellhead, not in the mobile lab, the mobile labs apparently
are subject to contamination from 1,2,4-trimethylbenzene,
likely from storage of the kits used for radon sample
collection and (or) disposal of gloves and other materials
that may have come in contact with the radon sample
vials. The highest concentration detected in the QCFBs,
0.56 µg/L, was selected as the SRL because it resulted in
the most censoring of groundwater data. Application of this
SRL resulted in censoring of 212 of the 216 detections of
1,2,4-trimethylbenzene in groundwater samples.
Carbon disulde was detected at similar concentrations
and detection frequencies in QCFBs and source-solution
blanks and at slightly lower frequency in laboratory instrument
blanks. Most carbon disulde detections in groundwater
samples occurred in anoxic samples, which is consistent with
predicted occurrence of carbon disulde formed naturally
under sulfate-reducing conditions. The most probable source
of carbon disulde contamination is the gloves worn by eld
and laboratory personnel. The recommended SRL for carbon
disulde is the maximum LT-MDL, 0.03 µg/L. Application
of this SRL resulted in censoring of 20 of the 87 detections of
carbon disulde.
Chloroform was the most frequently detected VOC in
groundwater samples. The detection frequency of chloroform
in eld blanks collected at monitoring wells was signicantly
greater than in QCFBs; chloroform was the only VOC for
which different SRLs were recommended for groundwater
samples collected at production wells and at monitoring wells.
The SRL recommended for groundwater samples collected
at monitoring wells was the highest LT-MDL, 0.02 µg/L.
Application of this SRL resulted in censoring of 6 of the
30 detections of chloroform in samples collected at monitoring
wells. No SRL was recommended for groundwater samples
collected with long or short sampling lines.

References Cited 71
No SRLs were established for the remaining eight VOCs
detected in eld blanks. Benzene, styrene, 1,1-dichloroethene,
and bromodichloromethane were not detected in QCFBs,
and the detection frequencies of dichloromethane,
tetrachloroethene, trichloroethene, and trichlorouoromethane
in QCFBs were less than 3 percent; thus the BD-95/90s of the
QCFBs were non-detections.
The 2,026 groundwater samples had a total of
2,580 detections of 60 different VOCs. Of those 2,580
detections, 489 were censored by application of the SRLs
determined in this report. Of the remaining detections, 231
had concentrations below the highest LT-MDL used during
the study period. LT-MDLs changed by less than a factor of 2
between May 2004 and September 2010 for most VOCs, and
the changes did not signicantly alter reporting of detections
with low concentrations. Therefore, censoring at the highest
LT-MDLs for VOCs that do not have SRLs does not appear
to be necessary to ensure comparability between study units
sampled at different times during that period.
Acknowledgments
We thank the members of the U.S. Geological Survey
(USGS) Groundwater Ambient Monitoring Assessment
(GAMA) Program Team who did all the eld work, tracked
all of the data, and wrote the data-series reports for individual
study units. We especially thank the many well owners and
water purveyors who allowed the USGS to collect samples
from their wells. The GAMA Priority Basin Project is funded
by State of California bonds authorized by Proposition 50
and administered by the California State Water Resources
Control Board.
References Cited
Agency for Toxic Substances and Disease Registry, 1996,
Toxicological prole for carbon disulde: U.S. Government
Printing Ofce 1996-739-324, 219 p., accessed August 3,
2012, at http://www.atsdr.cdc.gov/ToxProles/tp82.pdf.
Agresti, A., and Coull, B.A., 1998, Approximate is better than
“exact” for interval estimation of binomial proportions: The
American Statistician, v. 52, no. 2, p. 119–126.
Belitz, Kenneth, Dubrovsky, N.M., Burow, K.R., Jurgens,
B.C., and Johnson, T., 2003, Framework for a ground-water
quality monitoring and assessment program for California:
U.S. Geological Survey Water-Resources Investigations
Report 03-4166, 78 p. (Also available at http://pubs.usgs.
gov/wri/wri034166/.)
Belitz, Kenneth, Jurgens, B.C., Landon, M.K., Fram,
M.S., and Johnson, T., 2010, Estimation of aquifer scale
proportion using equal area grids—Assessment of regional
scale groundwater quality: Water Resources Research, v. 46,
W11550, doi:10.1029/2010WR009321.
Bender, D.A., Zogorski, J.S., Mueller, D.K., Rose, D.L.,
Martin, J.D., and Brenner, C.K., 2011, Quality of volatile
organic compound data from groundwater and surface
water for the National Water-Quality Assessment Program,
October 1996–December 2008: U.S. Geological Survey
Scientic Investigations Report 2011-5204, 128 p. (Also
available at http://pubs.usgs.gov/sir/2011/5204/.)
Brown, L.D., Cai, T.T., and DasGupta, A., 2001, Interval
estimation for a binomial proportion: Statistical Science,
v. 16, v. 2, p. 101–133.
Burton, C.A., and Belitz, Kenneth, 2008, Ground-water
quality data in the southeast San Joaquin Valley, 2005–
2006—Results from the California GAMA Program: U.S.
Geological Survey Data Series Report 351, 103 p. (Also
available at http://pubs.usgs.gov/ds/351/.)
California Department of Public Health, 2006, California
Code of Regulation. Title 22. Division 4. Environmental
Health. Chapter 15. Domestic water quality and monitoring
regulations. Article 16. Secondary water standards,
accessed January 2011 at http://www.cdph.ca.gov/certlic/
drinkingwater/Documents/Recentlyadoptedregulations/R-
21-03-nalregtext.pdf.
California Department of Public Health, 2008, Maximum
contaminant levels and regulatory dates for drinking
water, U.S. EPA VS California, November 2008,
accessed January 2011 at http://www.cdph.ca.gov/
certlic/drinkingwater/Documents/DWdocuments/
EPAandCDPH-11-28-2008.pdf.
California Department of Public Health, 2010, Drinking water
notication levels and response levels—An overview:
California Department of Public Health Drinking Water
Program, accessed January 2011 at http://www.cdph.
ca.gov/certlic/drinkingwater/Documents/Noticationlevels/
noticationlevels.pdf.
California Department of Public Health, 2011, California
Code of Regulations. Title 22. Division 4. Environmental
Health. Chapter 15. Domestic water quality and
monitoring regulations. Article 5.5. Primary Standards—
Organic Chemicals. Section §64445.1. Monitoring and
Compliance—Organic Chemicals.
California State Water Resources Control Board, 2003, A
comprehensive groundwater quality monitoring program for
California: Assembly Bill 99 Report to the Governor and
Legislature, March 2003, 100 p., available at http://www.
waterboards.ca.gov/water_issues/programs/gama/docs/
nal_ab_599_rpt_to_legis_7_31_03.pdf.

72 VOC Blank Data and Study Reporting Levels, California GAMA PBP, 2004–2010
Childress, C.J.O., Foreman, W.T., Connor, B.F., and Maloney,
T.J., 1999, New reporting procedures based on long-term
method detection levels and some considerations for
interpretations of water-quality data provided by the U.S.
Geological Survey National Water Quality Laboratory: U.S.
Geological Survey Open-File Report 99-193, 19 p. (Also
available at http://water.usgs.gov/owq/OFR_99-193/index.
html.)
Chin, M., and Davis, D.D., 1993, Global sources and
sinks of OCS and CS
2
and their distributions: Global
Biogeochemical Cycles, v. 7, p. 321–337.
City of Sacramento, 2010, 2010 Water quality report—A
consumer condence report for the citizens of Sacramento:
City of Sacramento Department of Utilities, accessed
December 2, 2011, at http://www.cityofsacramento.org/
utilities/water/documents/CCR_LINO_web.pdf.
Connor, B.F., Rose, D.L., Noriega, M.C., Murtaugh, L.K.,
and Abney, S.R., 1998, Methods of analysis by the U.S.
Geological Survey National Water Quality Laboratory—
Determination of 86 volatile organic compounds in water
by gas chromatography/mass spectrometry, including
detections less than reporting limits: U.S. Geological
Survey Open-File Report 97-829, 78 p. (Also available at
http://nwql.usgs.gov/Public/pubs/OFR97-829/OFR97-829.
html.)
Daisey, J.M., Hodgson, A.T., Fisk, W.J., Mendell, M.J.,
and Ten Brinke, J., 1994, Volatile organic compounds in
twelve California ofce buildings—Classes, concentrations
and sources: Atmospheric Environment, v. 28, no. 22,
p. 3557–3562.
Devai, I., and DeLaune, R.D., 1995, Formation of volatile
sulfur compounds in salt marsh sediment as inuenced by
soil redox condition: Organic Geochemistry, v. 23, no. 4,
p. 283–287.
Ferrari, M.J., Fram, M.S., and Belitz, Kenneth, 2008, Ground-
water quality in the Central Sierra study unit, California,
2006—Results from the California GAMA Program: U.S.
Geological Survey Data Series 335, 60 p. (Also available at
http://pubs.usgs.gov/ds/335/.)
Fram, M.S., Munday, C.M., and Belitz, Kenneth, 2009,
Groundwater quality data for the Tahoe-Martis study unit,
2007—Results from the California GAMA Program: U.S.
Geological Survey Data Series 432, 88 p. (Also available at
http://pubs.usgs.gov/ds/432/.)
Hahn, G.J., and Meeker, W.Q., 1991, Statistical intervals—A
guide to practitioners: New York, John Wiley and Sons,
392 p.
Helsel, D.R., 2005, Nondetects and data analysis—Statistics
for censored environmental data: New York, John Wiley
and Sons, 268 p.
Helsel, D.R., and Hirsch, R.M., 2002, Statistical methods in
water resources: U.S. Geological Survey Techniques of
Water-Resources Investigations, book 4, chap. A3, 510 p.
(Also available at http://pubs.usgs.gov/twri/twri4a3/.)
Horton, T.R., 1983, Methods and results of EPA’s study
of radon in drinking water: U.S. Environmental
Protection Agency Ofce of Radiation Programs, Eastern
Environmental Radiation Facility, Montomery, Ala., EPA-
520/5-83-027, 25 p.
J&W Scientic, 1998, Catalog, technical reference,
and cookbook: Folsom, California, J&W Scientic
Incorporated, 420 p.
Landon, M.K., and Belitz, Kenneth, 2012, Geogenic
sources of benzene in aquifers used for public supply,
California: Environmental Science and Technology, v. 46,
p. 8689–8697.
Landon, M.K., Belitz, Kenneth, Jurgens, B.C., Kulongoski,
J.T., and Johnson, T.D., 2010, Status and understanding of
groundwater quality in the Central–Eastside San Joaquin
Basin, 2006—California GAMA Priority Basin Project:
U.S. Geological Survey Scientic Investigations Report
2009-5266, 97 p. (Also available at http://pubs.usgs.gov/
sir/2009/5266/.)
Maloney, T.J., ed., 2005, Quality management system, U.S.
Geological Survey National Water Quality Laboratory: U.S.
Geological Survey Open-File Report 2005-1263. (Also
available at http://pubs.usgs.gov/of/2005/1263/.)
Martin, J.D., Gilliom, R.J., and Schertz, T.L., 1999, Summary
and evaluation of pesticides in eld blanks collected for
the National Water-Quality Assessment Program, 1992–95:
U.S. Geological Survey Open-File Report 98-412, 102 p.
(Also available at http://pubs.usgs.gov/of/1998/0412/report.
pdf.)
Monod, Anne, Sive, B.C., Avino, Pasquale, Chen, Tai, Blake,
D.R., and Rowland, F.S., 2001, Monoaromatic compounds
in ambient air of various cities—A focus on correlations
between the xylenes and ethylbenzene: Atmospheric
Environment, v. 35, p. 135–149.
Moran, M.J., Zogorski, J.S., and Rowe, B.L., 2006, Approach
to an assessment of volatile organic compounds in the
nation’s ground water and drinking-water supply wells:
U.S. Geological Survey Open-File Report 2005-1452, 36 p.
(Also available at http://pubs.usgs.gov/of/2005/1452/.)

References Cited 73
Nowell, L.H., Ludtke, A.S., Mueller, D.K., and Scott, J.C.,
2011, Organic contaminants, trace and major elements, and
nutrients in water and sediment sampled in response to the
Deepwater Horizon oil spill: U.S. Geological Survey Open-
File Report 2011-1271, 126 p. (Also available at http://pubs.
usgs.gov/of/2011/1271/.)
Olsen, L.D., Fram, M.S., and Belitz, Kenneth, 2010,
Review of trace-element eld-blank data collected for
the California Groundwater Ambient Monitoring and
Assessment (GAMA) Program, May 2004–January 2008:
U.S. Geological Survey Scientic Investigations Report
2009-5220, 47 p. (Also available at http://pubs.usgs.gov/
sir/2009/5220/.)
Pirkey, K.D., and Glodt, S.R., 1998, Quality control at the
U.S. Geological Survey National Water Quality Laboratory:
U.S. Geological Survey Fact Sheet 026-98, 4 p.
Thiros, S.A., Bender, D.A., Mueller, D.K., Rose, D.L., Olsen,
L.D., Martin, J.D., Bernard, B., and Zogorski, J.S., 2011,
Design and evaluation of a eld study on the contamination
of selected volatile organic compounds and wastewater-
indicator compounds in blanks and groundwater samples:
U.S. Geological Survey Scientic Investigations Report
2011-5027, 85 p. (Also available at http://pubs.usgs.gov/
sir/2011/5027/.)
Toccalino, P.L., Norman, J.E., and Hitt, K.J., 2010, Quality
of source water from public-supply wells in the United
States, 1993–2007: U.S. Geological Survey Scientic
Investigations Report 2010-5024, 126 p. (Also available at
http://pubs.usgs.gov/sir/2010/5024/.)
U.S. Environmental Protection Agency, 1985, Intent to cancel
registrations of pesticide products containing carbon
tetrachloride, carbon disulde, and ethylene dichloride
(effective November 22, 1985): Federal Register, v. 50,
p. 42997–42999.
U.S. Environmental Protection Agency, 1997, Denition and
procedure for the determination of the method detection
limit—Revision 1.11: U.S. Code of Federal Regulations,
Title 40, chap. 1, subchap. D, part 136, appendix B.
U.S. Environmental Protection Agency, 2009a, 2009 Edition
of the drinking water standards and health advisories,
accessed January 2011 at http://water.epa.gov/action/
advisories/drinking/upload/dwstandards2009.pdf.
U.S. Environmental Protection Agency, 2009b, National
primary drinking water regulations, accessed January 2011
at http://water.epa.gov/drink/contaminants/upload/mcl-2.
pdf.
U.S. Geological Survey, 2012, NAWQA Data Warehouse
Home, Groundwater, accessed August 3, 2012, at http://
infotrek.er.usgs.gov/nawqa_queries/jsp/gwmaster.jsp.
U.S. Geological Survey, variously dated, National eld manual
for the collection of water-quality data: U.S. Geological
Survey Techniques of Water-Resources Investigations,
book 9, chap. A1–A9. (Also available at http://water.usgs.
gov/owq/FieldManual/. )
Vitz, Ed, and Martin, R.D., 1991, Toward a standard
method for determining waterborne radon: American
Association of Radon Scientists and Technologists
1991 Radon Symposium Research Papers, p. 317–339,
accessed August 3, 2012, at http://www.aarst.org/
proceedings/1991/1991_22_Toward_a_Standard_Method_
for_Determining_Waterborne.pdf.
Whittaker, E.L., Akridge, J.D., and Giovino, J., 1989, Two test
procedures for radon in drinking water—Interlaboratory
collaborative study: Las Vegas, Nev., U.S. Environmental
Protection Agency, Environmental Monitoring Systems
Laboratory, Ofce of Research and Development, EPA-
600/2-87/082, 45 p.
Wilde, F.D., ed., 2004, Cleaning of equipment for water
sampling (ver. 2.0): U.S. Geological Survey Techniques of
Water-Resources Investigations, book 9, chap. A3.
Worthington, C.E., Sebastian, J.E., Gilmore, D.F., and
Beneld, R.C., 2007, Investigative report of carbon
disulde contamination in powder-free latex exam gloves,
in Tennessee Department of Environment & Conservation,
Department of Energy Oversight Division, Environmental
Monitoring Report, January through December 2006,
p. 233–236.
Zogorski, J.S., Carter, J.M., Ivahnenko, T., Lapham, W.W.,
Moran, M.J., Rowe, B.L., Squillace, P.J., and Toccalino,
P.L., 2006, Volatile organic compounds in the Nation’s
ground water and drinking-water supply wells: U.S.
Geological Survey Circular 1292, 101 p. (Also available at
http://pubs.usgs.gov/circ/circ1292/.)
74 VOC Blank Data and Study Reporting Levels, California GAMA PBP, 2004–2010
Table A1. Study unit names and Data Series Reports, California GAMA Priority Basin Project, May 2004 through September 2010.
[USGS, U.S. Geological Survey; DS, Data Series]
Study unit
Map
code
Data Series Report Online
Desert study units
Antelope Valley D1 Schmitt, S.J., Dawson, B.J., Belitz, K., 2009, Groundwater-quality data in the Antelope Valley study
unit, 2008: Results from the California GAMA Program: USGS DS 479, 79 p.
http://pubs.usgs.gov/ds/479/
Mojave D2 Mathany, T.M., Belitz, K., 2009, Ground-water quality data in the Mojave study unit, 2008: Results
from the California GAMA Program: USGS DS 440, 80 p.
http://pubs.usgs.gov/ds/440/
Coachella Valley D3 Goldrath, D.A., Wright, M.T., Belitz, K., 2009, Ground-water quality data in the Coachella Valley
study unit, 2007: Results from the California GAMA Program: USGS DS 373, 70 p.
http://pubs.usgs.gov/ds/373/
Colorado River D4 Goldrath, D.A., Wright, M.T., Belitz, K., 2010, Groundwater-quality data in the Colorado River study
unit, 2007: Results from the California GAMA Program: USGS DS 474, 66 p.
http://pubs.usgs.gov/ds/474/
Central Desert-Borrego D5 Mathany, T.M., Wright, M.T., Beuttel, B.S., Belitz, K., 2012, Groundwater-quality data in the Borrego
Valley, Central Desert, and Low-Use Basins of the Mojave and Sonoran Deserts, 2008–2010: USGS
DS 659, 100 p.
http://pubs.usgs.gov/ds/659/
Mountain study units
Sierra Nevada Regional M1 Shelton, J.L., Fram, M.S., Munday, C.M., Belitz, K., 2010, Groundwater-quality data for the Sierra
Nevada study unit, 2008: Results from the California GAMA Program: USGS DS 534, 106 p.
http://pubs.usgs.gov/ds/534/
Owens-Indian Wells M2 Densmore, J.N., Fram, M.S., Belitz, K., 2009, Ground-water quality data in the Owens and Indian
Wells Valleys study unit, 2006: Results from the California GAMA Program: USGS DS 427, 86 p.
http://pubs.usgs.gov/ds/427/
Southern Sierra Nevada M3 Fram, M.S., Belitz, K., 2007, Ground-water quality data in the Southern Sierra study unit, 2006—
Results from the California GAMA Program: USGS DS 301, 78 p.
http://pubs.usgs.gov/ds/301/
Central Sierra Nevada M4 Ferrari, M.J., Fram, M.S., Belitz, K., 2008, Ground-water quality in the Central Sierra study unit,
California, 2006: Results from the California GAMA Program: USGS DS 335, 60 p.
http://pubs.usgs.gov/ds/335/
Tahoe–Martis M5 Fram, M.S., Munday, C.M., Belitz, K., 2009, Groundwater quality data for the Tahoe–Martis study
unit, 2007: Results from the California GAMA Program: USGS DS 432, 88 p.
http://pubs.usgs.gov/ds/432/
Cascades-Modoc Plateau M6 Shelton, J.L., Fram, M.S., Belitz, K., 2012, Groundwater-quality data for the Cascades-Modoc Plateau
study unit, 2010: Results from the California GAMA Program: USGS DS 688, 126 p.
Appendix
References for the Data Series Reports for GAMA study units sampled between May 2004 and September 2010 are listed in table A1. Concentrations of the
17 VOCs detected in eld or source-solution blanks are listed in table A2 for the 211 eld blanks, and in table A3 for the 109 source-solution blanks.
Appendix 75
Table A1. Study unit names and Data Series Reports, California GAMA Priority Basin Project, May 2004 through September 2010.—Continued
[USGS, U.S. Geological Survey; DS, Data Series]
Study unit
Map
code
Data Series Report Online
North and Central Coast study units
Eureka-Crescent City N1 Mathany, T.M., Dawson, B.J., Shelton, J.L., Belitz, K., 2011, Groundwater quality data in the
Northern Coast Ranges study unit, 2009: Results from the California GAMA Program: USGS
DS 609, 92 p.
http://pubs.usgs.gov/ds/609/
Ukiah-Clear Lake N2
North San Francisco Bay N3 Kulongoski, J.T., Belitz, K., Dawson, B.J., 2006, Ground-water quality data in the North San
Francisco Bay hydrologic provinces, California, 2004: Results from the California Ground-Water
Ambient Monitoring Assessment (GAMA) Program: USGS DS 167, 100 p.
http://pubs.usgs.gov/ds/ds167/
San Francisco Bay N4 Ray, M.C., Kulongoski, J.T., Belitz, K., 2009, Ground-water quality data in the San Francisco Bay
study unit, 2007: Results from the California GAMA Program: USGS DS 396, 92 p.
http://pubs.usgs.gov/ds/396/
Livermore-Gilroy-Cuyama N5 Mathany, T.M., Kulongski, J.T., Ray, M.C., Belitz, K., 2009, Groundwater quality data in the South
Coast Interior Basins study unit, 2008: Results from the California GAMA Program: USGS DS
463, 82 p.
http://pubs.usgs.gov/ds/463/
Monterey-Salinas N6 Kulongoski, J. T., Belitz, K., 2007, Ground-water quality data in the Monterey Bay and Salinas Valley
Basins, California, 2005—Results from the California GAMA Program: USGS DS 258, 84 p.
http://pubs.usgs.gov/ds/2007/258/
Santa Maria-Lompoc N7 Mathany, T.M., Burton, C.A., Land, M.T., Belitz, K., 2010, Groundwater-quality data in the South
Coast Range–Coastal study unit, 2008: Results from the California GAMA Program: USGS
DS 504, 106 p.
http://pubs.usgs.gov/ds/504/
South Coast study units
Santa Clarita-Ventura S1 Montrella, J., Belitz, K., 2009, Ground-water quality data in the Santa Clara River Valley study unit,
2007: Results from the California GAMA Program: USGS DS 408, 84 p.
http://pubs.usgs.gov/ds/408/
Southern California Coastal
Plain
S2 Mathany, T.M., Land, M.T., Belitz, K., 2008, Ground-water quality data in the coastal Los Angeles
Basin Study Unit, 2006: Results from the California GAMA Program: USGS DS 387, 98 p.
http://pubs.usgs.gov/ds/387/
San Gabriel–San Fernando S3 Land, M.T., Belitz, K., 2008, Ground-water quality data in the San Fernando–San Gabriel study unit,
2005—Results from the California GAMA Program: USGS DS 356, 84 p.
http://pubs.usgs.gov/ds/356/
Santa Ana–San Jacinto S4 Kent, R.H., Belitz, K., 2009, Ground-water quality data in the Upper Santa Ana Watershed Study
Unit, November 2006 to March 2007: Results from the California GAMA Program: USGS DS 404,
116 p.
http://pubs.usgs.gov/ds/404/
San Diego area S5 Wright, M.T., Belitz, K., Burton, C.A., 2005, California GAMA Program—Ground-water quality in
the San Diego Drainages hydrogeologic province, California, 2004: USGS DS 129, 91 p.
http://pubs.usgs.gov/ds/2005/129/

76 VOC Blank Data and Study Reporting Levels, California GAMA PBP, 2004–2010
Study unit
Map
code
Data Series Report Online
Central Valley study units
Northern Sacramento Valley V1 Bennett, P.A., Bennett, G.L., V, Belitz, K., 2009, Groundwater quality data in the northern Sacramento
Valley, 2007: Results from the California GAMA Program: USGS DS 452, 90 p.
http://pubs.usgs.gov/ds/452/
Middle Sacramento Valley V2 Schmitt, S.J., Fram, M.S., Dawson, B.J., Belitz, K., 2008, Ground-water quality data in the middle
Sacramento Valley study unit, 2006—Results from the California GAMA Program: USGS DS 385,
100 p.
http://pubs.usgs.gov/ds/385/
Southern Sacramento Valley V3 Dawson, B.J., Bennett, G.L., V, Belitz, K., 2008, Ground-water quality data in the Southern
Sacramento Valley, California, 2005—Results from the California GAMA Program: USGS DS 285,
93 p.
http://pubs.usgs.gov/ds/285/
Northern San Joaquin V4 Bennett, G.L., V, Belitz, K., Dawson, B.J., 2006, California GAMA Program—Ground-water quality
data in the northern San Joaquin basin study unit, 2005: USGS DS 196, 122 p.
http://pubs.usgs.gov/ds/2006/196/
Central Eastside V5 Landon, M.K., Belitz, K., 2008, Ground-water quality data in the Central Eastside San Joaquin Basin
2006: Results from the California GAMA Program: USGS DS 325, 88 p.
http://pubs.usgs.gov/ds/325/
Madera-Chowchilla V6 Shelton, J.L., Fram, M.S., Belitz, K., 2009, Groundwater-quality data for the Madera–Chowchilla
study unit, 2008: Results from the California GAMA Program: USGS DS 455, 80 p.
http://pubs.usgs.gov/ds/455/
Southeast San Joaquin V7 Burton, C.A., Belitz, K., 2008, Ground-water quality data in the southeast San Joaquin Valley,
2005–2006—Results from the California GAMA Program: USGS DS 351, 103 p.
http://pubs.usgs.gov/ds/351/
Kern Basin V8 Shelton, J.L., Pimentel, I., Fram, M.S., Belitz, K., 2008, Ground-water quality data in the Kern County
subbasin study unit, 2006—Results from the California GAMA Program: USGS DS 337, 75 p.
http://pubs.usgs.gov/ds/337/
Western San Joaquin Valley V9 Mathany, T.M., Landon, M.L., Belitz, K., 2012, Ground-water quality data in the Western San Joaquin
Valley Study Unit, 2010: Results from the California GAMA Program: USGS DS 706 (in press)
Table A1. Study unit names, and Data Series Reports, California GAMA Priority Basin Project, May 2004 through September 2010.—Continued
[USGS, U.S. Geological Survey; DS, Data Series]

Appendix 77
Table A2. Volatile organic compounds (VOCs) detected in field blanks, California GAMA Priority Basin Project, May 2004 through September 2010.
[See table 1 for study unit names. Concentrations are reported here as unrounded values; data for these samples are reported as rounded values in the Data Series reports. Abbreviations: SSB, source-solution
blank; µg/L, micrograms per liter; –, not detected]
Collection
date
Collection
time
Paired
SSB
analyzed
Study
unit
Sampling line
configuration
Inferred
contamination
with methanol
Hydrocarbons
Benzene
(µg/L)
Ethylbenzene
(µg/L)
Styrene
(µg/L)
1,2,4-Trimethyl-
benzene
(µg/L)
Toluene
(µg/L)
m- and
p-Xylenes
(µg/L)
o-Xylene
(µg/L)
05/24/2004 1158 Ye s S5 Short Yes – – – – – – –
06/17/2004 1348 No S5 Short No – – – – – – –
07/01/2004 1008 Yes S5 Long No – – – – – – –
07/12/2004 1628 Yes S5 Short No – – – – – – –
08/31/2004 0908 No N3 Short No – – – – – – –
09/13/2004 0948 No N3 Long No – 0.021 – – 0.060 0.105 0.039
09/14/2004 0838 No N3 Short No – – – – – – –
09/20/2004 1008
Yes N3 Short No – – – – 0.008 – –
09/30/2004 1528 No N3 Short No – – – – – – –
10/04/2004 1048 Yes N3 Long Yes – 0.039 – – 0.106 0.211 0.064
10/07/2004 0938 No N3 Short No – – – – – – –
10/18/2004 1148 No N3 Short No – – – – – – –
10/26/2004 1108 No N3 Short No – – – – – – –
11/02/2004 1038 Yes N3 Long No – 0.053 – – 0.104 0.321 0.105
12/13/2004 1348 No V4 Short No – – – – – – –
01/04/2005 1228 Yes V4 Short No – – – – 0.016 – –
01/04/2005 1308 Yes V4 Long No – 0.031 – – 0.057 0.198 0.068
01/10/2005 1008 Yes V4 Long Yes
– 0.115 – – 0.302 0.522 0.232
01/12/2005 0938 No V4 Short No – – – – – – –
01/13/2005 0938 No V4 Short No – – – – – – –
02/08/2005 1208 No V4 Short No – – – – – – –
02/09/2005 1328 No V4 Short No – – – – – – –
03/22/2005 0938 Yes V3 Long Yes – 0.237 0.079 0.104 0.453 1.153 0.511
03/23/2005 0938 Yes V3 Short No – – – – 0.015 0.028 –
03/29/2005 1108 Ye s V3 Monitor Ye s 0.009 0.044 – 0.039 0.154 0.304 0.083
03/31/2005 0938 Yes V3 Short No – 0.022 – – 0.686 0.083 0.037
04/20/2005 1108 No V3 Short No – – – – – – –
05/11/2005 1328 No V3 Short No – – – –
– – –
05/19/2005 1258 No V3 Short No – – – – – – –
05/26/2005 1238 Yes V3 Short No – – – – 0.018 0.026 –
06/08/2005 1008 Yes S3 Long No – 0.022 – – 0.034 0.110 0.039
06/09/2005 0938 Yes S3 Short No – – – – – – –
06/13/2005 1238 Yes V3 Monitor No – 0.020 – 0.049 0.385 0.091 0.046
06/14/2005 1408 No S3 Short No – – – – – – –

78 VOC Blank Data and Study Reporting Levels, California GAMA PBP, 2004–2010
Table A2. Volatile organic compounds (VOCs) detected in field blanks, California GAMA Priority Basin Project, May 2004 through September 2010.—Continued
[See table 1 for study unit names. Concentrations are reported here as unrounded values; data for these samples are reported as rounded values in the Data Series reports. Abbreviations: SSB, source-solution
blank; µg/L, micrograms per liter; –, not detected]
Collection
date
Collection
time
Paired
SSB
analyzed
Study
unit
Sampling line
configuration
Inferred
contamination
with methanol
Hydrocarbons
Benzene
(µg/L)
Ethylbenzene
(µg/L)
Styrene
(µg/L)
1,2,4-Trimethyl-
benzene
(µg/L)
Toluene
(µg/L)
m- and
p-Xylenes
(µg/L)
o-Xylene
(µg/L)
06/22/2005 0948 Ye s S3 Long No – 0.060 – – 0.077 0.328 0.120
07/11/2005 1438 Yes S3 Short No – – – – 0.009 – –
07/19/2005 0908 Yes N6 Long No – 0.028 – – 0.051 0.118 0.047
07/25/2005 1128 Ye s N6 Short No – – – – – – –
08/02/2005 1218 Yes N6 Long No – – – – 0.012 – –
08/03/2005 0908 Yes N6 Long No – – – 0.556 0.036 0.065 –
08/09/2005 1008 Yes N6 Long No – 0.011 – – 0.048 0.057 0.020
08/10/2005 1208
Yes N6 Short No – – – – 0.194 – –
08/30/2005 1138 Ye s N6 Short No – – – – 0.049 – –
09/01/2005 1008 Yes N6 Long Yes – – – – 0.022 – –
09/15/2005 0848 No N6 Short No – – – – – – –
09/19/2005 1148 No N6 Short No – – – – – – –
09/21/2005 1108 Ye s N6 Monitor Ye s – – – – 0.020 – –
10/17/2005 1338 Ye s V7 Short No – – – – 0.065 – –
10/18/2005 0808 Yes V7 Long No – 0.022 – – 0.047 0.126 –
10/25/2005 0928 No V7 Short No – – – – – – –
10/26/2005 1308 Yes V7 Short No – – – – 0.017 – –
10/31/2005 1038 Yes V7 Monitor Yes
– 0.055 – – 0.232 0.372 0.118
11/15/2005 1108 No V7 Monitor No – – – – – – –
11/16/2005 1038 Yes V7 Short No – – – – 0.016 – –
11/30/2005 0928 No V7 Long No – – – – – – –
11/30/2005 1208 No V7 Short No – – – – – – –
12/07/2005 1128 No V7 Short No – – – – – – –
12/13/2006 0908 Ye s V7 Short Yes – 0.015 – – 0.053 0.066 0.029
01/10/2006 1008 Yes V8 Long Yes – 0.046 – – 0.121 0.236 0.104
01/11/2006 1408 Yes V8 Short Ye s – – – – 0.015 – –
01/24/2006 1248 Yes V8 Short No – – – – 0.012 – –
02/08 /2006 1208 Ye s V8 Long No – – – –
0.026 – –
02/09/2006 0908 Yes V8 Short No – – – – 0.015 – –
03/14/2006 0908 Yes V5 Monitor No – – – – – – –
03/14 /2006 9038 Ye s V5 Long Yes – 0.016 – – – 0.068 0.043
03/29/2006 0938 Ye s V5 Long Yes – – – – – – –
04/04/2006 1028 Yes V5 Short No – – – – 0.011 – –
04/20/2006 0938 No V5 Short No – – – – – – –

Appendix 79
Table A2. Volatile organic compounds (VOCs) detected in field blanks, California GAMA Priority Basin Project, May 2004 through September 2010.—Continued
[See table 1 for study unit names. Concentrations are reported here as unrounded values; data for these samples are reported as rounded values in the Data Series reports. Abbreviations: SSB, source-solution
blank; µg/L, micrograms per liter; –, not detected]
Collection
date
Collection
time
Paired
SSB
analyzed
Study
unit
Sampling line
configuration
Inferred
contamination
with methanol
Hydrocarbons
Benzene
(µg/L)
Ethylbenzene
(µg/L)
Styrene
(µg/L)
1,2,4-Trimethyl-
benzene
(µg/L)
Toluene
(µg/L)
m- and
p-Xylenes
(µg/L)
o-Xylene
(µg/L)
05/01/2006 1228 No V5 Short No – – – – – – –
05/09/2006 0608 Yes M4 Long Yes – 0.018 0.025 – 0.042 0.079 0.037
05/10/2006 1008 No M4 Long No – – – – – – –
05/24/2006 1208 Ye s M4 Long No – – – – 0.023 – –
05/25/2006 1208 Yes M4 Long No – – – – 0.011 – –
06/06/2006 0808 Yes M3 Long No – – – – – – –
06/06/2006 0928 Yes M3 Short No – – – – – – –
06/14/2006 0848
Yes M3 Short No – – – – 0.019 – –
06/15/2006 1008 No M3 Short No – – – – – – –
06/19/2006 0928 No M3 Short No – – – – – – –
06/22/2006 0958 No M3 Short No – – – – – – –
07/10/2006 1038 No V2 Short No – – – – – – –
07/11/2006 0938 No V2 Long No – – – – – – –
07/17/2006 1308 Yes V2 Monitor No – – – – 0.018 0.030 –
07/17/2006 1528 No V2 Short No – – – – – – –
07/20/2006 0908 Yes V2 Short Ye s 0.013 0.013 0.010 – 0.076 0.044 0.027
07/24/2006 1158 No V2 Short No – – – – – – –
07/25/2006 1538 Yes V2 Monitor No
– – – 0.019 0.069 0.074 –
08/03/2006 0938 Yes V2 Short Ye s – 0.017 0.015 – 0.102 0.057 –
08/07/2006 1008 Yes S2 Long No – – – – – – –
08/08/2006 0848 Ye s V2 Short Yes – – 0.017 – 0.156 0.057 –
08/14/2006 1258 Yes V2 Monitor No – – – – 0.017 – –
08/15/2006 0948 Yes V2 Monitor No – – – – – – –
08/21/2006 0958 No S2 Short No – – – – – – –
08/21/2006 1038 No V2 Monitor No – – – – – – –
08/28/2006 0958 Yes S2 Short Yes – – – – 0.060 – –
09/11/2006 1248 Yes S2 Short No – – – – – – –
09/13/2006 0828 No M2 Long No – – – –
– – –
09/21/2006 0948 Yes M2 Short No – – – – 0.016 – –
10/03/2006 1248 No M2 Short No – – – – – – –
10/05/2006 1008 No M2 Short No – – – – – – –
10/24/2006 1008 Yes M2 Monitor No – – – – 0.024 – –
11/13/2006 1328 Yes S2 Short No – – – – 0.015 – –
11/15/2006 0938 Yes S2 Long No – – – – – – –

80 VOC Blank Data and Study Reporting Levels, California GAMA PBP, 2004–2010
Table A2. Volatile organic compounds (VOCs) detected in field blanks, California GAMA Priority Basin Project, May 2004 through September 2010.—Continued
[See table 1 for study unit names. Concentrations are reported here as unrounded values; data for these samples are reported as rounded values in the Data Series reports. Abbreviations: SSB, source-solution
blank; µg/L, micrograms per liter; –, not detected]
Collection
date
Collection
time
Paired
SSB
analyzed
Study
unit
Sampling line
configuration
Inferred
contamination
with methanol
Hydrocarbons
Benzene
(µg/L)
Ethylbenzene
(µg/L)
Styrene
(µg/L)
1,2,4-Trimethyl-
benzene
(µg/L)
Toluene
(µg/L)
m- and
p-Xylenes
(µg/L)
o-Xylene
(µg/L)
11/28/2006 1428 Yes S4 Short No – – – – 0.008 – –
11/29/2006 0908 Yes S4 Long No – – – 0.035 0.010 – –
12/05/2006 0938 Yes S4 Long Yes – – – – – 0.021 –
01/23/2007 1218 No S4 Short No – – – – – – –
01/30/2007 1328 Ye s S4 Short No – – – – 0.016 – –
02/07/2007 0848 Ye s S4 Long No – – – – – – –
02/08/2007 1208 No S4 Short No – – – – – – –
02/14/2007 1218
No S4 Short No – – – – – – –
02/28/2007 0938 Ye s D3 Long No – 0.009 – – 0.019 0.033 0.010
03/05/2007 1208 Ye s D3 Short No – – – – 0.011 0.020 –
03/22/2007 1008 Ye s D3 Short No – – – – 0.126 – –
04/02/2007 0938 No S1 Short No – – – – – – –
04/02/2007 0948 Yes S1 Long Ye s – – – – – – –
04/16/2007 0938 Ye s S1 Short No – – – – – – –
04/17/2007 0858 Ye s S1 Short No – – – – – – –
04/23/2007 0938 No N4 Short No – – – – – – –
04/23/2007 1038 Ye s N4 Long No – – – – 0.017 0.053 –
04/30/2007 1258 No N4 Short No
– – – – – – –
05/07/2007 1458 Ye s S1 Monitor No – – – – 0.040 – –
05/08/2007 0928 Ye s N4 Monitor No – – – – 0.017 – –
05/21/2007 0908 No N4 Short No – – – – – – –
05/21/2007 1058 Ye s N4 Monitor No – – – – 0.012 0.032 –
06/13/2007 0918 Ye s N4 Long Yes – – – – – – –
06/19/2007 0908 Ye s N4 Monitor No – – – – 0.012 – –
06/20/2007 1338 No N4 Short No – – – – – – –
06/25/2007 1018 Ye s M5 Long Yes – – – – 0.018 – –
07/12/2007 0958 No M5 Long No – – – – – – –
07/25/2007 0838 No M5 Long No – – – –
– – –
08/01/2007 0858 Ye s M5 Long No – – – 0.121 0.015 – –
08/01/2007 0908 No M5 Long No – – – – – – –
08/27/2007 1008 Ye s M5 Monitor No – – – 0.048 – – –
08/27/2007 1038 No N3 Long No – – – – – – –
09/13/2007 0738 Ye s M5 Long No – – – 0.050 – – –
10/02/2007 0848 No V1 Long No – – – – – – –
10/03/2007 1038 No D4 Long No – – – – – – –

Appendix 81
Table A2. Volatile organic compounds (VOCs) detected in field blanks, California GAMA Priority Basin Project, May 2004 through September 2010.—Continued
[See table 1 for study unit names. Concentrations are reported here as unrounded values; data for these samples are reported as rounded values in the Data Series reports. Abbreviations: SSB, source-solution
blank; µg/L, micrograms per liter; –, not detected]
Collection
date
Collection
time
Paired
SSB
analyzed
Study
unit
Sampling line
configuration
Inferred
contamination
with methanol
Hydrocarbons
Benzene
(µg/L)
Ethylbenzene
(µg/L)
Styrene
(µg/L)
1,2,4-Trimethyl-
benzene
(µg/L)
Toluene
(µg/L)
m- and
p-Xylenes
(µg/L)
o-Xylene
(µg/L)
10/29/2007 0928 No V1 Long No – – – – – – –
11/16/2007 1038 Yes N3 Short No – – – – 0.021 – –
11/28/2007 1008 No D4 Long No – – – – – – –
11/29/2007 1228 No V1 Long No – – – – – – –
12/10/2007 1028 No D4 Long No – – – – – – –
12/11/2007 0858 No V1 Long No – – – – – – –
01/09/2008 0908 Ye s V1 Long No – – – – – – –
01/09/2008 1008
Yes V1 Monitor No – – – – – – –
01/16/2008 0858 Ye s V1 Monitor Ye s – – – – 0.019 – –
01/28/2008 0848 Ye s D1 Long Yes – – – – 0.009 – –
01/28/2008 1418 Ye s D1 Short No – – – – 0.015 – –
02/05/2008 0938 No D2 Short No – – – – – – –
02/07/2008 0918 Ye s D1 Long Yes – – – – 0.014 – –
02/12/2008 1228 No D2 Long No – – – – – – –
02/13/2008 1148 Ye s D1 Short No – – – – 0.023 – –
02/26/2008 1018 Ye s D1 Short No – – – – – – –
03/04/2008 0958 No D2 Long No – – – – – – –
03/05/2008 0908 No D1 Long No
– – – – – – –
03/18/2008 1318 No D2 Short No – – – – – – –
03/31/2008 1008 No V4 Long No – – – – – – –
04/03/2008 1028 No M5 Long No – – – – – – –
04/10/2008 1038 Ye s D1 Short No – – – – 0.019 – –
04/16/2008 1028 No V6 Long No – – – – – – –
04/21/2008 1108 No V6 Long No – – – – – – –
04/28/2008 1308 No V6 Long No – – – – – – –
05/05/2008 0908 No V6 Long No – – – – – – –
05/21/2008 1438 No N7 Short No – – – – – – –
06/05/2008 0928 No N7 Long No – – – –
– – –
06/11/2008 0908 Yes N7 Long No – – – – 0.175 – –
06/18/2008 1338 Ye s N7 Short No – – – 0.085 – – –
06/23/2008 1138 No M1 Short No – – – – – – –
06/23/2008 1318 No N7 Short No – – – – – – –
07/10/2008 0948 Ye s N7 Long Yes 0.019 – – – 0.026 – –
07/16/2008 0938 Ye s N7 Long No – – – – – – –
07/23/2008 1028 No M1 Short No – – – – – – –

82 VOC Blank Data and Study Reporting Levels, California GAMA PBP, 2004–2010
Table A2. Volatile organic compounds (VOCs) detected in field blanks, California GAMA Priority Basin Project, May 2004 through September 2010.—Continued
[See table 1 for study unit names. Concentrations are reported here as unrounded values; data for these samples are reported as rounded values in the Data Series reports. Abbreviations: SSB, source-solution
blank; µg/L, micrograms per liter; –, not detected]
Collection
date
Collection
time
Paired
SSB
analyzed
Study
unit
Sampling line
configuration
Inferred
contamination
with methanol
Hydrocarbons
Benzene
(µg/L)
Ethylbenzene
(µg/L)
Styrene
(µg/L)
1,2,4-Trimethyl-
benzene
(µg/L)
Toluene
(µg/L)
m- and
p-Xylenes
(µg/L)
o-Xylene
(µg/L)
07/29/2008 1038 No M1 Short No – – – – – – –
08/06/2008 0928 No M1 Short No – – – – – – –
08/07/2008 0848 No N7 Long No – – – – – – –
08/11/2008 0838 No N5 Short No – – – – – – –
08/18/2008 0848 No N5 Long No – – – – – – –
08/25/2008 0918 No M1 Short No – – – – – – –
08/26/2008 1128 No N5 Short No – – – – – – –
09/15/2008 1048
No M1 Short No – – – – – – –
09/17/2008 1008 No N5 Long No – – – – – – –
09/22/2008 0948 No N5 Short No – – – – – – –
10/09/2008 1048 No M1 Short No – – – – – – –
10/22/2008 1448 No M1 Short No – – – – – – –
10/29/2008 1108 No N5 Monitor No – – – – – – –
12/02/2008 0908 No D5 Short No – – – – – – –
12/11/2008 1018 No D5 Short No – – – – – – –
12/16/2008 0908 No D5 Short No – – – – – – –
06/01/2009 1048 Ye s N2 Long No – – – 0.024 – – –
06/24/2009 0938 Ye s N2 Long No
– – – – – – –
07/14/2009 0948 Ye s N2 Long No – – – 0.042 – – –
07/29/2009 1108 Ye s N1 Long No – – – – – – –
08/17/2009 1008 Ye s N1 Long No – – – – – – –
10/05/2009 1058 Ye s N1 Long No – – – 0.020 – – –
10/20/2009 1218 No D5 Short No – – – – – – –
12/08/2009 1418 No D5 Short No – – – – 0.023 – –
03/03/2010 1028 Ye s V9 Long No – – – – 0.041 – –
03/17/2010 1208 Ye s V9 Short No – – – – 0.029 – –
04/06/2010 1048 No V9 Monitor No – – – – – – –
04/14/2010 0808 No V9 Long No – – – –
– – –
05/18/2010 1208 No V9 Monitor No – – – – – – –
06/07/2010 0908 No V9 Short No – – – – – – –
06/15/2010 1008 No V9 Short No – – – – – – –

Appendix 83
Table A2. Volatile organic compounds (VOCs) detected in field blanks, California GAMA Priority Basin Project, May 2004 through September 2010.—Continued
[See table 1 for study unit names. Concentrations are reported here as unrounded values; data for these samples are reported as rounded values in the Data Series reports. Abbreviations: SSB, source-solution
blank; µg/L, micrograms per liter; –, not detected]
Collection
date
Collection
time
Paired
SSB
analyzed
Study
unit
Sampling line
configuration
Inferred
contamination
with methanol
Hydrocarbons
Benzene
(µg/L)
Ethylbenzene
(µg/L)
Styrene
(µg/L)
1,2,4-Trimethyl-
benzene
(µg/L)
Toluene
(µg/L)
m- and
p-Xylenes
(µg/L)
o-Xylene
(µg/L)
06/22/2010 1538 Yes V9 Short No – – – – 0.043 – –
07/14/2010 0908 Yes M6 Short No – – – – – – –
07/21/2010 0908 No M6 Short No – – – – – – –
07/28/2010 0908 No M6 Short No – – – – – – –
08/05/2010 1548 No M6 Short No – – – 0.069 – – –
08/10/2010 1028 No M6 Short No – – – – – – –
08/24/2010 0918 No M6 Short No – – – – – – –
08/31/2010 0928
No M6 Short No – – – 0.079 – – –

84 VOC Blank Data and Study Reporting Levels, California GAMA PBP, 2004–2010
Table A2. Volatile organic compounds (VOCs) detected in field blanks, California GAMA Priority Basin Project, May 2004 through September 2010.—Continued
[See table 1 for study unit names. Concentrations are reported here as unrounded values; data for these samples are reported as rounded values in the Data Series reports. Abbreviations: SSB, source-solution
blank; µg/L, micrograms per liter; –, not detected]
Collection
date
Collection
time
Solvents Other VOCs
Acetone
(µg/L)
2-Butanone
(µg/L)
1,1-Dichloro-
ethene
(µg/L)
Dichloro-
methane
(µg/L)
Tetrachloro-
ethene
(µg/L)
Tetrahy-
drofuran
(µg/L)
Trichloro-
ethene
(µg/L)
Bromodi-
chloro-
methane
(µg/L)
Carbon
disulfide
(µg/L)
Chloroform
(µg/L)
Trichloro-
fluoro-
methane
(µg/L)
05/24/2004 1158 2.732 – – – – – – – – – –
06/17/2004 1348 – – – – – – – – – – –
07/01/2004 1008 – – – – – – – – – 0.127 –
07/12/2004 1628 – – – – – – – – – – –
08/31/2004 0908 – – – – – – – – – – –
09/13/2004 0948 – – – – – – – – – – –
09/14/2004 0838
– – – – – – – – – – –
09/20/2004 1008 – – – – – – – – – – –
09/30/2004 1528 – – – – – – – – – – –
10/04/2004 1048 2.91 – – – – – – – – – –
10/07/2004 0938 – – – – – – – – – – –
10/18/2004 1148 – – – – – – – – – – –
10/26/2004 1108 – – – – – – – – – – –
11/02/2004 1038 – – – – – – – – 0.073 – –
12/13/2004 1348 – – – – – – – – – – –
01/04/2005 1228 – – – – – – – – – – –
01/04/2005 1308 – – – –
– – – – – – –
01/10/2005 1008 4.236 0.630 – – – – – – – – –
01/12/2005 0938 – – – – – – – – – – –
01/13/2005 0938 – – – – – – – – – – –
02/08/2005 1208 – – – – – – – – – – –
02/09/2005 1328 – – – – – – – – – – –
03/22/2005 0938 7.247 1.723 – – – – – – – – –
03/23/2005 0938 – – – – – – – – – – –
03/29/2005 1108 6.632 28.38 – – – 1.084 – – – – –
03/31/2005 0938 – – – – – – – – – – –
04/20/2005 1108 – – – – – – – –
– – –
05/11/2005 1328 – – – – – – – – – – –
05/19/2005 1258 – – – – – – – – – – –
05/26/2005 1238 – – – – – – – – – – –
06/08/2005 1008 – – – – 0.148 – 0.090 – – – –
06/09/2005 0938 – – – – – – – – – – –
06/13/2005 1238 – – – – – – – – – – –
06/14/2005 1408 – – – – – – – – – – –

Appendix 85
Table A2. Volatile organic compounds (VOCs) detected in field blanks, California GAMA Priority Basin Project, May 2004 through September 2010.—Continued
[See table 1 for study unit names. Concentrations are reported here as unrounded values; data for these samples are reported as rounded values in the Data Series reports. Abbreviations: SSB, source-solution
blank; µg/L, micrograms per liter; –, not detected]
Collection
date
Collection
time
Solvents Other VOCs
Acetone
(µg/L)
2-Butanone
(µg/L)
1,1-Dichloro-
ethene
(µg/L)
Dichloro-
methane
(µg/L)
Tetrachloro-
ethene
(µg/L)
Tetrahy-
drofuran
(µg/L)
Trichloro-
ethene
(µg/L)
Bromodi-
chloro-
methane
(µg/L)
Carbon
disulfide
(µg/L)
Chloroform
(µg/L)
Trichloro-
fluoro-
methane
(µg/L)
06/22/2005 0948 – – – – – – – – – – –
07/11/2005 1438 – – – – – – – – – – –
07/19/2005 0908 – – – – – – – – – – –
07/25/2005 1128 – – – – – – – – – – –
08/02/2005 1218 – – – – – – – – – – –
08/03/2005 0908 – – – – – – – – – – –
08/09/2005 1008
– – – – 0.027 – – – – – –
08/10/2005 1208 – – – – – – – – – – –
08/30/2005 1138 – – – – – – – – – – 0.100
09/01/2005 1008 – 1.342 – – – – – – – – –
09/15/2005 0848 – – – – – – – – – – –
09/19/2005 1148 – – – – – – – – – – –
09/21/2005 1108 11.59 30.79 – – – – – – – 0.104 –
10/17/2005 1338 – – – – – – – – – 0.038 –
10/18/2005 0808 – – – – – – – – – – –
10/25/2005 0928 – – – – – – – – – – –
10/26/2005 1308 – – – –
– – – – – – –
10/31/2005 1038 26.68 3.327 – – 0.026 – 0.021 – – 0.014 –
11/15/2005 1108 – – – – – – – – – – –
11/16/2005 1038 – – – – – – – – – – –
11/30/2005 0928 – – – – – – – – – – –
11/30/2005 1208 – – – – – – – – – – –
12/07/2005 1128 – – – – – – – – – – –
12/13/2006 0908 – 1.405 – – – – – – – – –
01/10/2006 1008 10.8 – – – – – 0.011 – – – –
01/11/2006 1408 – 3.488 – – – – – – – – –
01/24/2006 1248 – – – – – – – –
– – –
02/08/2006 1208 – – – – – – – – – – –
02/09/2006 0908 – – – 0.028 – – – – – – –
03/14/2006 0908 – – – – – – – – – 0.054 –
03/14/2006 9038 29.1 123.7 – – – 3.006 – – – – –
03/29/2006 0938 – 4.029 – – – – – – – – –
04/04/2006 1028 – – – – – – – – – – –
04/20/2006 0938 – – – – – – – – – – –

86 VOC Blank Data and Study Reporting Levels, California GAMA PBP, 2004–2010
Table A2. Volatile organic compounds (VOCs) detected in field blanks, California GAMA Priority Basin Project, May 2004 through September 2010.—Continued
[See table 1 for study unit names. Concentrations are reported here as unrounded values; data for these samples are reported as rounded values in the Data Series reports. Abbreviations: SSB, source-solution
blank; µg/L, micrograms per liter; –, not detected]
Collection
date
Collection
time
Solvents Other VOCs
Acetone
(µg/L)
2-Butanone
(µg/L)
1,1-Dichloro-
ethene
(µg/L)
Dichloro-
methane
(µg/L)
Tetrachloro-
ethene
(µg/L)
Tetrahy-
drofuran
(µg/L)
Trichloro-
ethene
(µg/L)
Bromodi-
chloro-
methane
(µg/L)
Carbon
disulfide
(µg/L)
Chloroform
(µg/L)
Trichloro-
fluoro-
methane
(µg/L)
05/01/2006 1228 – – – – – – – – – – –
05/09/2006 0608 – 2.402 – 0.157 – – – – – – –
05/10/2006 1008 – – – – – – – – – – –
05/24/2006 1208 – – – – – – – – – – –
05/25/2006 1208 – – – – – – – – – – –
06/06/2006 0808 – – – – – – – – – – –
06/06/2006 0928
– – – – – – – – – – –
06/14/2006 0848 – – – – – – – – – – –
06/15/2006 1008 – – – – – – – – – – –
06/19/2006 0928 – – – – – – – – – – –
06/22/2006 0958 – – – – – – – – – – –
07/10/2006 1038 – – – – – – – – – – –
07/11/2006 0938 – – – – – – – – – – –
07/17/2006 1308 – – – – – – – – – – –
07/17/2006 1528 – – – – – – – – – – –
07/20/2006 0908 10.58 1.363 – – – – – – – – –
07/24/2006 1158 – – – –
– – – – – – –
07/25/2006 1538 – – – – – – – – – – –
08/03/2006 0938 3.045 – – 0.062 – – – – – 0.035 –
08/07/2006 1008 – – – – – – – – – – –
08/08/2006 0848 7.544 5.862 – – – – – – – – –
08/14/2006 1258 – – – – – – – – – – –
08/15/2006 0948 – – – – – – – – – – –
08/21/2006 0958 – – – – – – – – – – –
08/21/2006 1038 – – – – – – – – – – –
08/28/2006 0958 2.911 – – 0.049 – – – 0.106 – 0.194 –
09/11/2006 1248 – – – – – – – –
– – –
09/13/2006 0828 – – – – – – – – – – –
09/21/2006 0948 – – – – – – – – – – –
10/03/2006 1248 – – – – – – – – – – –
10/05/2006 1008 – – – – – – – – – – –
10/24/2006 1008 – – – – – – – – – 0.051 –
11/13/2006 1328 – – – – – – – – – – –
11/15/2006 0938 – – – – – – – – – – –

Appendix 87
Table A2. Volatile organic compounds (VOCs) detected in field blanks, California GAMA Priority Basin Project, May 2004 through September 2010.—Continued
[See table 1 for study unit names. Concentrations are reported here as unrounded values; data for these samples are reported as rounded values in the Data Series reports. Abbreviations: SSB, source-solution
blank; µg/L, micrograms per liter; –, not detected]
Collection
date
Collection
time
Solvents Other VOCs
Acetone
(µg/L)
2-Butanone
(µg/L)
1,1-Dichloro-
ethene
(µg/L)
Dichloro-
methane
(µg/L)
Tetrachloro-
ethene
(µg/L)
Tetrahy-
drofuran
(µg/L)
Trichloro-
ethene
(µg/L)
Bromodi-
chloro-
methane
(µg/L)
Carbon
disulfide
(µg/L)
Chloroform
(µg/L)
Trichloro-
fluoro-
methane
(µg/L)
11/28/2006 1428 – – – – – – – – – – –
11/29/2006 0908 – – – – – – – – – – –
12/05/2006 0938 3.696 12.61 – – – – – – – – –
01/23/2007 1218 – – – – – – – – – – –
01/30/2007 1328 – – – – – – – – – – –
02/07/2007 0848 – – – – – – – – – – –
02/08/2007 1208
– – – – – – – – – – –
02/14/2007 1218 – – – – – – – – – – –
02/28/2007 0938 – – – – – – – – – – –
03/05/2007 1208 – – – – – – – – – – –
03/22/2007 1008 – – – – – – – – – – –
04/02/2007 0938 – – – – – – – – – – –
04/02/2007 0948 – 0.922 – – – – – – – – –
04/16/2007 0938 – – – – – – – – – – –
04/17/2007 0858 – – – – – – – – – – –
04/23/2007 0938 – – – – – – – – – – –
04/23/2007 1038 – – – –
– – – – – – –
04/30/2007 1258 – – – – – – – – – – –
05/07/2007 1458 – – – – – – – – – – –
05/08/2007 0928 – – – – – – – – – – –
05/21/2007 0908 – – – – – – – – – – –
05/21/2007 1058 – – – – – – – – – – –
06/13/2007 0918 – 8.581 – – – – – – 0.043 – –
06/19/2007 0908 – – – – – – – – – – –
06/20/2007 1338 – – – – – – – – – – –
06/25/2007 1018 – 4.099 – – – – – – – – –
07/12/2007 0958 – – – – – – – –
– – –
07/25/2007 0838 – – – – – – – – – – –
08/01/2007 0858 – – – – – – – – – – –
08/01/2007 0908 – – – – – – – – – – –
08/27/2007 1008 – – – – – – – – – – –
08/27/2007 1038 – – – – – – – – – – –
09/13/2007 0738 – – – – – – – – – – –
10/02/2007 0848 – – – – – – – – – – –
10/03/2007 1038 – – – – – – – – – – –

88 VOC Blank Data and Study Reporting Levels, California GAMA PBP, 2004–2010
Table A2. Volatile organic compounds (VOCs) detected in field blanks, California GAMA Priority Basin Project, May 2004 through September 2010.—Continued
[See table 1 for study unit names. Concentrations are reported here as unrounded values; data for these samples are reported as rounded values in the Data Series reports. Abbreviations: SSB, source-solution
blank; µg/L, micrograms per liter; –, not detected]
Collection
date
Collection
time
Solvents Other VOCs
Acetone
(µg/L)
2-Butanone
(µg/L)
1,1-Dichloro-
ethene
(µg/L)
Dichloro-
methane
(µg/L)
Tetrachloro-
ethene
(µg/L)
Tetrahy-
drofuran
(µg/L)
Trichloro-
ethene
(µg/L)
Bromodi-
chloro-
methane
(µg/L)
Carbon
disulfide
(µg/L)
Chloroform
(µg/L)
Trichloro-
fluoro-
methane
(µg/L)
10/29/2007 0928 – – – – – – – – – – –
11/16/2007 1038 – – – – – – – – – – –
11/28/2007 1008 – – – – – – – – – – –
11/29/2007 1228 – – – – – – – – – – –
12/10/2007 1028 – – – – – – – – – – –
12/11/2007 0858 – – – – – – – – – – –
01/09/2008 0908
1.938 – – – – – – – – – –
01/09/2008 1008 – – – – – – – – – – –
01/16/2008 0858 3.744 – – – – – – – – – –
01/28/2008 0848 1.319 0.471 – – – – – – – – –
01/28/2008 1418 1.003 – – – – – – – – – –
02/05/2008 0938 – – – – – – – – – – –
02/07/2008 0918 0.999 0.612 – – – – – – – – –
02/12/2008 1228 – – – – – – – – – – –
02/13/2008 1148 – – – – – – – – – – –
02/26/2008 1018 – – – – – – – – – – –
03/04/2008 0958 – – – –
– – – – – – –
03/05/2008 0908 – – – – – – – – – – –
03/18/2008 1318 – – – – – – – – – – –
03/31/2008 1008 – – – – – – – – – – –
04/03/2008 1028 – – – – – – – – – – –
04/10/2008 1038 – – – – – – – – – – –
04/16/2008 1028 – – – – – – – – – – –
04/21/2008 1108 – – – – – – – – – – –
04/28/2008 1308 – – – – – – – – – – –
05/05/2008 0908 – – – – – – – – – – –
05/21/2008 1438 – – – – – – – –
– – –
06/05/2008 0928 – – – – – – – – – – –
06/11/2008 0908 – – – – – – – – – – –
06/18/2008 1338 – – – – – – – – – – –
06/23/2008 1138 – – – – – – – – – – –
06/23/2008 1318 – – – – – – – – – – –
07/10/2008 0948 – 0.827 – – – – – – – – –
07/16/2008 0938 – – – – – – – – – – –
07/23/2008 1028 – – – – – – – – – – –

Appendix 89
Table A2. Volatile organic compounds (VOCs) detected in field blanks, California GAMA Priority Basin Project, May 2004 through September 2010.—Continued
[See table 1 for study unit names. Concentrations are reported here as unrounded values; data for these samples are reported as rounded values in the Data Series reports. Abbreviations: SSB, source-solution
blank; µg/L, micrograms per liter; –, not detected]
Collection
date
Collection
time
Solvents Other VOCs
Acetone
(µg/L)
2-Butanone
(µg/L)
1,1-Dichloro-
ethene
(µg/L)
Dichloro-
methane
(µg/L)
Tetrachloro-
ethene
(µg/L)
Tetrahy-
drofuran
(µg/L)
Trichloro-
ethene
(µg/L)
Bromodi-
chloro-
methane
(µg/L)
Carbon
disulfide
(µg/L)
Chloroform
(µg/L)
Trichloro-
fluoro-
methane
(µg/L)
07/29/2008 1038 – – – – – – – – – – –
08/06/2008 0928 – – – – – – – – – – –
08/07/2008 0848 – – – – – – – – – – –
08/11/2008 0838 – – – – – – – – – – –
08/18/2008 0848 – – – – – – – – – – –
08/25/2008 0918 – – – – – – – – – – –
08/26/2008 1128
– – – – – – – – – – –
09/15/2008 1048 – – – – – – – – – – –
09/17/2008 1008 – – – – – – – – – – –
09/22/2008 0948 – – – – – – – – – – –
10/09/2008 1048 – – – – – – – – – – –
10/22/2008 1448 – – – – – – – – – – –
10/29/2008 1108 – – – – – – – – – 0.024 –
12/02/2008 0908 – – – – – – – – – – –
12/11/2008 1018 – – – – – – – – – – –
12/16/2008 0908 – – – – – – – – – – –
06/01/2009 1048 – – – –
– – – – – – –
06/24/2009 0938 – – – – – – – – – – –
07/14/2009 0948 – – – – – – – – – 0.016 –
07/29/2009 1108 – – – – – – – – – – –
08/17/2009 1008 – – – – – – – – 0.056 – –
10/05/2009 1058 – – – – – – – – – – –
10/20 /2009 1218 – – – – 0.021 – – – – – –
12/08/2009 1418 – – – – – – – – – – –
03/03/2010 1028 – – – – – – – – – – –
03/17/2010 1208 – – – – – – – – – – –
04/06/2010 1048 – – – – – – – –
– – –
04/14/2010 0808 – – – – – – – – – – –
05/18/2010 1208 0.327 – – – – – – – – – –
06/07/2010 0908 – – – – – – – – – – –
06/15/2010 1008 – – – – – – – – 0.056 – –

90 VOC Blank Data and Study Reporting Levels, California GAMA PBP, 2004–2010
Table A2. Volatile organic compounds (VOCs) detected in field blanks, California GAMA Priority Basin Project, May 2004 through September 2010.—Continued
[See table 1 for study unit names. Concentrations are reported here as unrounded values; data for these samples are reported as rounded values in the Data Series reports. Abbreviations: SSB, source-solution
blank; µg/L, micrograms per liter; –, not detected]
Collection
date
Collection
time
Solvents Other VOCs
Acetone
(µg/L)
2-Butanone
(µg/L)
1,1-Dichloro-
ethene
(µg/L)
Dichloro-
methane
(µg/L)
Tetrachloro-
ethene
(µg/L)
Tetrahy-
drofuran
(µg/L)
Trichloro-
ethene
(µg/L)
Bromodi-
chloro-
methane
(µg/L)
Carbon
disulfide
(µg/L)
Chloroform
(µg/L)
Trichloro-
fluoro-
methane
(µg/L)
06/22/2010 1538 – – – – – – – – – – –
07/14/2010 0908 – – – – – – – – – – –
07/21/2010 0908 – – – – – – – – – – –
07/28/2010 0908 – – – – – – – – – – –
08/05/2010 1548 – – – – – – – – 0.092 – –
08/10/2010 1028 – – – – – – – – – – –
08/24/2010 0918
– – – – – – – – – – –
08/31/2010 0928 – – – – – – – – 0.060 – –

Appendix 91
Table A3. Volatile organic compounds (VOCs) detected in source-solution blanks, California GAMA Priority Basin Project, May 2004 through September 2010.
[Unrounded data are reported. Abbreviations: µg/L microgram per liter. See table 1 for study unit names; –, not detected]
Collection
date
Collection
time
Study
unit
Hydrocarbons Solvents Other VOCs
Benzene
(µg/L)
Ethyl-
benzene
(µg/L)
Styrene
(µg/L)
1,2,4-
Trimethyl-
benzene
(µg/L)
Toluene
(µg/L)
m- and
p-Xylenes
(µg/L)
o-Xylene
(µg/L)
Acetone
(µg/L)
2-Bu-
tanone
(µg/L)
1,1-Di-
chloro-
ethene
(µg/L)
Di-
chloro-
methane
(µg/L)
Tetra-
chloro-
ethene
(µg/L)
Tetra-
hydro-
furan
(µg/L)
Tri-
chloro-
ethene
(µg/L)
Bromo-
dichloro-
methane
(µg/L)
Carbon
disulfide
(µg/L)
Chloro-
form
(µg/L)
Trichloro-
fluoro-
methane
(µg/L)
05/20/2004 1049 S5 – – – – 0.011 – – – – – – – – – – – – –
05/24/2004 1159 S5 – – – – 0.024 – – 2.842 – –
– – – – – – – –
07/01/2004 1007 S5 – – – – 0.025 – – – – – – – – – – – 0.121 –
07/01/2004 1009 S5 – – – – – – – – – – – – – – – – – –
07/12/2004 1629 S5 – – – – – – – – – – – – – – – – – –
09/20/2004 1007 N3 – – – – 0.010 – – – – – – – – – – – – –
10/04/2004 1047 N3 – – – 0.086 0.020 – – 2.744 – – – – – – – – – –
11/02/2004 1037 N3 – – – – 0.033 0.038 – – – – – – – – – 0.044 – –
01/04/2004 1227 V4 – – – – 0.016 – – – – – – – – – – – – –
01/04/2004 1307 V4 – – – – 0.022 0.020 – – – – – – – – – – – –
01/10/2004 1007 V4 – – – – 0.026 – – – – – – – – – – – – –
03/22/2004 0937 V3 – 0.023 – 0.059 0.047 0.085 0.037 – – – – – – – – – – –
03/23/2004 0937 V3 – – – – 0.011 – – – – – – – – – – – – –
03/29/2004 1107 V3 – – – 0.029 – – – – – – – – – – – – – –
03/31/2004 0937 V3 – – – – –
– – – – – – – – – – – – –
05/26/2005 1237 V3 – – – – 0.024 0.027 – 1.216 – – – – – – – – – –
06/08/2005 1007 S3 – 0.039 – – 0.041 0.176 0.080 – – – – – – – – – – –
06/09/2005 0937 S3 – – – – 0.012 – – – – – – – – – – – – –
06/13/2005 1237 V3 – – – – – – – – – – – – – – – – – –
06/22/2005 0947 S3 – – – – – – – – – – – – – – – – – –
07/11/2005 1437 S3 – – – – 0.013 – – – – – – – –
– – 0.033 – –
07/19/2005 0907 N6 – – – – 0.012 – – – – – – – – – – – – –
07/25/2005 1127 N6 – – – – – – – – – – – – – – – – – –
08/02/2005 1217 N6 – – – – – – – – – – – – – – – – – –
08/03/2005 0907 N6 – – – – 0.026 – – – – – – – – – – – – –
08/09/2005 1007 N6 – – – – 0.026 – – – – – – – – – – – – –
08/10/2005 1207 N6 – – – – 0.018 – – – – – – – – – – 0.089 – –
08/30/2005 1137 N6
– – – – – – – – – – – – – – – – – 0.112
09/01/2005 1007 N6 – – – – 0.012 – – – – – – – – – – 0.014 – –
09/21/2005 1107 N6 – – – – – – – – – – – – – – – – – –
10/17/2005 1337 V7 – – – – – – – – – – – – – – – – – –
10/18/2005 0807 V7 – – – – – – – – – – – – – – – – – –
10/26/2005 1307 V7 – – – – – – – – – – – – – – – – – –
10/31/2005 1037 V7 – – – – – – – –
– – – – – – – – – –
11/16/2005 1037 V7 – – – – – – – – – – – – – – – – – –
12/13/2005 0907 V7 – – – – 0.022 – – – – – – – – – – – – –

92 VOC Blank Data and Study Reporting Levels, California GAMA PBP, 2004–2010
Table A3. Volatile organic compounds (VOCs) detected in source/solution blanks, California GAMA Priority Basin Project, May 2004 through September 2010.—Continued
[Unrounded data are reported. Abbreviations: µg/L microgram per liter. See table 1 for study unit names; –, not detected]
Collection
date
Collection
time
Study
unit
Hydrocarbons Solvents Other VOCs
Benzene
(µg/L)
Ethyl-
benzene
(µg/L)
Styrene
(µg/L)
1,2,4-
Trimethyl-
benzene
(µg/L)
Toluene
(µg/L)
m- and
p-Xylenes
(µg/L)
o-Xylene
(µg/L)
Acetone
(µg/L)
2-Bu-
tanone
(µg/L)
1,1-Di-
chloro-
ethene
(µg/L)
Di-
chloro-
methane
(µg/L)
Tetra-
chloro-
ethene
(µg/L)
Tetra-
hydro-
furan
(µg/L)
Tri-
chloro-
ethene
(µg/L)
Bromo-
dichloro-
methane
(µg/L)
Carbon
disulfide
(µg/L)
Chloro-
form
(µg/L)
Trichloro-
fluoro-
methane
(µg/L)
01/10/2006 1007 V8 – – – – – – – – – – – – – – – – – –
01/11/2006 1407 V8 – – – – – – – – – –
– – – – – – – –
01/24/2006 1247 V8 – – – – 0.011 – – – – – – – – – – – – –
02/08/2006 1207 V8 – – – – 0.038 – – – – – – – – – – – – –
02/09/2006 0907 V8 – – – – – – – – – – – – – – – – – –
03/14/2006 0907 V5 – – – – 0.01 – – – – – – – – – – – – –
03/14/2006 0937 V5 – – – – 0.015 – – – – – – – – – – – – –
03/29/2006 0937 V5 – – – – – – – – – – – – – – – – – –
04/04/2006 1027 V5 – – – – – – – – – – – – – – – – – –
05/09/2006 0607 M4 – – – – – – – – – – – – – – – – – –
05/24/2006 1207 M4 – – – – – – – – – – – – – – – – – –
05/25/2006 1207 M4 – – – – 0.018 – – – – – – – – – – – – –
06/06/2006 0807 M3 – – – – – – – – – – – – – – – – – –
06/06/2006 0927 M3 – – – – – – – – – – – – – – – – – –
06/14/2006 0847 M3 – – – – –
– – – – – – – – – – – – –
07/17/2006 1307 V2 – – – – – – – – – – – – – – – – – –
07/20/2006 0907 V2 – – – – 0.014 – – – – – – – – – – – – –
07/25/2006 1537 V2 – – – – – – – – – – – – – – – – – –
08/03/2006 0937 V2 – – – – 0.018 – – – – – – – – – – – – –
08/07/2006 1007 S2 – – – – 0.014 – – – – – – – – – – – – –
08/08/2006 0847 V2 – – – – 0.011 – – – – – – – –
– – – – –
08/14/2006 1247 V2 – – – 0.040 – – – – – – – – – – – – – –
08/15/2006 0947 V2 – – – – – – – – – – – – – – – – – –
08/28/2006 0957 S2 – – – – – – – – – – – – – – – – – –
09/11/2006 1247 S2 – – – – – – – – – – – – – – – – – –
09/21/2006 0947 M2 – – – – – – – – – – – – – – – – – –
10/24/2006 1007 M2 – – – – – – – – – – – – – – – – – –
11/13/2006 1327 S2
– – – – 0.017 – – – – – – – – – – – – –
11/15/2006 0937 S2 – – – – – – – – – – – – – – – – – –
11/28/2006 1427 S4 – – – – 0.034 – – – – – – – – – – – – –
11/29/2006 0907 S4 – – – – – – – – – – – – – – – – – –
12/05/2006 0937 S4 – – – – – – – – – – – – – – – – – –
01/30/2007 1327 S4 – – – – – – – – – – – – – – – – – –
02/07/2007 0847 S4 – – – – 0.019 – – –
– – – – – – – – – –
02/28/2007 0937 D3 – – – – 0.010 0.009 – – – – – – – – – – – –
03/05/2007 1207 D3 – – – – 0.012 – – – – – – – – – – – – –

Appendix 93
Table A3. Volatile organic compounds (VOCs) detected in source/solution blanks, California GAMA Priority Basin Project, May 2004 through September 2010.—Continued
[Unrounded data are reported. Abbreviations: µg/L microgram per liter. See table 1 for study unit names; –, not detected]
Collection
date
Collection
time
Study
unit
Hydrocarbons Solvents Other VOCs
Benzene
(µg/L)
Ethyl-
benzene
(µg/L)
Styrene
(µg/L)
1,2,4-
Trimethyl-
benzene
(µg/L)
Toluene
(µg/L)
m- and
p-Xylenes
(µg/L)
o-Xylene
(µg/L)
Acetone
(µg/L)
2-Bu-
tanone
(µg/L)
1,1-Di-
chloro-
ethene
(µg/L)
Di-
chloro-
methane
(µg/L)
Tetra-
chloro-
ethene
(µg/L)
Tetra-
hydro-
furan
(µg/L)
Tri-
chloro-
ethene
(µg/L)
Bromo-
dichloro-
methane
(µg/L)
Carbon
disulfide
(µg/L)
Chloro-
form
(µg/L)
Trichloro-
fluoro-
methane
(µg/L)
03/22/2007 1007 D3 – – – – 0.330 0.022 – – – – – – – – – – – –
04/02/2007 0947 S1 – – – – – – – – – –
– – – – – – – –
04/16/2007 0937 S1 – – – – – – – – – – – – – – – – – –
04/17/2007 0857 S1 – – – – – – – – – – – – – – – – – –
04/23/2007 1037 N4 – – – – 0.018 – – – – – – – – – – – – –
05/07/2007 1457 S1 – – – – 0.025 – – – – – – – – – – – – –
05/08/2007 0927 N4 – – – – – – – – – – – – – – – – – –
05/21/2007 1057 N4 – – – – – – – – – – – – – – – – – –
06/13/2007 0917 N4 – – – – – – – – – – – – – – – – – –
06/19/2007 0907 N4 – – – – – – – – – – – – – – – – – –
06/25/2007 1017 M5 – – – – – – – – – – – – – – – – – –
08/27/2007 1007 M5 – – – – – – – – – – – – – – – – – –
09/13/2007 0737 M5 – – – 0.030 – – – – – – – – – – – – – –
11/16/2007 1037 N3 – – – – – – – – – – – – – – – – – –
01/09/2008 0907 V1 – – – – –
– – 1.458 – – – – – – – – – –
01/09/2008 1007 V1 – – – – – – – – – – – – – – – – – –
01/16/2008 0857 V1 – – – – – – – – – – – – – – – – – –
01/28/2008 0847 D1 – – – – 0.017 – – 1.34 0.536 – – – – – – – – –
01/28/2008 1417 D1 – – – – 0.022 – – 1.216 – – – – – – – – – –
02/07/2008 0917 D1 – – – – 0.038 – – – – – 0.182 – – – – – – –
02/13/2008 1147 D1 – – – – 0.016 – – – – – – – –
– – – – –
02/26/2008 1017 D1 – – – – 0.018 – – – – – – – – – – – – –
04/10/2008 1037 D1 – – – – 0.068 – – – – – – – – – – – – –
06/11/2008 0907 N7 – – – – – – – – – – – – – – – – – –
06/18/2008 1337 N7 – – – – – – – – – – – – – – – – – –
07/10/2008 0947 N7 – – – – – – – – – – – – – – – – – –
07/16/2008 0937 N7 – – – – – – – – – 0.026 – – – – – – – –
06/01/2009 1047 N2
– – – – – – – – – – – – – – – – – –
06/24/2009 0937 N2 – – – – – – – – – – – – – – – – – –
07/14/2009 0947 N2 – – – 0.047 – – – – – – – – – – – – – –
07/29/2009 1107 N1 – – – – – – – – – – – – – – – – – –
08/17/2009 1007 N1 – – – – – – – – – – – – – – – – – –
10/05/2009 1057 N1 – – – 0.016 – – – – – – – – – – – – – –
03/03/2010 1027 V9 – – – – 0.015 – – –
– – – – – – – – – –
03/17 2010 1207 V9 – – – – – – – – – – – – – – – – – –
06/22 2010 1537 V9 – – – – – – – – – – – – – – – – – –
07/14 2010 0907 M6 – – – – – – – – – – – – – – – – – –
94 VOC Blank Data and Study Reporting Levels, California GAMA PBP, 2004–2010
This page intentionally left blank.

Publishing support provided by the U.S. Geological Survey Science
Publishing Network, Sacramento, Tacoma, and Raleigh Publishing Service Centers
For more information concerning the research in this report, contact the
Director, California Water Science Center
U.S. Geological Survey
6000 J Street, Placer Hall
Sacramento, California 95819
http://ca.water.usgs.gov

Printed on recycled paper
