November 16, 2023
TRUMP MAINTAINS CONTROL IN NH GOP PRIMARY; FOREIGN POLICY INCREASINGLY IMPORTANT TO GOP PRIMARY VOTERS
DURHAM, NH - Donald Trump connues to lead the 2024 New Hampshire Republican Primary and he is now the most personally popular
candidate among GOP Primary voters. Nikki Haley connues to gain support and is in second place in the GOP field, followed by Chris
Chrise. On the issues, foreign policy has become far more important since September, while support for a 15-week aboron ban has
declined. Few likely Republican primary voters paid close aenon to the November Republican debate and only about half are
interested in further debates taking place.
2024 Republican Presidenal Primary
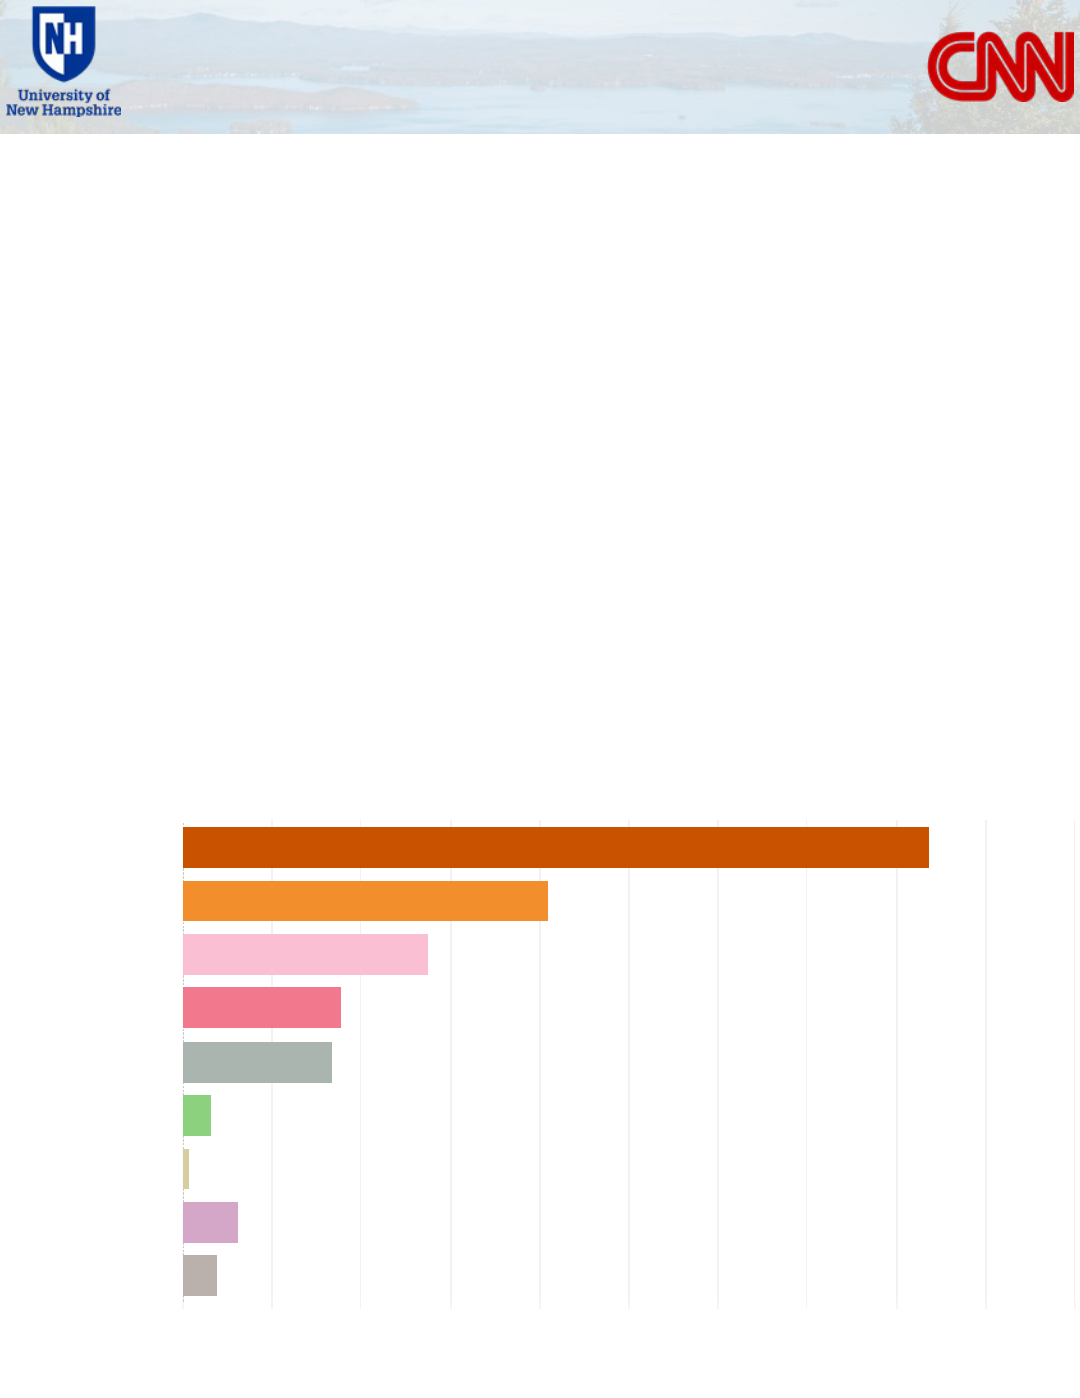
Former President Trump connues to lead his GOP rivals in the 2024 Republican Presidenal Primary. Forty-two percent of likely primary
voters support Trump, followed by former South Carolina Governor Nikki Haley (20%) and former New Jersey Governor Chris Chrise
(14%). Florida Governor Ron DeSans connues to slide in New Hampshire and is now ed with entrepreneur Vivek Ramaswamy at 9%
and 8% respecvely. Few voters support North Dakota Governor Doug Burgum (2%), former Arkansas Governor Asa Hutchinson (<1%) or
another candidate (3%), while 2% are unsure.
Six in ten (61%) self-described conservaves support Trump, while most libertarians support Trump (44%) or Ramaswamy (25%). Trump
fares far worse among moderates, earning only 18% of the vote among this group compared to 35% who support Haley and 33% who
support Chrise. Trump earns nearly half of the vote (48%) among those without a college degree but leads Haley by only three
percentage points (29% to 26%) among those with a college degree. Seventeen percent of likely Republican primary voters say that they
did not vote in the last compeve Republican primary held in 2016. Chrise (36%) leads among these new voters followed by Haley
(31%) while Trump earns only 9% of the vote among this group.
Sean P. McKinley, M.A.
Kate Senzamici, M.A.
Andrew E. Smith, Ph.D.
andrew.smith@unh.edu
603-862-2226
cola.unh.edu/unh-survey-center
By:
*
Zachary S. Azem, M.A.
Tracy Keirns, Ph.D.
We ask that this copyrighted informaon be referred to as the CNN New Hampshire Primary Poll, conducted by the University of New Hampshire Survey
Center.
First Choice GOP 2024 Presidenal Candidate - Likely GOP Primary Voters - November 2023
0% 5% 10% 15% 20% 25% 30% 35% 40% 45% 50%
Donald Trump
Nikki Haley
Chris Christie
Ron DeSantis
Vivek Ramaswamy
Doug Burgum
Asa Hutchinson
Other
Don't know/Not sure
42%
20%
14%
9%
8%
2%
0%
3%
2%
CNN 2024 NH Primary Poll
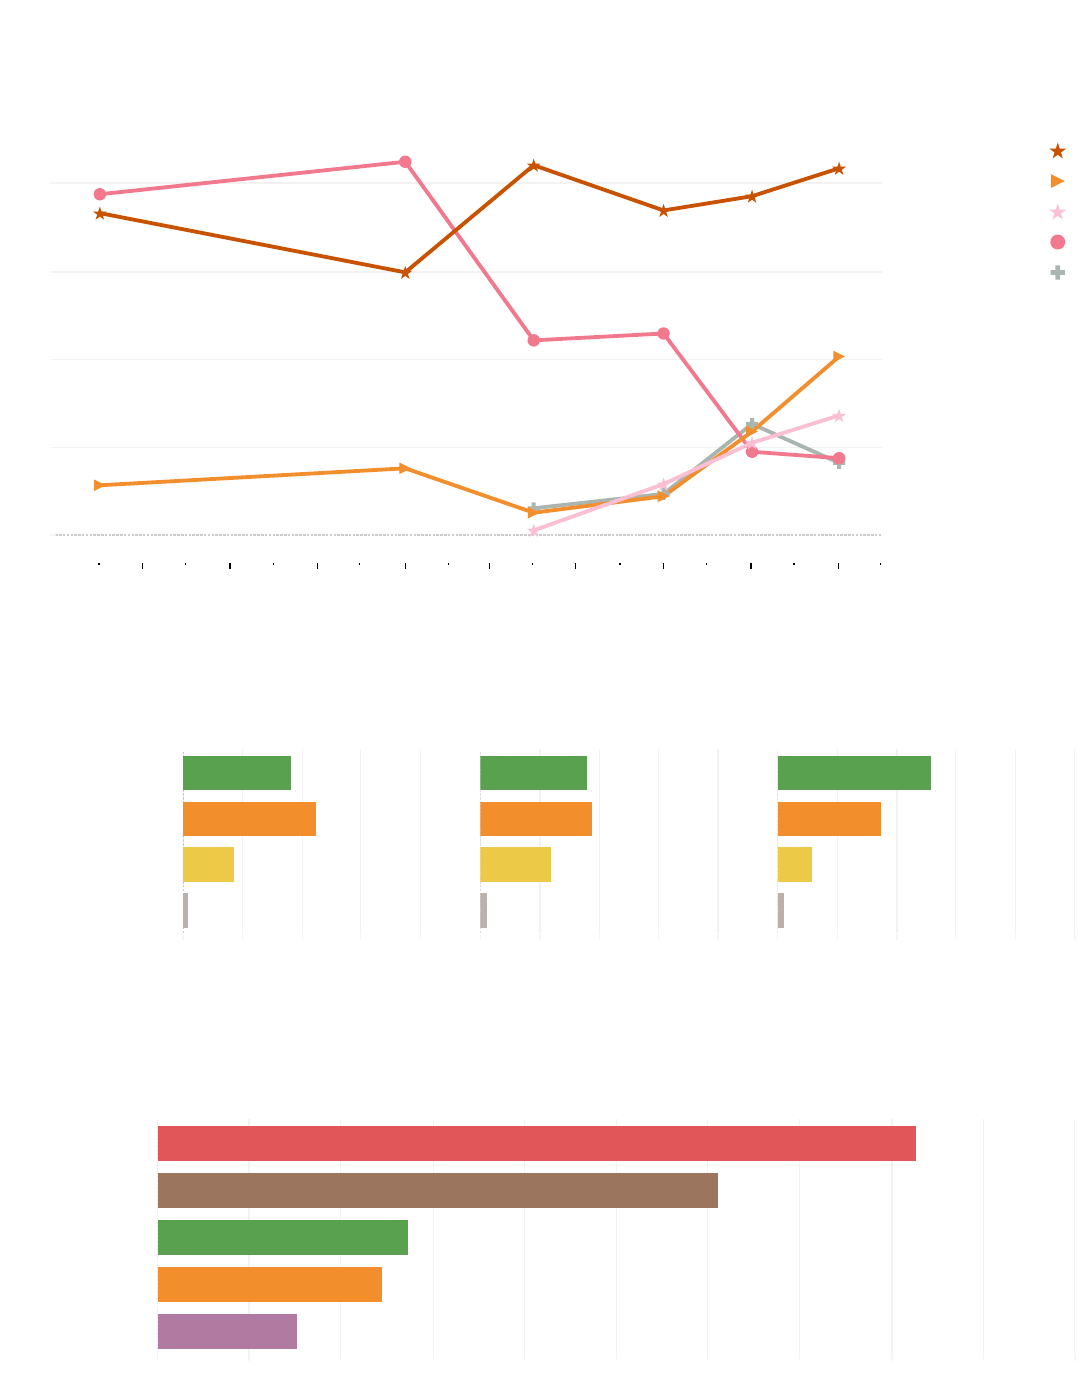
Support for Trump has remained relavely stable since July while support for Haley has increased 8 percentage points since September.
DeSans connues to decline in the eyes of New Hampshire Republicans. He led the GOP field with 43% in January, but has dropped to
9%.
Likely voters are solidifying their choices: more than half (52%) of likely 2024 Republican primary voters say they have definitely decided
who they will vote for, up from 36% in September. Thirty-five percent say they are currently leaning towards someone and only 12% say
they are sll trying to decide.
First Choice GOP 2024 Presidenal Candidate - Likely GOP Primary Voters
Jul 2022 Sep 2022 Nov 2022 Jan 2023 Mar 2023 May 2023 Jul 2023 Sep 2023 Nov 2023
0%
10%
20%
30%
40%
13%
10%
12%
23%
22%
8%
20%
43%
6%
37%
39%
6%
37%
30%
8%
5%
1%
9%
39%
42%
14%
3%
42%
Donald Trump
Nikki Haley
Chris Christie
Ron DeSantis
Vivek Ramaswamy
Trump's support is secure as most of his supporters (83%) say they have definitely decided to support him. A majority of Ramaswamy
supporters (61%) say they have definitely decided to support him. Supporters of other leading candidates are far less certain: only 27% of
Haley supporters, 25% of Chrise supporters, and 15% of DeSans supporters say that they have definitely decided who to support.
July 2023 September 2023 November 2023
0% 20% 40% 60% 80% 0% 20% 40% 60% 80% 0% 20% 40% 60% 80%
Definitely decided
Leaning to someone
Still trying to decide
Don't know/Not sure
36%
45%
17%
2%
36%
38%
24%
2%
52%
35%
12%
2%
Definitely Decided on 2024 GOP Presidenal Primary Nominee Choice - Likely GOP Primary Voters
0% 10% 20% 30% 40% 50% 60% 70% 80% 90% 100%
Donald Trump
Vivek Ramaswamy
Nikki Haley
Chris Christie
Ron DeSantis
83%
61%
27%
25%
15%
Definitely Decided on 2024 GOP Presidenal Primary Nominee Choice - Likely GOP Primary Voters - By First Choice GOP 2024
Primary Candidate - November 2023
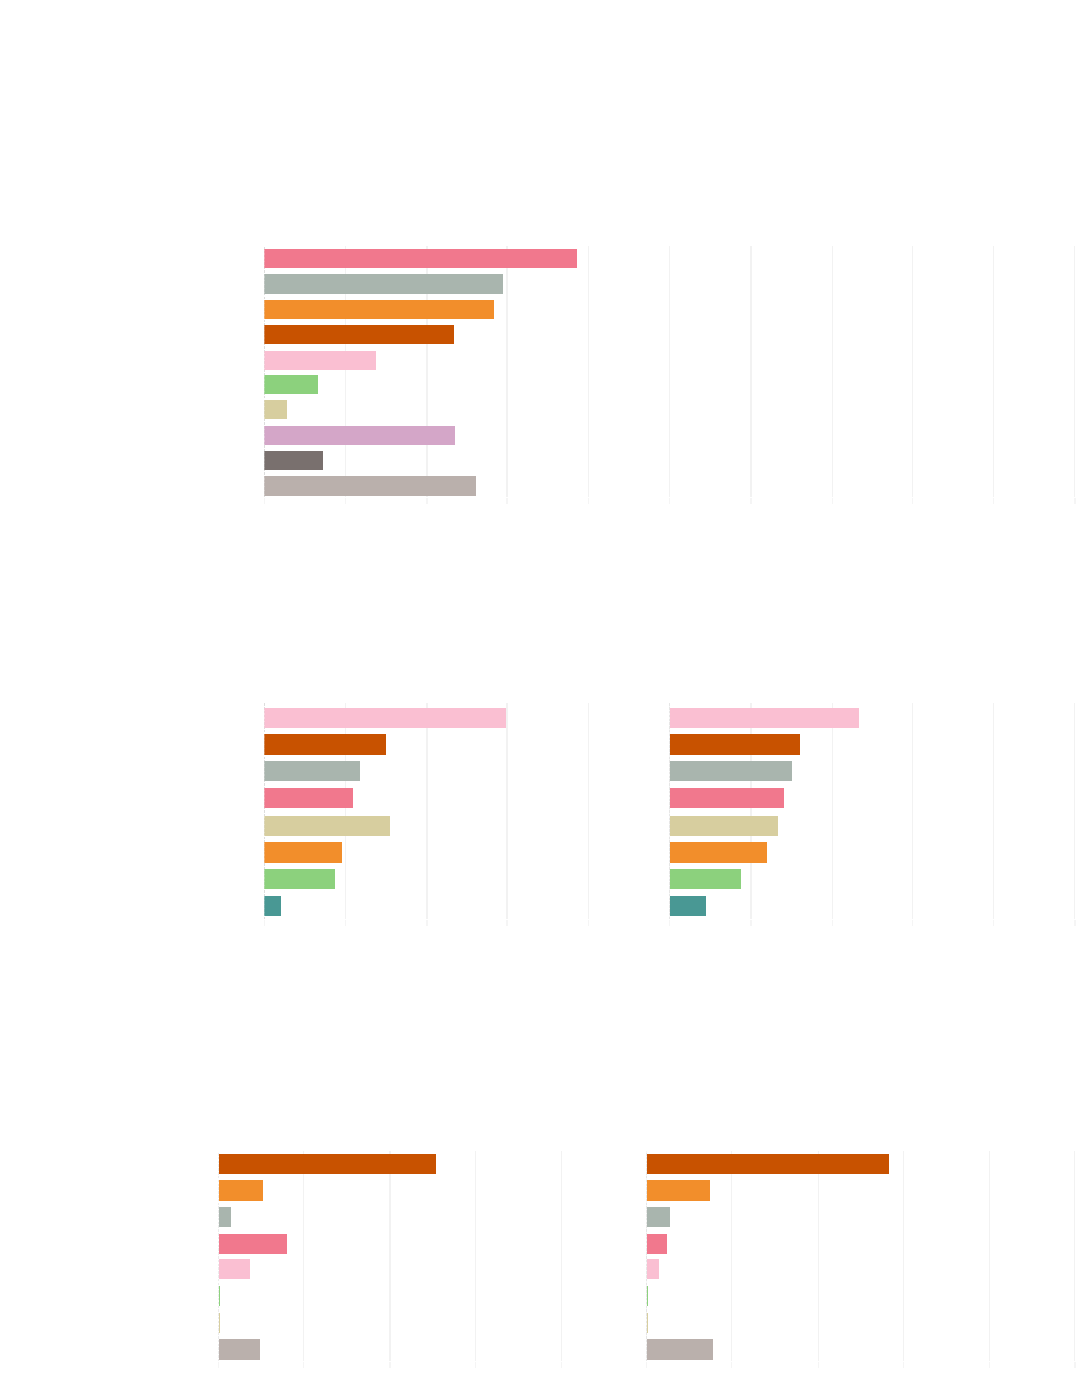
Despite half of voters saying they have definitely decided who they will vote for, most do have a second choice for the GOP nominaon.
When asked which candidate is their second choice, 19% of likely New Hampshire Republican primary voters choose DeSans, followed
by Ramaswamy (15%), Haley (14%), and Trump (12%).
Among Trump supporters, most name Ramaswamy (31%) or DeSans (29%) as their second choice. Haley and Chrise supporters most
oen select the other candidate (28% of Haley voters choose Chrise, 58% of Chrise voters select Haley) as their second choice, most
Ramaswamy supporters name Trump (39%) or DeSans (34%) as their second choice, and half (50%) of DeSans voters say that Trump is
their second choice.
Second Choice GOP 2024 Presidenal Candidate - Likely GOP Primary Voters - November 2023
0% 5% 10% 15% 20% 25% 30% 35% 40% 45% 50%
Ron DeSantis
Vivek Ramaswamy
Nikki Haley
Donald Trump
Chris Christie
Doug Burgum
Asa Hutchinson
Other
Would not vote/No second choice
Don't know/Not sure
19%
15%
14%
12%
7%
3%
1%
12%
4%
13%
September 2023 November 2023
0% 20% 40% 60% 80% 100% 0% 20% 40% 60% 80% 100%
Chris Christie
Donald Trump
Vivek Ramaswamy
Ron DeSantis
Asa Hutchinson
Nikki Haley
Doug Burgum
None, would vote for all
60%
30%
24%
22%
31%
19%
18%
4%
47%
32%
30%
28%
27%
24%
18%
9%
One way to understand the likelihood that a candidate may gain support is to understand how unpopular they are among voters. Nearly
half (47%) of likely Republican primary voters say they would not vote for Chrise under any circumstances, down from 60% in
September, while between one-quarter and one-third would not vote for Trump (32%), Ramaswamy (30%), DeSans (28%), or
Hutchinson (27%) under any circumstances.
2024 GOP Presidenal Candidates Would Not Vote for Under Any Circumstances (Select all that apply) - Likely GOP Primary Voters
Ulmately, choosing a candidate in a primary elecon means making a decision about which one can win in the general elecon. More
than half (57%) of likely 2024 New Hampshire Republican primary voters think that Trump has the best chance to win the 2024
presidenal general elecon, followed distantly by Haley (15%). Nearly all (98%) Trump supporters and a majority of Ramaswamy
supporters (59%) think their preferred candidate has the best chance of winning the general elecon, but only 48% of Haley supporters
and 20% of Chrise supporters think they have the best chance of winning the general elecon.
Best Chance to Win 2024 Presidenal General Elecon - Likely GOP Primary Voters
September 2023 November 2023
0% 20% 40% 60% 80% 100% 0% 20% 40% 60% 80% 100%
Donald Trump
Nikki Haley
Vivek Ramaswamy
Ron DeSantis
Chris Christie
Doug Burgum
Asa Hutchinson
Don't know/Not sure
51%
10%
3%
16%
7%
0%
0%
10%
57%
15%
5%
5%
3%
0%
0%
15%
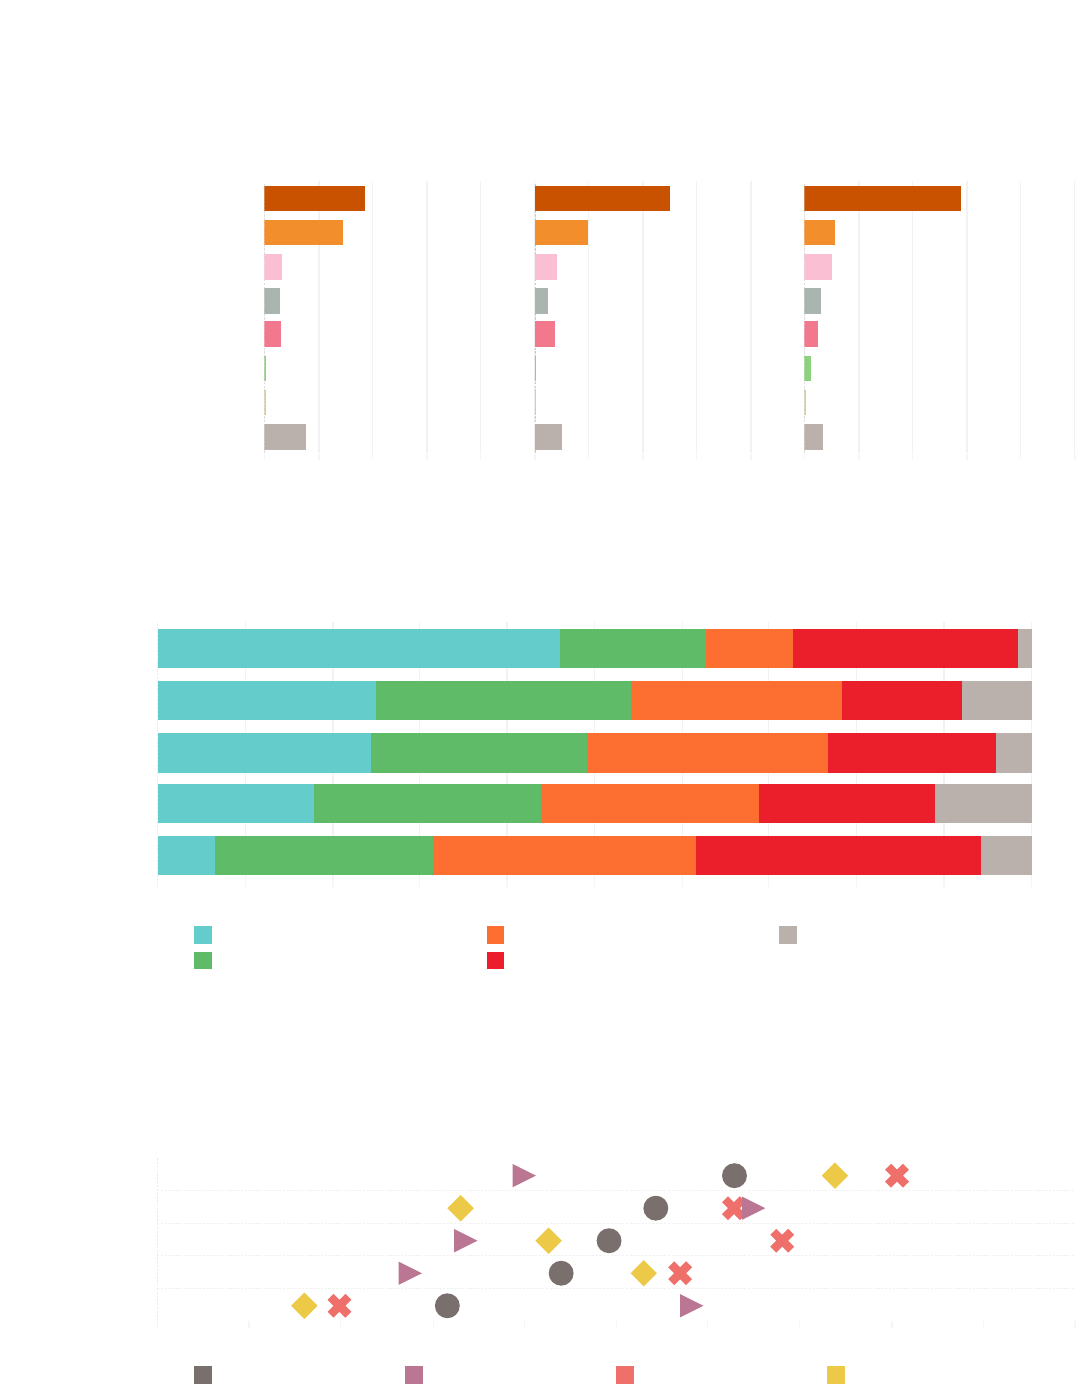
A majority of likely GOP primary voters say that among all primary candidates they trust Trump the most to handle the economy (58%)
and half trust Trump most to handle the war in Gaza (50%). Trump holds a smaller lead when asked who would best handle aboron
policies: 37% say they trust Trump the most to handle policies in this area but 29% trust Haley most. Among female likely GOP primary
voters, 36% trust Trump most on aboron policy while 35% trust Haley most.
Forty-six percent of likely GOP primary voters say they would be enthusiasc if Trump were the GOP nominee, while 26% would be
angry. Far fewer likely primary voters would be enthusiasc if Haley (25%), DeSans (24%), or Ramaswamy (18%) were the nominee,
while a plurality (33%) would be angry if Chrise were the nominee.
Candidate Trust Most to Handle Policies Concerning Following - Among Likely GOP Primary Voters - November 2023
Abortion Gaza War The Economy
0% 20% 40% 60% 80% 0% 20% 40% 60% 80% 0% 20% 40% 60% 80%
Donald Trump
Nikki Haley
Chris Christie
Vivek Ramaswamy
Ron DeSantis
Doug Burgum
Asa Hutchinson
Don't know/Not sure
37%
29%
15%
7%
5%
6%
0%
0%
50%
20%
10%
8%
5%
7%
0%
0%
58%
11%
10%
6%
5%
2%
1%
7%
Feelings if Following Candidates Were Republican Nominee - Likely GOP Primary Voters - November 2023
0% 10% 20% 30% 40% 50% 60% 70% 80% 90% 100%
Donald Trump
Nikki Haley
Ron DeSantis
Vivek Ramaswamy
Chris Christie
26%10%17%46%
14%24%29%25% 8%
19%28%25%24% 4%
11%20%25%26%18%
33%30%25% 6%6%
Enthusiastic
Satisfied
Dissatisfied
Angry
Don't know/Not sure
0% 10% 20% 30% 40% 50% 60% 70% 80% 90% 100%
Donald Trump
Nikki Haley
Ron DeSantis
Vivek Ramaswamy
Chris Christie
63%
54%
49%
44%
32%
40%
65%
34%
27%
58%
81%
68%
57%
20%
74%
33%
Enthusiasc or Sasfied if Following Candidates Were 2024 GOP Presidenal Nominee - By Ideology - November 2023
Most self-described libertarians and conservaves would be enthusiasc or sasfied if Trump were the 2024 GOP nominee, but less than
half of moderates say they would feel that way. Most moderates and conservaves would be enthusiasc or sasfied if Haley were the
nominee, but few libertarians would feel that way. Most conservaves would be enthusiasc or sasfied with DeSans as the nominee
and most moderates would be enthusiasc or sasfied with Chrise as the nominee but few outside those groups would be enthusiasc
or sasfied with either candidate.
OVERALL Moderate Conservative Libertarian

Awareness of GOP Candidates
Among likely 2024 Republican New Hampshire presidenal primary voters, Trump is now the most popular candidate: 51% of likely
Republican primary voters have a favorable opinion of Trump, 34% have an unfavorable opinion of him, and 15% are neutral. Trump's net
favorability rang (the percentage who have a favorable opinion minus the percentage with an unfavorable opinion) is +17, unchanged
since September (+19). Haley (+10) is viewed somewhat favorably while likely GOP primary voters are divided in their assessments of
DeSans (-1), Ramaswamy (-9), and Burgum (-11), while Hutchinson (-31) and Chrise (-43) are viewed unfavorably.
Since September, the net favorability rangs for Trump and Haley are largely unchanged, while the net favorability of Ramaswamy (-21)
and DeSans (-13) have fallen since then. Haley is most popular among local NH news viewers, Fox News, CNN, and MSNBC viewers,
while Trump is most popular among X (formerly Twier) users, conservave radio listeners, Newsmax viewers, and Joe Rogan listeners.
CNN viewers and NHPR listeners are largely neutral on Chrise but he is extremely unpopular among Joe Rogan listeners, Newsmax
viewers, and conservave radio listeners.
0% 10% 20% 30% 40% 50% 60% 70% 80% 90% 100%
Donald Trump
Nikki Haley
Ron DeSantis
Vivek Ramaswamy
Chris Christie
Doug Burgum
Asa Hutchinson
34%15%51%
32%20%42% 6%
39%22%38%
40%23%30% 7%
60%20%17% 3%
30%24%34%12%
29%38%26%7%
Favorable
Neutral
Unfavorable
Don't know enough about to say
Favorability - 2024 Republican Candidates - Among Likely GOP Primary Voters - November 2023
-80% -60% -40% -20% 0% 20% 40% 60% 80% 100%
Donald Trump
Nikki Haley
Ron DeSantis
Vivek Ramaswamy
Doug Burgum
Asa Hutchinson
Chris Christie
-43%
-31%
-11%
-9%
-1%
+10%
+17%
Net Favorability - 2024 Republican Candidates - Among Likely GOP Primary Voters - November 2023
0% 50% 100%
30%
29%
0%
6%
1%
7%
3%
% Don't know enough to say
Jan 2023 Mar 2023 May 2023 Jul 2023 Sep 2023 Nov 2023
-100%
-50%
0%
50%
100%
-11%
-59%
-43%
-18%
-31%
+6%
+23%
-9%
+55%
-1%
+12%
+10%
+17%
+17%
Donald Trump
Nikki Haley
Ron DeSantis
Vivek Ramaswamy
Doug Burgum
Asa Hutchinson
Chris Christie
Net Favorability - 2024 Republican Candidates
Assessment of Trump
When asked what, if anything, is their biggest concern about Trump as the 2024 Republican nominee, likely GOP primary voters most
oen menon aacks by Trump's opponents or the media (14%), Trump's ability to win a general elecon (9%), indictments or
imprisonment (8%), being divisive or unpopular (7%), or being bombasc (6%), while 16% say they have no concerns. Trump supporters
are more likely to say they are concerned about potenal voter fraud by Trump's opponents (11%) or to have no concerns (37%).
Rangs of Donald Trump's Aributes - Likely GOP Primary Voters - November 2023
Biggest Concern if Trump is 2024 GOP Nominee (coded) - Likely GOP Primary Voters
September 2023 November 2023
0% 10% 20% 30% 40% 50% 0% 10% 20% 30% 40% 50%
Attacks by opponents or media
Ability to win general election
Indictments or imprisonment
Divisive or unpopular
Will undermine/destroy democracy
Bombastic
Result in election fraud
General character concerns
Incompetence
Dishonesty
Narcissistic or self-obsessed
Chaos or drama
Do not want as president
Potential violence against him
Everything
Personal retribution during second term
Baggage
Age
Corrupt personality
Other
None
17%
13%
8%
6%
3%
8%
6%
4%
0%
4%
3%
1%
2%
4%
1%
0%
2%
1%
1%
6%
9%
14%
9%
8%
7%
6%
6%
4%
4%
3%
3%
3%
2%
2%
2%
1%
1%
0%
0%
0%
7%
16%
Respondents were asked to rate Trump across various aributes. Likely Republican primary voters are generally posive in their
assessment of Trump's policy posions, decision-making, and physical and mental fitness, but less than half rate him as very good or
good on honesty and integrity (47%) or temperament (40%). Trump supporters are unsurprisingly quite posive in their assessment of
Trump, but only 37% rate his temperament as very good, far lower than the percentage who rate his other aributes as very good.
0% 10% 20% 30% 40% 50% 60% 70% 80% 90% 100%
Policy positions on major issues
Decision-making
Physical and mental fitness
Ability to understand the
problems facing people like you
Communication skills
Honesty and integrity
Temperament
17%20%47% 5%9%
20%23%43% 8%7%
17%12%20%43% 7%
23%10%18%42% 6%
19%11%16%18%36%
28%18%18%28% 8%
30%13%19%21%16%
Very good
Good
Fair
Poor
Very poor
Don't know/Not sure

0% 10% 20% 30% 40% 50% 60% 70% 80% 90% 100%
Returning federal spending to pre-COVID-19
levels
Making drug traffickers, smugglers, and drug
dealers eligible for the death penalty
Banning any Gaza refugees from coming to
the United States
Stopping all military funding support for
Ukraine
Ending birthright citizenship
Passing a law banning abortion nationwide
after 15 weeks
10%12%16%53% 4%4%
11%11%20%50% 9%
13%12%12%16%45%
21%17%10%19%32%
19%12%16%13%34% 7%
26%12%14%17%30%
Support Policies Proposed by Some 2024 GOP Presidenal Candidates - Among Likely GOP Primary Voters - November 2023
Strongly support
Somewhat support
Neutral
Somewhat oppose
Strongly oppose
Don't know/Not sure
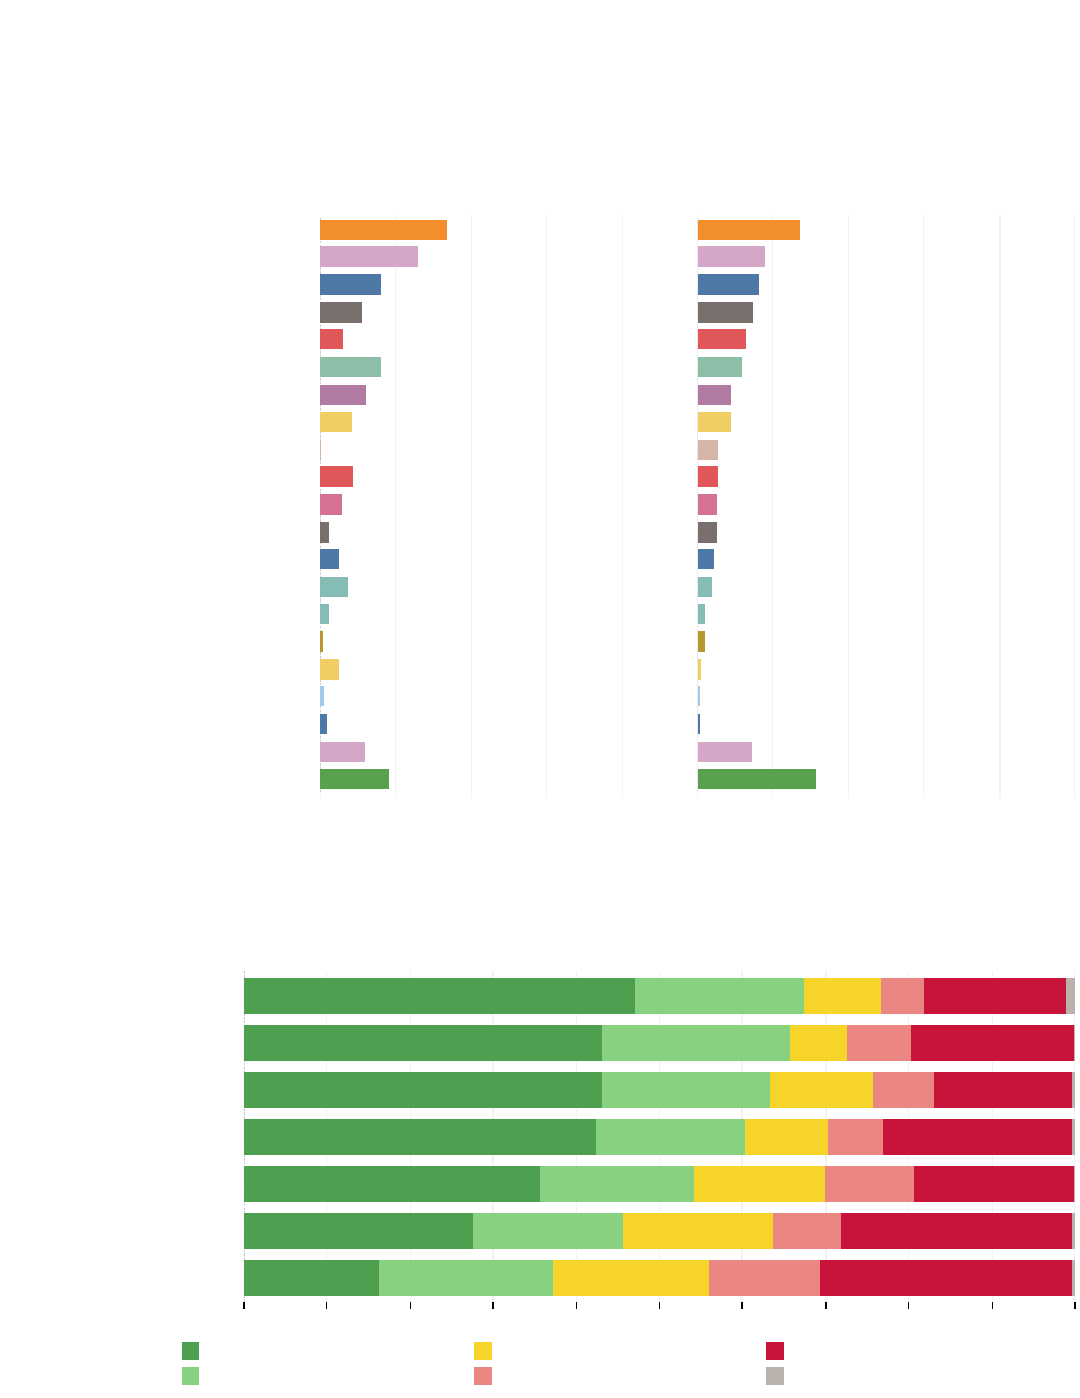
Likely 2024 Republican primary voters were asked whether they support or oppose several policies which have been proposed by one or
more Republican presidenal candidates. Majories strongly or somewhat support returning federal spending to pre-COVID-19 levels
(69%), making drug traffickers, smugglers, and drug dealers eligible for the death penalty (69%), and banning Gaza refugees from coming
to the United States (61%). Half (50%) support stopping all military funding support for Ukraine while slightly fewer support ending
birthright cizenship (47%) and passing a law banning aboron naonwide aer 15 weeks (47%). Support for banning aboron
naonwide aer 15 weeks, returning federal spending to pre-COVID-19 levels, and stopping all military funding for Ukraine has declined
slightly since September.
Majories of Trump voters support each of these policies, while less than half of Chrise voters support each one. A majority of Haley
voters support returning federal spending to pre-COVID-19 levels and making drug traffickers, smugglers, and drug dealers eligible for the
death penalty, but less than half support the other proposed policies.
Issues in GOP Primary
Majories of likely Republican primary voters menon jobs or the economy (78%), foreign policy (57%), and the border or immigraon
(54%) as among their top three most important issues when deciding on a candidate. Compared to September, likely GOP primary voters
are much more likely to menon foreign policy and somewhat more likely to menon jobs or the economy or aboron.
Three Most Important Issues in Deciding Candidate to Support - Likely GOP Primary Voters - November 2023
Darkest color=Most important, Second darkest=Second most important, Third darkest=Third most important
September 2023 November 2023
0% 20% 40% 60% 80% 100% 0% 20% 40% 60% 80% 100%
Jobs/Economy
Foreign policy
Border/Immigration
Abortion
Taxes, budget, or debt
Energy
Cost of living
Crime or drugs
Education
Not Trump
Protecting democracy or Constitution
Healthcare
Other
62%
28%
66%
11%
15%
17%
10%
69%
4%
8%
5%
2%
2%
10%14%39%
11%12%
19%28%19%
30%22%17%
9%
7%
78%
57%
54%
15%
35%
9%
9%
8%
8%
8%
8%
6%
5%
16%22%40%
22%20%15%
11%25%18%
20%
6%
7%8%
Interacon with November Republican Primary Debate - Likely GOP Primary Voters - November 2023
0% 5% 10% 15% 20% 25% 30% 35% 40% 45% 50%
I watched all of the debate
I watched most of the debate
I did not watch much of the debate, but I paid close
attention to news stories about it afterwards
I neither watched the debate nor paid attention to
news stories about it
Don't know/Can't remember
12%
15%
33%
39%
1%
Republican Primary Debates
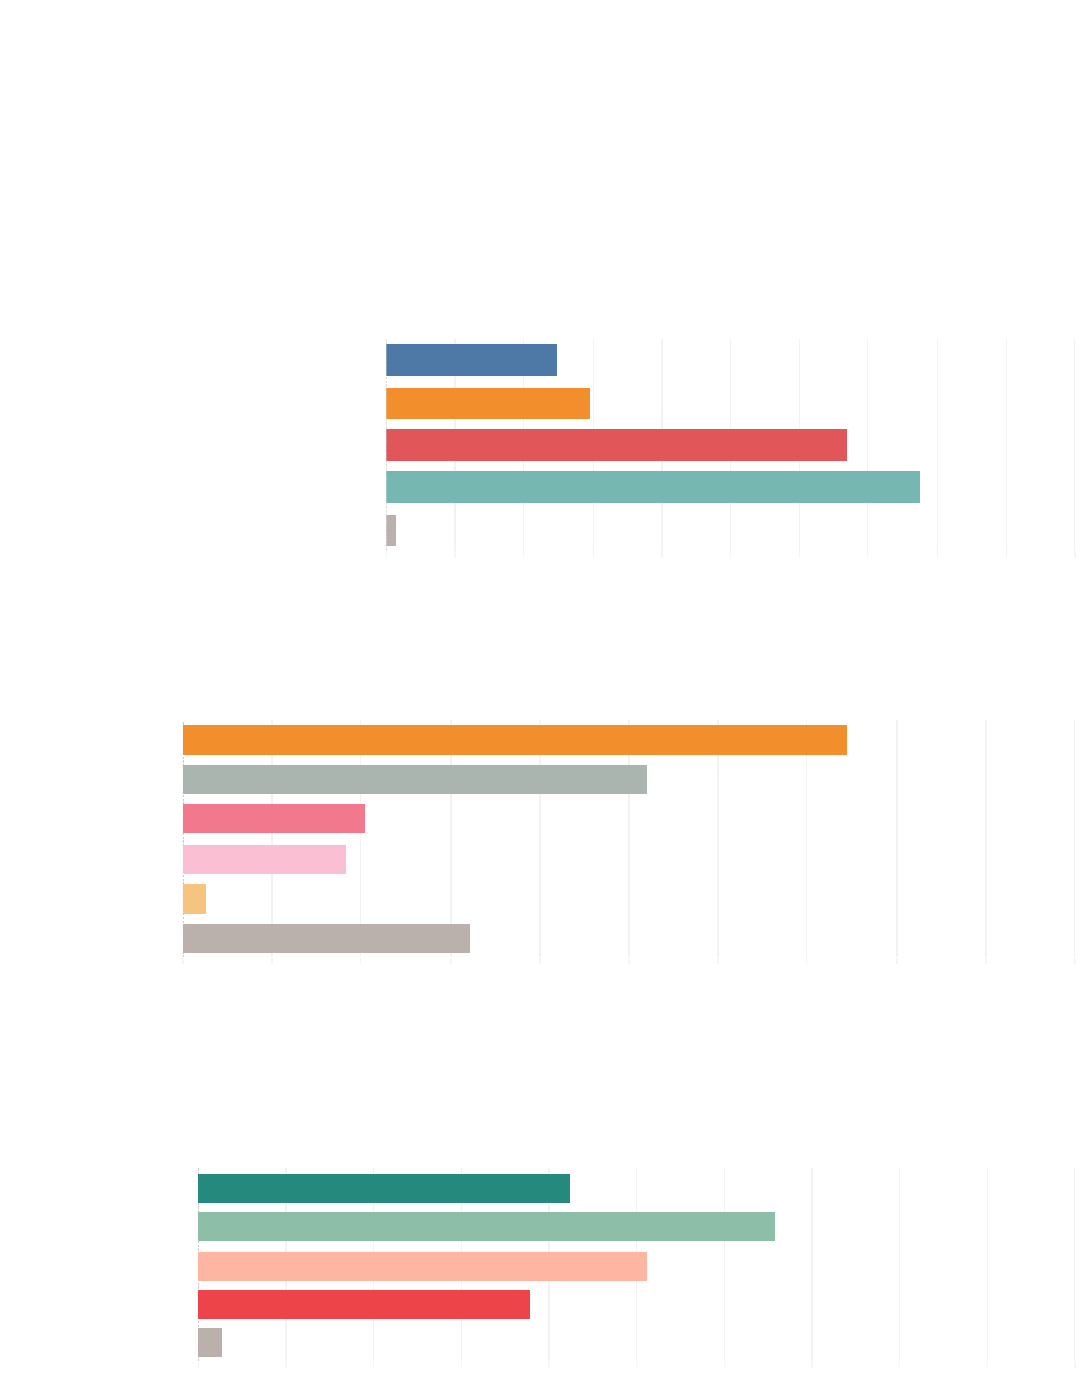
Five Republican primary candidates met for a debate in Miami, Florida on November 8th. However, relavely few likely Republican
primary voters in New Hampshire were watching: only 12% say that they watched all of the debate, 15% watched most of it, 33% did not
watch much of it but paid close aenon to news stories about it aerwards, and 39% neither watched the debate nor paid aenon to
news stories about it. Former President Trump qualified for the debate but chose not to parcipate. Perhaps unsurprisingly, only half
(50%) of Trump supporters watched any of the debate or paid aenon to news arcles about it, while seven in ten (71%) supporters of
other Republican candidates watched the debate or paid aenon to news arcles about it.
Likely GOP primary voters are split on whether they would have liked to see Trump parcipate in the debate: 45% wish he had done so
while 47% did not want him to parcipate. Only 26% of Trump supporters would have liked him to parcipate, while 60% of non-Trump
supporters would have liked that.
Who Believe Won November Republican Primary Debate - Likely GOP Primary Voters - November 2023
0% 5% 10% 15% 20% 25% 30% 35% 40% 45% 50%
Nikki Haley
Vivek Ramaswamy
Ron DeSantis
Chris Christie
Tim Scott
Don't know/Not sure
37%
26%
10%
9%
1%
16%
Among those who watched the debate or paid close aenon to news stories about it (N=575), 37% believe that Nikki Haley won the
debate, 26% feel that Ramaswamy won, 10% feel that DeSans won, 9% feel that Chrise won, and 1% feel that Tim Sco won the
debate.
Interest in Further Republican Primary Debates - Likely GOP Primary Voters - November 2023
0% 5% 10% 15% 20% 25% 30% 35% 40% 45% 50%
Very interested
Somewhat interested
Not very interested
Not at all interested
Don't know/Not sure
21%
33%
26%
19%
1%
Some Republicans have called for the Republican Naonal Commiee (RNC) not to hold any further debates. Just over half (54%) of likely
Republican primary voters say that they are very (21%) or somewhat (33%) interested in further Republican primary debates, 26% are
not very interested, and 19% are not at all interested. Nearly two-thirds (65%) of likely Republican primary voters who do not support
Trump are very or somewhat interested in further debates, but only 38% of Trump supporters are very or somewhat interested in further
debates.
Polical Engagement
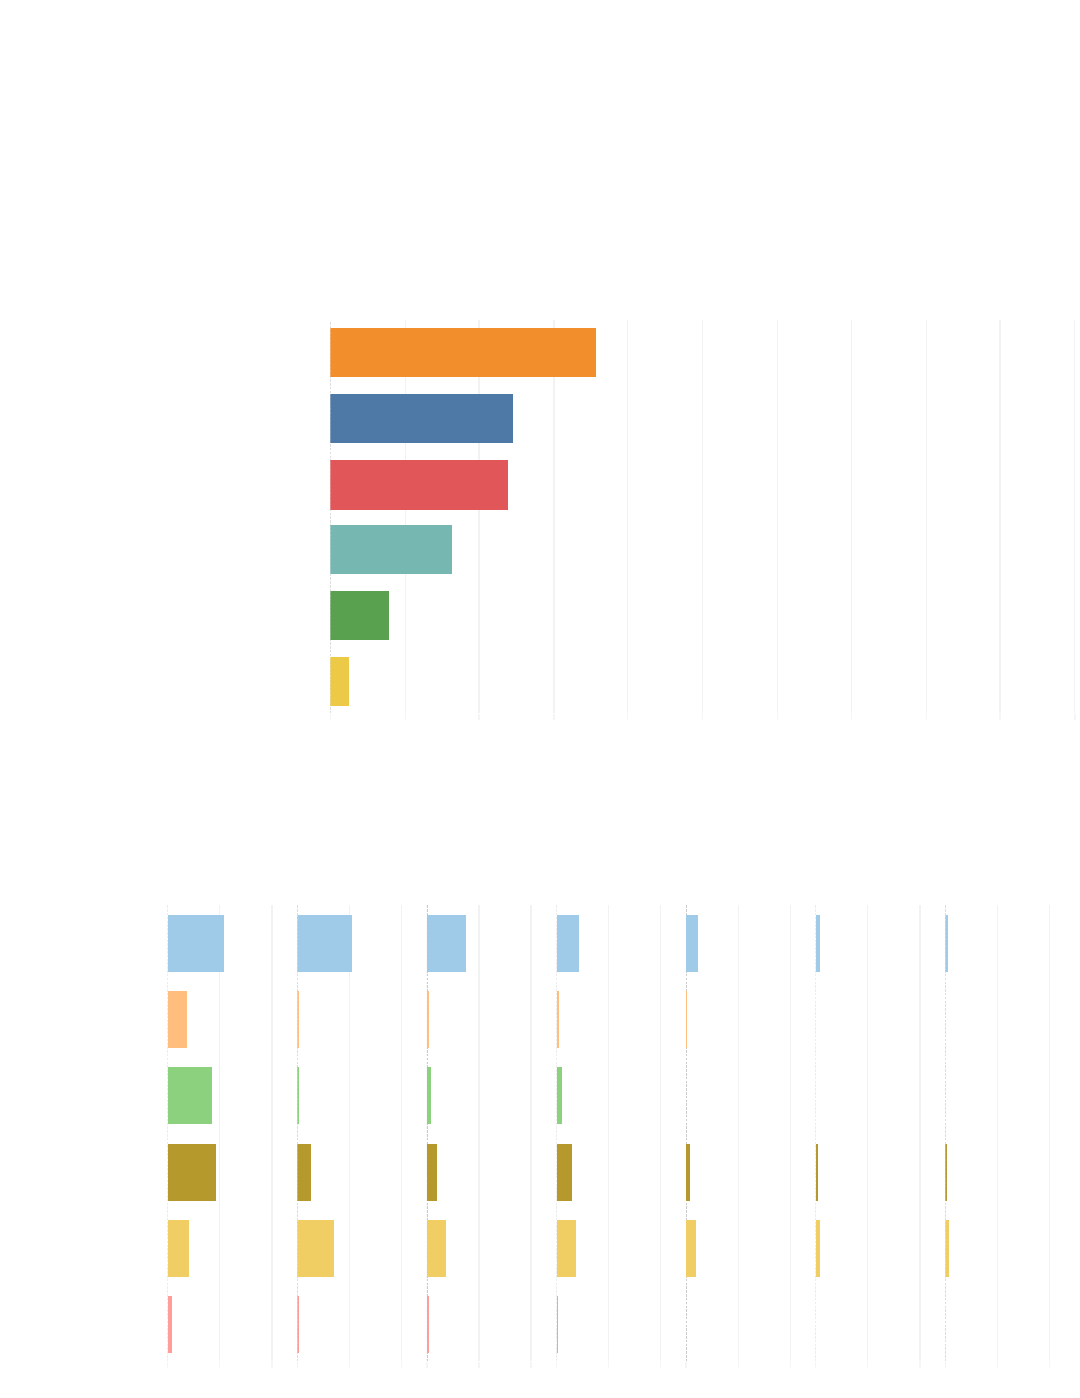
Despite having greater access to candidates in New Hampshire than in other primary states, very few GOP primary voters have taken the
opportunity to aend a campaign event, let alone meet one of the candidates. Among likely Republican primary voters, 18% say that
they have aended at least one event featuring a 2024 presidenal candidate, 12% say they have donated to a presidenal candidate,
and another 12% say they have met a presidenal candidate. Eight percent say that they put a sign of a 2024 presidenal candidate on
their yard or elsewhere on their property, 4% put a candidate's bumper scker on their car or personal item, and only 1% have
volunteered for a presidenal candidate. Libertarians are more likely than others to say that they have aended an event featuring a
presidenal candidate while conservaves are more likely to have donated to a candidate. Younger people are more likely to have
aended an event or met a candidate, while older people are more likely to have donated money to a candidate or put a sign on their
property.
Polical Acvies Engaged in Over Past Year - Likely GOP Primary Voters - November 2023
0% 5% 10% 15% 20% 25% 30% 35% 40% 45% 50%
Attended an event featuring a 2024
presidential candidate
Donated to a 2024 presidential candidate
Met a 2024 presidential candidate
Put a sign of a 2024 presidential candidate
on your yard or elsewhere on your property
Put a bumper sticker of a 2024 presidential
candidate on your car or personal item
Volunteered for a 2024 presidential
candidate
18%
12%
12%
8%
4%
1%
Polical Acvies Engaged in Over Past Year - Likely GOP Primary Voters - By Candidate - November 2023
Trump Ramaswamy DeSantis Haley Christie Burgum Hutchinson
0% 10% 20% 0% 10% 20% 0% 10% 20% 0% 10% 20% 0% 10% 20% 0% 10% 20% 0% 10% 20%
Attended an event
Displayed bumper
sticker
Displayed sign
Donated to
Met
Volunteered for
11%
4%
9%
9%
4%
1%
10%
0%
0%
3%
7%
0%
8%
0%
1%
2%
4%
0%
4%
1%
1%
3%
4%
0%
2%
0%
1%
2%
1%
0%
1%
1%
0%
1%
Respondents are most likely to report having aended an event for Trump (11%) or Ramaswamy (10%), while they are about equally
likely to have met Trump, Ramaswamy, DeSans, and Haley. Respondents indicate that they have donated money to or displayed a sign
for Trump more than any other candidate.

CNN New Hampshire Primary Poll Methodology
These findings are based on the latest CNN New Hampshire Primary Poll, conducted by the University of New Hampshire Survey Center.
One thousand, nine hundred and forty-six (1,946) Granite State Panel members completed the survey online between November 10
and November 14, 2023. The margin of sampling error for the survey is +/- 2.2 percent. Included in the sample were 994 likely 2024
Republican Primary voters (margin of sampling error +/- 3.1 percent). There were 841 unweighted likely Republican Primary voters. In
addion to potenal sampling error, all surveys have other potenal sources of non-sampling error including queson order effects,
queson wording effects, and non-response. These MSE's have not been adjusted for design effect. The response rate for this CNN New
Hampshire Primary Poll is 36%. The design effect for the survey is 2.2%.
The Granite State Panel is a probability-based web panel of New Hampshire residents. Approximately 6,500 New Hampshire adults have
been recruited from phone, text-to-web, or mail-to-web surveys sent to randomly-selected phone numbers or addresses. Panelists are
then asked to parcipate in online surveys sponsored by the UNH Survey Center.
Data were weighted by respondent sex, age, educaon, and region of the state to targets from the most recent American Community
Survey (ACS) conducted by the U.S. Census Bureau, as well as party registraon levels provided by the NH Secretary of State and to
2020 elecon results in New Hampshire. Surveys were taken in English, all respondent data included passes Qualtrics data quality
checks, and single-use survey links were used to prevent mulple submissions by respondents. The number of respondents in each
demographic below may not equal the number reported in cross-tabulaon tables as some respondents choose not to answer some
quesons. Due to rounding, percentages may not sum to 100%. All coding of open-ended responses is conducted by human coders.
For more informaon about the methodology used in this CNN New Hampshire Primary Poll, contact Dr. Andrew Smith at (603)
862-2226 or by email at andrew.smith@unh.edu.
% N
Gender of
Respondent
Men
Women
Age of
Respondent
18 to 34
35 to 49
50 to 64
65 and older
Level of
Education
High school or less
Tech school/Some college
College graduate
Postgraduate work
Region of
State
Central/Lakes
Connecticut Valley
Manchester Area
Mass Border
North Country
Seacoast
Party ID
Democrat
Independent
Republican
Voting
Registration
Registered Democrat
Registered Undeclared/Not Reg.
Registered Republican
2020 Pres
Vote
Voted for Trump
Voted for Biden
Voted for other 2020 candidate
Did not vote in 2020
Preferred
Candidate
Not Trump primary supporter
Trump primary supporter
996
905
52%
48%
488
616
385
450
25%
32%
20%
23%
296
468
593
585
15%
24%
31%
30%
394
184
424
318
257
361
20%
10%
22%
16%
13%
19%
774
235
922
40%
12%
48%
548
715
620
29%
38%
33%
48
33
1,053
810
2%
2%
54%
42%
398
535
43%
57%
All Respondents
September 2023 CNN New Hampshire Primary Poll Demographics
% N
431
517
45%
55%
251
359
182
153
27%
38%
19%
16%
124
197
273
355
13%
21%
29%
37%
160
91
219
151
134
191
17%
10%
23%
16%
14%
20%
706
125
116
75%
13%
12%
539
410
57%
43%
16
13
187
734
2%
1%
20%
77%
Likely GOP Primary Voters

Doug Burgum Chris Christie Ron DeSantis Nikki Haley Asa Hutchinson
STATEWIDE November 2023
2%
14%
9%
20%
0%
Voting
Registration
Registered Republican
Registered Undeclared/Not Reg.
Party ID
Independent/Democrat
Republican
Political
Ideology
Moderate
Conservative
Libertarian
Age of
Respondent
18 to 34
35 to 49
50 to 64
65 and older
Gender of
Respondent
Men
Women
Level of
Education
High school or less
Tech school/Some college
College graduate
Postgraduate work
College
Degree
College graduate
Not college graduate
Region of
State
Central/Lakes
Connecticut Valley
Manchester Area
Mass Border
North Country
Seacoast
Household
Income
Less than $45,000
$45,000 - $74,999
$75,000 - $99,999
$100,000 - $149,999
$150,000 or more
Media Usage
CNN viewer
Conservative radio listener
Epoch Times reader
Fox News viewer
Joe Rogan listener
Local NH news viewer
Newsmax viewer
NHPR listener
X (formerly Twitter) user
2020 Pres
Vote
Voted for Biden
Voted for Trump
1%
2%
24%
6%
5%
11%
25%
17%
1%
0%
1%
2%
6%
37%
12%
1%
18%
28%
0%
1%
1%
1%
2%
1%
1%
33%
18%
11%
3%
8%
14%
35%
1%
3%
1%
1%
1%
12%
18%
16%
4%
6%
12%
8%
7%
22%
24%
12%
17%
1%
0%
0%
1%
2%
14%
14%
9%
9%
22%
19%
0%
0%
3%
2%
0%
2%
20%
20%
12%
10%
10%
9%
5%
11%
32%
22%
21%
16%
1%
1%
0%
1%
3%
11%
20%
8%
9%
18%
26%
0%
1%
6%
1%
2%
0%
0%
23%
7%
18%
16%
6%
7%
4%
7%
19%
2%
14%
3%
20%
24%
20%
15%
10%
31%
0%
0%
1%
0%
0%
1%
0%
2%
6%
15%
16%
15%
6%
20%
19%
3%
0%
6%
12%
20%
29%
27%
15%
5%
0%
0%
0%
0%
1%
1%
2%
0%
1%
1%
1%
1%
1%
13%
30%
3%
20%
1%
3%
0%
3%
37%
8%
12%
4%
12%
5%
10%
10%
15%
6%
12%
31%
8%
29%
3%
24%
3%
7%
37%
0%
1%
0%
0%
0%
1%
2%
3%
56%
10%
1%
17%
34%
0%
1%
If the 2024 New Hampshire presidential primary were held today, who would you support for the Republican nomination?
First Choice GOP 2024 Presidenal Candidate - Likely GOP Primary Voters

Vivek Ramaswamy Donald Trump Other Don't know/Not sure
STATEWIDE November 2023
8%
42%
3%
2%
N
951
Voting
Registration
Registered Republican
Registered Undeclared/Not Reg.
Party ID
Independent/Democrat
Republican
Political
Ideology
Moderate
Conservative
Libertarian
Age of
Respondent
18 to 34
35 to 49
50 to 64
65 and older
Gender of
Respondent
Men
Women
Level of
Education
High school or less
Tech school/Some college
College graduate
Postgraduate work
College
Degree
College graduate
Not college graduate
Region of
State
Central/Lakes
Connecticut Valley
Manchester Area
Mass Border
North Country
Seacoast
Household
Income
Less than $45,000
$45,000 - $74,999
$75,000 - $99,999
$100,000 - $149,999
$150,000 or more
Media Usage
CNN viewer
Conservative radio listener
Epoch Times reader
Fox News viewer
Joe Rogan listener
Local NH news viewer
Newsmax viewer
NHPR listener
X (formerly Twitter) user
2020 Pres
Vote
Voted for Biden
Voted for Trump
15%
3%
24%
55%
2%
4%
3%
1%
5%
18%
54%
7%
3%
3%
2%
3%
25%
5%
1%
44%
61%
18%
1%
3%
4%
1%
2%
2%
2%
2%
10%
29%
45%
38%
48%
39%
7%
2%
3%
2%
2%
2%
2%
7%
9%
43%
41%
3%
3%
1%
3%
4%
7%
14%
7%
24%
32%
44%
52%
1%
4%
3%
3%
6%
4%
1%
10%
5%
48%
29%
3%
3%
1%
5%
5%
2%
3%
5%
34%
2%
37%
57%
33%
51%
34%
48%
2%
1%
2%
6%
1%
6%
2%
1%
2%
4%
1%
2%
6%
4%
15%
15%
3%
35%
41%
37%
44%
60%
1%
4%
3%
7%
3%
3%
1%
1%
14%
5%
4%
4%
33%
6%
19%
8%
2%
48%
13%
80%
29%
56%
51%
65%
62%
11%
1%
4%
1%
4%
1%
3%
2%
4%
5%
2%
3%
0%
2%
2%
3%
0%
1%
1%
10%
54%
0%
3%
3%
2%
2%
409
539
706
241
139
436
260
251
359
182
153
430
517
124
196
273
355
628
320
159
91
219
151
134
191
180
160
184
174
84
225
202
174
570
160
320
126
223
162
734
187
If the 2024 New Hampshire presidential primary were held today, who would you support for the Republican nomination?
First Choice GOP 2024 Presidenal Candidate - Likely GOP Primary Voters

Definitely decided Leaning to someone Still trying to decide Don't know/Not sure
STATEWIDE November 2023
52%
35%
12%
2%
N
933
Voting
Registration
Registered Republican
Registered Undeclared/Not Reg.
Party ID
Independent/Democrat
Republican
Political
Ideology
Moderate
Conservative
Libertarian
Age of
Respondent
18 to 34
35 to 49
50 to 64
65 and older
Gender of
Respondent
Men
Women
Level of
Education
High school or less
Tech school/Some college
College graduate
Postgraduate work
College
Degree
College graduate
Not college graduate
Region of
State
Central/Lakes
Connecticut Valley
Manchester Area
Mass Border
North Country
Seacoast
Household
Income
Less than $45,000
$45,000 - $74,999
$75,000 - $99,999
$100,000 - $149,999
$150,000 or more
Media Usage
CNN viewer
Conservative radio listener
Epoch Times reader
Fox News viewer
Joe Rogan listener
Local NH news viewer
Newsmax viewer
NHPR listener
X (formerly Twitter) user
2020 Pres
Vote
Voted for Biden
Voted for Trump
Preferred
Candidate
Trump primary supporter
Not Trump primary supporter
42%
59%
36%
34%
20%
6%
2%
2%
54%
43%
34%
38%
11%
15%
1%
4%
62%
60%
34%
35%
29%
47%
3%
11%
19%
0%
0%
46%
50%
55%
61%
42%
36%
30%
23%
9%
14%
12%
12%
3%
0%
2%
4%
47%
55%
33%
36%
15%
9%
4%
0%
41%
42%
53%
58%
39%
40%
35%
31%
19%
13%
12%
9%
1%
5%
0%
2%
56%
42%
32%
39%
10%
15%
1%
4%
44%
42%
40%
64%
72%
53%
42%
38%
45%
30%
22%
29%
14%
18%
14%
5%
5%
12%
1%
1%
1%
1%
7%
49%
50%
57%
49%
58%
40%
30%
27%
31%
32%
9%
17%
14%
16%
9%
2%
3%
1%
4%
0%
61%
36%
80%
37%
79%
58%
76%
63%
41%
32%
49%
16%
46%
14%
36%
17%
30%
46%
7%
14%
3%
15%
7%
5%
7%
7%
12%
0%
2%
0%
2%
0%
1%
60%
26%
30%
47%
8%
22%
1%
6%
29%
83%
52%
11%
17%
5%
2%
2%
398
532
695
234
138
427
254
247
351
179
151
425
504
116
189
269
355
624
305
156
91
214
145
133
188
174
156
182
173
84
221
195
173
561
158
312
126
220
160
719
184
535
398
Have you definitely decided who you will vote for in the New Hampshire Primary, are you leaning towards someone, or have you considered some
candidates but are still trying to decide?
Definitely Decided on 2024 GOP Presidenal Primary Nominee Choice - Likely GOP Primary Voters

Doug Burgum Chris Christie Ron DeSantis Nikki Haley
Asa
Hutchinson
Vivek
Ramaswamy
STATEWIDE November 2023
3%
7%
19%
14%
1%
15%
Voting
Registration
Registered Republican
Registered Undeclared/Not Reg.
Party ID
Independent/Democrat
Republican
Political
Ideology
Moderate
Conservative
Libertarian
Age of
Respondent
18 to 34
35 to 49
50 to 64
65 and older
Gender of
Respondent
Men
Women
Level of
Education
High school or less
Tech school/Some college
College graduate
Postgraduate work
College
Degree
College graduate
Not college graduate
Region of
State
Central/Lakes
Connecticut Valley
Manchester Area
Mass Border
North Country
Seacoast
Household
Income
Less than $45,000
$45,000 - $74,999
$75,000 - $99,999
$100,000 - $149,999
$150,000 or more
Media Usage
CNN viewer
Conservative radio listener
Epoch Times reader
Fox News viewer
Joe Rogan listener
Local NH news viewer
Newsmax viewer
NHPR listener
X (formerly Twitter) user
2020 Pres
Vote
Voted for Biden
Voted for Trump
Preferred
Candidate
Trump primary supporter
Not Trump primary supporter
2%
5%
10%
4%
12%
25%
22%
8%
3%
0%
7%
20%
4%
2%
4%
14%
23%
10%
12%
21%
0%
5%
18%
5%
2%
5%
3%
4%
3%
13%
13%
27%
10%
11%
11%
19%
3%
17%
17%
16%
4%
4%
2%
2%
7%
7%
7%
6%
30%
15%
18%
13%
15%
17%
11%
11%
3%
1%
0%
2%
5%
13%
22%
27%
4%
3%
6%
7%
16%
22%
13%
15%
1%
2%
10%
19%
4%
1%
2%
5%
19%
8%
9%
1%
9%
14%
18%
26%
17%
18%
12%
13%
4%
2%
1%
0%
16%
14%
13%
16%
4%
2%
4%
12%
23%
12%
13%
17%
1%
3%
15%
15%
11%
1%
1%
4%
1%
2%
7%
6%
9%
6%
4%
8%
20%
21%
18%
10%
22%
25%
21%
5%
16%
15%
18%
7%
1%
3%
2%
1%
0%
1%
11%
8%
15%
31%
4%
16%
1%
6%
8%
1%
1%
10%
8%
7%
7%
3%
18%
14%
15%
41%
11%
14%
16%
19%
5%
20%
1%
3%
2%
1%
0%
18%
16%
17%
6%
27%
1%
4%
0%
5%
4%
3%
8%
5%
17%
2%
9%
3%
7%
1%
1%
20%
26%
9%
28%
19%
27%
27%
34%
28%
5%
13%
29%
7%
17%
3%
15%
4%
17%
24%
1%
4%
2%
0%
0%
2%
27%
5%
25%
13%
27%
19%
37%
30%
11%
3%
3%
4%
19%
25%
1%
8%
35%
7%
19%
1%
6%
11%
1%
13%
28%
18%
9%
2%
3%
30%
If your preferred candidate were not running, who would you support for the 2024 Republican nomination?
Second Choice GOP 2024 Presidenal Candidate - Likely GOP Primary Voters

Donald Trump Other
Would not vote/No
second choice
Don't know/Not sure
STATEWIDE November 2023
12%
12%
4%
13%
N
933
Voting
Registration
Registered Republican
Registered Undeclared/Not Reg.
Party ID
Independent/Democrat
Republican
Political
Ideology
Moderate
Conservative
Libertarian
Age of
Respondent
18 to 34
35 to 49
50 to 64
65 and older
Gender of
Respondent
Men
Women
Level of
Education
High school or less
Tech school/Some college
College graduate
Postgraduate work
College
Degree
College graduate
Not college graduate
Region of
State
Central/Lakes
Connecticut Valley
Manchester Area
Mass Border
North Country
Seacoast
Household
Income
Less than $45,000
$45,000 - $74,999
$75,000 - $99,999
$100,000 - $149,999
$150,000 or more
Media Usage
CNN viewer
Conservative radio listener
Epoch Times reader
Fox News viewer
Joe Rogan listener
Local NH news viewer
Newsmax viewer
NHPR listener
X (formerly Twitter) user
2020 Pres
Vote
Voted for Biden
Voted for Trump
Preferred
Candidate
Trump primary supporter
Not Trump primary supporter
10%
13%
10%
13%
5%
3%
18%
9%
13%
9%
13%
7%
2%
8%
11%
18%
19%
12%
11%
27%
7%
10%
3%
4%
6%
15%
10%
8%
15%
9%
15%
12%
10%
17%
7%
3%
3%
7%
2%
11%
16%
6%
16%
14%
10%
12%
11%
4%
4%
21%
7%
10%
9%
14%
12%
9%
16%
8%
14%
5%
5%
5%
2%
7%
13%
20%
10%
13%
9%
11%
13%
3%
5%
14%
11%
15%
8%
16%
3%
20%
6%
5%
8%
7%
20%
28%
8%
1%
8%
7%
3%
1%
2%
8%
32%
8%
6%
3%
26%
19%
5%
15%
10%
4%
11%
8%
7%
9%
15%
2%
7%
4%
1%
9%
6%
18%
5%
18%
9%
10%
3%
5%
12%
18%
9%
9%
8%
6%
7%
9%
21%
9%
17%
12%
3%
7%
10%
3%
8%
4%
1%
1%
1%
1%
1%
8%
8%
13%
9%
13%
3%
7%
11%
7%
7%
15%
0%
13%
5%
2%
11%
11%
18%
20%
9%
15%
4%
4%
13%
14%
398
532
695
234
138
427
254
246
351
179
151
425
504
116
189
269
355
624
305
156
91
214
145
133
188
174
156
182
173
84
221
195
173
561
158
312
126
220
160
719
184
535
398
If your preferred candidate were not running, who would you support for the 2024 Republican nomination?
Second Choice GOP 2024 Presidenal Candidate - Likely GOP Primary Voters

Doug Burgum Chris Christie Ron DeSantis Nikki Haley Asa Hutchinson
STATEWIDE November 2023
18%
47%
28%
24%
27%
Voting
Registration
Registered Republican
Registered Undeclared/Not Reg.
Party ID
Independent/Democrat
Republican
Political
Ideology
Moderate
Conservative
Libertarian
Age of
Respondent
18 to 34
35 to 49
50 to 64
65 and older
Gender of
Respondent
Men
Women
Level of
Education
High school or less
Tech school/Some college
College graduate
Postgraduate work
College
Degree
College graduate
Not college graduate
Region of
State
Central/Lakes
Connecticut Valley
Manchester Area
Mass Border
North Country
Seacoast
Household
Income
Less than $45,000
$45,000 - $74,999
$75,000 - $99,999
$100,000 - $149,999
$150,000 or more
Media Usage
CNN viewer
Conservative radio listener
Epoch Times reader
Fox News viewer
Joe Rogan listener
Local NH news viewer
Newsmax viewer
NHPR listener
X (formerly Twitter) user
2020 Pres
Vote
Voted for Biden
Voted for Trump
Preferred
Candidate
Trump primary supporter
Not Trump primary supporter
20%
16%
34%
56%
34%
24%
24%
25%
22%
31%
16%
23%
57%
16%
20%
51%
22%
29%
29%
21%
21%
15%
12%
42%
65%
23%
32%
15%
39%
44%
18%
22%
34%
31%
13%
19%
15%
14%
28%
54%
46%
53%
28%
21%
28%
42%
24%
19%
16%
28%
49%
30%
25%
26%
25%
14%
21%
39%
53%
31%
26%
23%
26%
19%
33%
24%
23%
22%
9%
37%
44%
49%
50%
48%
31%
30%
18%
14%
27%
29%
23%
29%
28%
32%
21%
15%
24%
50%
41%
23%
38%
25%
22%
26%
28%
18%
21%
16%
15%
31%
11%
48%
39%
44%
44%
44%
55%
42%
20%
26%
24%
35%
21%
10%
23%
24%
21%
36%
31%
29%
26%
33%
21%
33%
19%
24%
14%
11%
24%
19%
46%
40%
42%
62%
58%
27%
29%
31%
17%
28%
20%
15%
40%
29%
24%
35%
19%
22%
39%
23%
29%
17%
22%
17%
25%
18%
31%
18%
18%
55%
25%
72%
36%
62%
54%
73%
75%
20%
29%
51%
32%
32%
23%
16%
11%
12%
50%
34%
12%
32%
14%
56%
12%
50%
31%
10%
39%
19%
51%
23%
34%
39%
46%
43%
24%
19%
14%
60%
2%
19%
65%
29%
9%
32%
10%
15%
22%
27%
75%
34%
20%
16%
37%
19%
38%
Which of the candidates running for the Republican nomination would you not vote for under any circumstances? (Please select all that apply)
2024 GOP Presidenal Candidates Would Not Vote for Under Any Circumstances (Select all that apply) - Likely GOP Primary Voters

Vivek Ramaswamy Donald Trump None, would vote for all
STATEWIDE November 2023
30%
32%
9%
N
925
Voting
Registration
Registered Republican
Registered Undeclared/Not Reg.
Party ID
Independent/Democrat
Republican
Political
Ideology
Moderate
Conservative
Libertarian
Age of
Respondent
18 to 34
35 to 49
50 to 64
65 and older
Gender of
Respondent
Men
Women
Level of
Education
High school or less
Tech school/Some college
College graduate
Postgraduate work
College
Degree
College graduate
Not college graduate
Region of
State
Central/Lakes
Connecticut Valley
Manchester Area
Mass Border
North Country
Seacoast
Household
Income
Less than $45,000
$45,000 - $74,999
$75,000 - $99,999
$100,000 - $149,999
$150,000 or more
Media Usage
CNN viewer
Conservative radio listener
Epoch Times reader
Fox News viewer
Joe Rogan listener
Local NH news viewer
Newsmax viewer
NHPR listener
X (formerly Twitter) user
2020 Pres
Vote
Voted for Biden
Voted for Trump
Preferred
Candidate
Trump primary supporter
Not Trump primary supporter
36%
26%
50%
19%
4%
13%
24%
49%
19%
71%
12%
2%
18%
18%
47%
25%
13%
55%
0%
16%
6%
35%
33%
26%
23%
30%
37%
27%
34%
6%
12%
5%
14%
32%
28%
34%
31%
8%
10%
50%
37%
29%
20%
56%
39%
30%
21%
3%
5%
7%
16%
24%
42%
25%
46%
12%
4%
35%
30%
39%
21%
21%
30%
37%
35%
39%
29%
27%
26%
6%
9%
14%
19%
0%
5%
33%
27%
32%
27%
28%
35%
34%
35%
25%
32%
14%
18%
7%
7%
26%
56%
13%
37%
6%
25%
21%
14%
54%
26%
68%
7%
42%
7%
18%
7%
12%
66%
10%
5%
4%
14%
3%
18%
20%
10%
10%
21%
69%
13%
97%
12%
0%
41%
15%
53%
2%
11%
6%
398
524
682
239
139
412
257
249
345
182
142
405
515
123
196
259
344
603
319
159
69
216
149
134
191
180
160
184
163
83
225
199
173
567
160
319
126
222
161
710
185
533
374
Which of the candidates running for the Republican nomination would you not vote for under any circumstances? (Please select all that apply)
2024 GOP Presidenal Candidates Would Not Vote for Under Any Circumstances (Select all that apply) - Likely GOP Primary Voters

Doug Burgum Chris Christie Ron DeSantis Nikki Haley Asa Hutchinson
STATEWIDE November 2023
0%
3%
5%
15%
0%
Voting
Registration
Registered Republican
Registered Undeclared/Not Reg.
Party ID
Independent/Democrat
Republican
Political
Ideology
Moderate
Conservative
Libertarian
Age of
Respondent
18 to 34
35 to 49
50 to 64
65 and older
Gender of
Respondent
Men
Women
Level of
Education
High school or less
Tech school/Some college
College graduate
Postgraduate work
College
Degree
College graduate
Not college graduate
Region of
State
Central/Lakes
Connecticut Valley
Manchester Area
Mass Border
North Country
Seacoast
Household
Income
Less than $45,000
$45,000 - $74,999
$75,000 - $99,999
$100,000 - $149,999
$150,000 or more
Media Usage
CNN viewer
Conservative radio listener
Epoch Times reader
Fox News viewer
Joe Rogan listener
Local NH news viewer
Newsmax viewer
NHPR listener
X (formerly Twitter) user
2020 Pres
Vote
Voted for Biden
Voted for Trump
Preferred
Candidate
Trump primary supporter
Not Trump primary supporter
0%
6%
1%
4%
5%
18%
12%
0%
0%
1%
9%
6%
0%
11%
27%
0%
0%
0%
6%
16%
4%
2%
5%
8%
30%
0%
1%
3%
3%
4%
1%
4%
5%
5%
6%
19%
16%
12%
8%
0%
0%
0%
2%
3%
2%
6%
12%
17%
0%
0%
1%
6%
6%
2%
6%
6%
3%
5%
26%
20%
17%
6%
0%
0%
0%
1%
6%
4%
6%
11%
22%
0%
0%
1%
3%
2%
4%
5%
1%
1%
2%
4%
8%
2%
10%
3%
16%
8%
24%
13%
10%
13%
0%
0%
1%
6%
3%
2%
3%
2%
3%
4%
1%
4%
9%
18%
21%
16%
11%
6%
0%
0%
2%
7%
0%
4%
1%
1%
1%
0%
9%
5%
11%
2%
6%
1%
7%
3%
11%
5%
9%
30%
7%
21%
4%
17%
2%
7%
40%
0%
0%
0%
0%
0%
13%
5%
1%
10%
33%
0%
0%
5%
8%
0%
25%
1%
0%
Which of the candidates running for the Republican nomination for president do you think has the best chance of winning a general election?
Best Chance to Win 2024 Presidenal General Elecon - Likely GOP Primary Voters

Vivek Ramaswamy Donald Trump Don't know/Not sure
STATEWIDE November 2023
5%
57%
15%
N
942
Voting
Registration
Registered Republican
Registered Undeclared/Not Reg.
Party ID
Independent/Democrat
Republican
Political
Ideology
Moderate
Conservative
Libertarian
Age of
Respondent
18 to 34
35 to 49
50 to 64
65 and older
Gender of
Respondent
Men
Women
Level of
Education
High school or less
Tech school/Some college
College graduate
Postgraduate work
College
Degree
College graduate
Not college graduate
Region of
State
Central/Lakes
Connecticut Valley
Manchester Area
Mass Border
North Country
Seacoast
Household
Income
Less than $45,000
$45,000 - $74,999
$75,000 - $99,999
$100,000 - $149,999
$150,000 or more
Media Usage
CNN viewer
Conservative radio listener
Epoch Times reader
Fox News viewer
Joe Rogan listener
Local NH news viewer
Newsmax viewer
NHPR listener
X (formerly Twitter) user
2020 Pres
Vote
Voted for Biden
Voted for Trump
Preferred
Candidate
Trump primary supporter
Not Trump primary supporter
12%
1%
40%
69%
20%
12%
1%
17%
68%
23%
13%
23%
18%
1%
1%
57%
75%
37%
4%
12%
24%
0%
6%
25%
59%
54%
62%
52%
15%
22%
11%
7%
5%
6%
57%
57%
22%
10%
1%
5%
7%
6%
46%
48%
60%
63%
15%
14%
10%
21%
6%
4%
61%
48%
16%
14%
1%
2%
3%
29%
1%
63%
80%
41%
67%
43%
58%
14%
5%
22%
10%
7%
24%
3%
1%
12%
13%
52%
54%
56%
56%
74%
17%
18%
14%
13%
9%
11%
1%
0%
1%
26%
1%
16%
2%
1%
59%
32%
87%
45%
65%
66%
75%
76%
29%
14%
18%
4%
22%
2%
7%
3%
4%
16%
7%
0%
67%
19%
11%
34%
9%
26%
98%
26%
1%
400
539
705
233
139
433
260
251
350
182
153
424
514
124
196
270
349
619
320
159
91
217
145
134
190
180
158
184
173
78
224
200
174
562
160
318
126
223
156
731
181
527
398
Which of the candidates running for the Republican nomination for president do you think has the best chance of winning a general election?
Best Chance to Win 2024 Presidenal General Elecon - Likely GOP Primary Voters

Doug Burgum Chris Christie Ron DeSantis Nikki Haley Asa Hutchinson
STATEWIDE November 2023
0%
7%
6%
29%
0%
Voting
Registration
Registered Republican
Registered Undeclared/Not Reg.
Party ID
Independent/Democrat
Republican
Political
Ideology
Moderate
Conservative
Libertarian
Age of
Respondent
18 to 34
35 to 49
50 to 64
65 and older
Gender of
Respondent
Men
Women
Level of
Education
High school or less
Tech school/Some college
College graduate
Postgraduate work
College
Degree
College graduate
Not college graduate
Region of
State
Central/Lakes
Connecticut Valley
Manchester Area
Mass Border
North Country
Seacoast
Household
Income
Less than $45,000
$45,000 - $74,999
$75,000 - $99,999
$100,000 - $149,999
$150,000 or more
Media Usage
CNN viewer
Conservative radio listener
Epoch Times reader
Fox News viewer
Joe Rogan listener
Local NH news viewer
Newsmax viewer
NHPR listener
X (formerly Twitter) user
2020 Pres
Vote
Voted for Biden
Voted for Trump
Preferred
Candidate
Trump primary supporter
Not Trump primary supporter
0%
14%
2%
6%
6%
31%
28%
0%
0%
0%
2%
20%
8%
2%
30%
27%
0%
0%
0%
5%
1%
15%
15%
7%
1%
6%
28%
44%
1%
0%
8%
7%
8%
3%
6%
3%
9%
10%
36%
40%
14%
11%
0%
0%
0%
6%
7%
4%
7%
35%
25%
0%
0%
0%
10%
11%
9%
2%
10%
9%
3%
5%
37%
24%
25%
33%
1%
0%
0%
5%
11%
4%
9%
30%
29%
0%
0%
0%
0%
7%
12%
7%
7%
5%
5%
3%
2%
6%
1%
15%
6%
35%
30%
40%
21%
10%
33%
0%
1%
0%
0%
0%
9%
6%
8%
7%
6%
5%
8%
2%
5%
2%
38%
29%
32%
23%
14%
0%
0%
0%
0%
0%
0%
0%
7%
21%
0%
10%
0%
3%
0%
3%
21%
9%
6%
7%
6%
6%
4%
9%
12%
0%
17%
29%
16%
41%
5%
34%
9%
13%
40%
0%
0%
0%
0%
0%
1%
30%
6%
1%
29%
34%
0%
0%
0%
12%
0%
7%
4%
46%
6%
0%
And which of the candidates running for the Republican nomination for president do you most trust to handle policies concerning abortion?
Candidate Trust Most to Handle Policies Concerning Aboron - Likely GOP Primary Voters

Vivek Ramaswamy Donald Trump Don't know/Not sure
STATEWIDE November 2023
5%
37%
15%
N
876
Voting
Registration
Registered Republican
Registered Undeclared/Not Reg.
Party ID
Independent/Democrat
Republican
Political
Ideology
Moderate
Conservative
Libertarian
Age of
Respondent
18 to 34
35 to 49
50 to 64
65 and older
Gender of
Respondent
Men
Women
Level of
Education
High school or less
Tech school/Some college
College graduate
Postgraduate work
College
Degree
College graduate
Not college graduate
Region of
State
Central/Lakes
Connecticut Valley
Manchester Area
Mass Border
North Country
Seacoast
Household
Income
Less than $45,000
$45,000 - $74,999
$75,000 - $99,999
$100,000 - $149,999
$150,000 or more
Media Usage
CNN viewer
Conservative radio listener
Epoch Times reader
Fox News viewer
Joe Rogan listener
Local NH news viewer
Newsmax viewer
NHPR listener
X (formerly Twitter) user
2020 Pres
Vote
Voted for Biden
Voted for Trump
Preferred
Candidate
Trump primary supporter
Not Trump primary supporter
8%
4%
18%
50%
23%
10%
4%
9%
47%
7%
9%
34%
20%
4%
1%
40%
54%
18%
15%
7%
19%
0%
2%
11%
16%
38%
36%
43%
32%
12%
11%
16%
30%
8%
3%
36%
38%
11%
19%
1%
5%
13%
1%
19%
27%
37%
49%
22%
24%
13%
10%
6%
3%
44%
24%
11%
23%
3%
1%
2%
3%
16%
5%
36%
44%
28%
50%
33%
41%
15%
10%
17%
18%
21%
10%
3%
0%
19%
3%
2%
31%
33%
32%
39%
56%
13%
23%
7%
24%
21%
6%
3%
5%
3%
17%
3%
2%
5%
1%
42%
13%
66%
24%
53%
44%
58%
55%
11%
19%
27%
5%
16%
18%
11%
22%
13%
27%
6%
0%
47%
11%
34%
8%
2%
2%
86%
24%
2%
354
520
649
223
134
414
237
234
326
174
137
378
495
118
181
248
327
574
299
155
75
200
138
132
169
175
149
170
149
73
219
194
170
527
158
313
123
216
159
686
163
501
362
And which of the candidates running for the Republican nomination for president do you most trust to handle policies concerning abortion?
Candidate Trust Most to Handle Policies Concerning Aboron - Likely GOP Primary Voters

Doug Burgum Chris Christie Ron DeSantis Nikki Haley Asa Hutchinson
STATEWIDE November 2023
2%
10%
5%
11%
1%
Voting
Registration
Registered Republican
Registered Undeclared/Not Reg.
Party ID
Independent/Democrat
Republican
Political
Ideology
Moderate
Conservative
Libertarian
Age of
Respondent
18 to 34
35 to 49
50 to 64
65 and older
Gender of
Respondent
Men
Women
Level of
Education
High school or less
Tech school/Some college
College graduate
Postgraduate work
College
Degree
College graduate
Not college graduate
Region of
State
Central/Lakes
Connecticut Valley
Manchester Area
Mass Border
North Country
Seacoast
Household
Income
Less than $45,000
$45,000 - $74,999
$75,000 - $99,999
$100,000 - $149,999
$150,000 or more
Media Usage
CNN viewer
Conservative radio listener
Epoch Times reader
Fox News viewer
Joe Rogan listener
Local NH news viewer
Newsmax viewer
NHPR listener
X (formerly Twitter) user
2020 Pres
Vote
Voted for Biden
Voted for Trump
Preferred
Candidate
Trump primary supporter
Not Trump primary supporter
2%
3%
18%
4%
5%
6%
11%
11%
1%
2%
3%
3%
31%
7%
1%
10%
15%
2%
6%
0%
4%
5%
1%
21%
13%
4%
4%
3%
10%
17%
1%
1%
3%
4%
10%
12%
11%
5%
7%
4%
5%
7%
14%
14%
4%
7%
1%
1%
1%
3%
10%
10%
4%
6%
11%
12%
1%
1%
3%
4%
1%
2%
17%
15%
13%
3%
7%
7%
4%
4%
17%
9%
12%
10%
0%
1%
1%
0%
1%
4%
7%
16%
4%
7%
11%
12%
1%
1%
5%
1%
4%
0%
0%
1%
11%
6%
10%
19%
7%
7%
2%
9%
7%
2%
10%
3%
15%
7%
12%
10%
6%
13%
3%
1%
1%
0%
3%
0%
3%
2%
8%
11%
14%
7%
9%
16%
4%
4%
0%
3%
4%
11%
10%
15%
12%
2%
0%
2%
1%
0%
0%
1%
7%
0%
3%
3%
3%
6%
9%
27%
3%
14%
2%
5%
0%
4%
36%
6%
8%
2%
6%
2%
7%
4%
9%
1%
6%
17%
4%
16%
0%
11%
1%
3%
18%
0%
2%
1%
1%
2%
4%
2%
43%
5%
0%
10%
17%
3%
4%
18%
0%
9%
20%
1%
0%
And which of the candidates running for the Republican nomination for president do you most trust to handle policies concerning the economy?
Candidate Trust Most to Handle Policies Concerning the Economy - Likely GOP Primary Voters

Vivek Ramaswamy Donald Trump Don't know/Not sure
STATEWIDE November 2023
6%
58%
7%
N
905
Voting
Registration
Registered Republican
Registered Undeclared/Not Reg.
Party ID
Independent/Democrat
Republican
Political
Ideology
Moderate
Conservative
Libertarian
Age of
Respondent
18 to 34
35 to 49
50 to 64
65 and older
Gender of
Respondent
Men
Women
Level of
Education
High school or less
Tech school/Some college
College graduate
Postgraduate work
College
Degree
College graduate
Not college graduate
Region of
State
Central/Lakes
Connecticut Valley
Manchester Area
Mass Border
North Country
Seacoast
Household
Income
Less than $45,000
$45,000 - $74,999
$75,000 - $99,999
$100,000 - $149,999
$150,000 or more
Media Usage
CNN viewer
Conservative radio listener
Epoch Times reader
Fox News viewer
Joe Rogan listener
Local NH news viewer
Newsmax viewer
NHPR listener
X (formerly Twitter) user
2020 Pres
Vote
Voted for Biden
Voted for Trump
Preferred
Candidate
Trump primary supporter
Not Trump primary supporter
10%
3%
39%
71%
14%
2%
5%
10%
70%
20%
3%
18%
8%
5%
2%
62%
78%
38%
3%
1%
14%
1%
3%
11%
18%
60%
57%
56%
57%
6%
7%
9%
7%
2%
10%
62%
54%
9%
5%
6%
8%
4%
7%
38%
46%
59%
70%
13%
10%
6%
4%
6%
7%
65%
43%
5%
11%
3%
3%
4%
5%
19%
2%
56%
64%
48%
60%
54%
70%
7%
7%
14%
2%
4%
4%
8%
3%
4%
16%
2%
57%
56%
59%
56%
62%
6%
11%
12%
1%
6%
14%
5%
2%
4%
19%
5%
17%
7%
3%
59%
18%
88%
47%
75%
66%
75%
72%
24%
4%
16%
2%
9%
2%
3%
2%
2%
12%
7%
1%
73%
2%
1%
29%
11%
0%
26%
100%
12%
380
523
675
226
139
404
257
233
353
178
135
409
492
120
185
252
344
596
306
150
80
215
139
133
181
179
146
179
153
84
223
194
172
553
159
308
124
215
153
701
175
504
385
And which of the candidates running for the Republican nomination for president do you most trust to handle policies concerning the economy?
Candidate Trust Most to Handle Policies Concerning the Economy - Likely GOP Primary Voters

Doug Burgum Chris Christie Ron DeSantis Nikki Haley Asa Hutchinson
STATEWIDE November 2023
0%
8%
7%
20%
0%
Voting
Registration
Registered Republican
Registered Undeclared/Not Reg.
Party ID
Independent/Democrat
Republican
Political
Ideology
Moderate
Conservative
Libertarian
Age of
Respondent
18 to 34
35 to 49
50 to 64
65 and older
Gender of
Respondent
Men
Women
Level of
Education
High school or less
Tech school/Some college
College graduate
Postgraduate work
College
Degree
College graduate
Not college graduate
Region of
State
Central/Lakes
Connecticut Valley
Manchester Area
Mass Border
North Country
Seacoast
Household
Income
Less than $45,000
$45,000 - $74,999
$75,000 - $99,999
$100,000 - $149,999
$150,000 or more
Media Usage
CNN viewer
Conservative radio listener
Epoch Times reader
Fox News viewer
Joe Rogan listener
Local NH news viewer
Newsmax viewer
NHPR listener
X (formerly Twitter) user
2020 Pres
Vote
Voted for Biden
Voted for Trump
Preferred
Candidate
Trump primary supporter
Not Trump primary supporter
0%
0%
13%
5%
5%
9%
24%
17%
1%
0%
0%
0%
4%
20%
10%
0%
17%
29%
0%
1%
1%
0%
2%
1%
18%
15%
9%
2%
7%
15%
35%
1%
0%
0%
1%
8%
12%
4%
1%
5%
10%
6%
7%
21%
24%
17%
10%
0%
1%
0%
1%
0%
6%
10%
7%
7%
20%
20%
1%
0%
2%
0%
8%
11%
7%
7%
8%
7%
2%
11%
30%
23%
23%
13%
1%
1%
1%
0%
1%
7%
9%
7%
7%
17%
26%
0%
1%
1%
2%
16%
7%
8%
11%
3%
2%
4%
9%
13%
1%
10%
5%
24%
13%
23%
18%
9%
23%
0%
0%
0%
1%
1%
0%
0%
6%
6%
6%
5%
13%
17%
4%
0%
7%
1%
23%
19%
29%
17%
7%
0%
1%
0%
0%
0%
1%
0%
0%
0%
0%
12%
17%
2%
12%
1%
3%
1%
2%
22%
6%
8%
3%
10%
2%
7%
5%
10%
1%
11%
33%
9%
28%
4%
23%
4%
11%
34%
0%
1%
0%
0%
0%
0%
0%
3%
31%
8%
1%
16%
36%
0%
1%
0%
1%
14%
12%
2%
34%
1%
1%
And which of the candidates running for the Republican nomination for president do you most trust to handle policies concerning the War in Gaza
between Israel and Hamas?
Candidate Trust Most to Handle the War in Gaza Between Israel and Hamas - Likely GOP Primary Voters

Vivek Ramaswamy Donald Trump Don't know/Not sure
STATEWIDE November 2023
5%
50%
10%
N
897
Voting
Registration
Registered Republican
Registered Undeclared/Not Reg.
Party ID
Independent/Democrat
Republican
Political
Ideology
Moderate
Conservative
Libertarian
Age of
Respondent
18 to 34
35 to 49
50 to 64
65 and older
Gender of
Respondent
Men
Women
Level of
Education
High school or less
Tech school/Some college
College graduate
Postgraduate work
College
Degree
College graduate
Not college graduate
Region of
State
Central/Lakes
Connecticut Valley
Manchester Area
Mass Border
North Country
Seacoast
Household
Income
Less than $45,000
$45,000 - $74,999
$75,000 - $99,999
$100,000 - $149,999
$150,000 or more
Media Usage
CNN viewer
Conservative radio listener
Epoch Times reader
Fox News viewer
Joe Rogan listener
Local NH news viewer
Newsmax viewer
NHPR listener
X (formerly Twitter) user
2020 Pres
Vote
Voted for Biden
Voted for Trump
Preferred
Candidate
Trump primary supporter
Not Trump primary supporter
11%
0%
29%
64%
17%
5%
2%
13%
62%
14%
6%
22%
21%
1%
4%
51%
67%
27%
3%
7%
12%
1%
1%
5%
23%
57%
46%
52%
45%
8%
8%
14%
13%
7%
3%
46%
53%
12%
8%
1%
8%
10%
31%
37%
49%
65%
20%
14%
9%
5%
4%
5%
58%
34%
6%
16%
0%
0%
2%
9%
17%
2%
45%
64%
41%
50%
55%
56%
11%
5%
12%
9%
6%
12%
3%
1%
13%
1%
12%
42%
42%
45%
64%
57%
8%
27%
6%
6%
9%
3%
1%
0%
1%
16%
1%
1%
1%
1%
64%
18%
83%
37%
74%
61%
86%
69%
21%
4%
21%
2%
12%
3%
6%
3%
6%
21%
5%
0%
63%
0%
5%
29%
6%
3%
18%
92%
16%
2%
364
530
665
227
139
414
246
245
334
178
135
392
501
120
185
252
336
588
305
157
78
205
139
133
178
177
151
169
157
75
224
194
172
540
159
313
124
220
159
702
166
504
376
And which of the candidates running for the Republican nomination for president do you most trust to handle policies concerning the War in Gaza
between Israel and Hamas?
Candidate Trust Most to Handle the War in Gaza Between Israel and Hamas - Likely GOP Primary Voters

Enthusiastic Satisfied Dissatisfied Angry
Don't know/Not
sure
STATEWIDE November 2023
6%
25%
30%
33%
6%
N
933
Voting
Registration
Registered Republican
Registered Undeclared/Not Reg.
Party ID
Independent/Democrat
Republican
Political
Ideology
Moderate
Conservative
Libertarian
Age of
Respondent
18 to 34
35 to 49
50 to 64
65 and older
Gender of
Respondent
Men
Women
Level of
Education
High school or less
Tech school/Some college
College graduate
Postgraduate work
College
Degree
College graduate
Not college graduate
Region of
State
Central/Lakes
Connecticut Valley
Manchester Area
Mass Border
North Country
Seacoast
Household
Income
Less than $45,000
$45,000 - $74,999
$75,000 - $99,999
$100,000 - $149,999
$150,000 or more
Media Usage
CNN viewer
Conservative radio listener
Epoch Times reader
Fox News viewer
Joe Rogan listener
Local NH news viewer
Newsmax viewer
NHPR listener
X (formerly Twitter) user
2020 Pres
Vote
Voted for Biden
Voted for Trump
Preferred
Candidate
Trump primary supporter
Not Trump primary supporter
8%
5%
32%
20%
24%
34%
28%
36%
8%
4%
4%
13%
20%
40%
35%
16%
35%
27%
6%
5%
2%
1%
18%
14%
18%
40%
42%
34%
20%
36%
41%
18%
6%
5%
4%
7%
10%
5%
21%
29%
21%
29%
34%
32%
34%
12%
30%
27%
38%
44%
8%
3%
2%
15%
5%
8%
24%
26%
35%
26%
27%
37%
9%
3%
8%
8%
7%
4%
33%
28%
20%
24%
32%
32%
24%
33%
16%
31%
40%
34%
10%
2%
9%
4%
6%
8%
22%
30%
29%
32%
36%
25%
6%
5%
12%
3%
8%
8%
4%
3%
31%
22%
24%
34%
16%
22%
23%
25%
37%
27%
30%
33%
30%
23%
25%
29%
48%
38%
4%
27%
5%
2%
1%
5%
8%
5%
5%
4%
4%
21%
37%
28%
20%
13%
33%
32%
25%
27%
35%
34%
21%
40%
36%
44%
4%
5%
3%
13%
3%
9%
13%
2%
9%
0%
3%
1%
2%
14%
28%
44%
8%
36%
5%
27%
21%
15%
44%
11%
32%
27%
33%
28%
33%
29%
28%
23%
47%
7%
62%
16%
62%
32%
47%
52%
10%
6%
4%
2%
6%
5%
5%
2%
3%
8%
3%
20%
16%
57%
34%
15%
41%
3%
6%
5%
11%
1%
38%
7%
30%
30%
16%
56%
5%
6%
404
526
692
237
139
422
258
247
346
181
153
418
511
123
196
267
344
611
319
158
80
214
150
134
191
180
156
182
174
84
225
197
171
567
159
316
124
222
162
718
186
531
385
How would you feel if each of the following Republican candidates were the Republican nominee for president? Chris Christie
Feelings if Chris Chrise Were Republican Nominee - Likely GOP Primary Voters

Enthusiastic or Satisfied Angry or Dissatisfied Don't know/Not sure
STATEWIDE November 2023
32%
63%
6%
N
933
Voting
Registration
Registered Republican
Registered Undeclared/Not Reg.
Party ID
Independent/Democrat
Republican
Political
Ideology
Moderate
Conservative
Libertarian
Age of
Respondent
18 to 34
35 to 49
50 to 64
65 and older
Gender of
Respondent
Men
Women
Level of
Education
High school or less
Tech school/Some college
College graduate
Postgraduate work
College
Degree
College graduate
Not college graduate
Region of
State
Central/Lakes
Connecticut Valley
Manchester Area
Mass Border
North Country
Seacoast
Household
Income
Less than $45,000
$45,000 - $74,999
$75,000 - $99,999
$100,000 - $149,999
$150,000 or more
Media Usage
CNN viewer
Conservative radio listener
Epoch Times reader
Fox News viewer
Joe Rogan listener
Local NH news viewer
Newsmax viewer
NHPR listener
X (formerly Twitter) user
2020 Pres
Vote
Voted for Biden
Voted for Trump
Preferred
Candidate
Trump primary supporter
Not Trump primary supporter
40%
25%
52%
71%
8%
4%
24%
52%
69%
43%
6%
5%
16%
20%
58%
78%
75%
38%
6%
5%
4%
28%
39%
26%
29%
65%
58%
72%
57%
8%
3%
2%
15%
29%
33%
62%
63%
9%
3%
42%
35%
27%
29%
49%
63%
64%
67%
10%
2%
9%
4%
28%
38%
66%
57%
6%
5%
43%
25%
32%
42%
20%
24%
53%
48%
63%
56%
79%
70%
4%
27%
5%
2%
1%
5%
29%
42%
32%
24%
18%
67%
53%
65%
63%
79%
4%
5%
3%
13%
3%
37%
57%
10%
45%
5%
30%
22%
17%
59%
58%
39%
89%
49%
90%
65%
76%
80%
34%
6%
4%
2%
6%
5%
5%
2%
3%
8%
19%
76%
75%
18%
6%
5%
49%
7%
46%
86%
5%
6%
404
526
692
237
139
422
258
247
346
181
153
418
511
123
196
267
344
611
319
158
80
214
150
134
191
180
156
182
174
84
225
197
171
567
159
316
124
222
162
718
186
531
385
How would you feel if each of the following Republican candidates were the Republican nominee for president? Chris Christie
Feelings if Chris Chrise Were Republican Nominee - Likely GOP Primary Voters

Enthusiastic Satisfied Dissatisfied Angry
Don't know/Not
sure
STATEWIDE November 2023
24%
25%
28%
19%
4%
N
934
Voting
Registration
Registered Republican
Registered Undeclared/Not Reg.
Party ID
Independent/Democrat
Republican
Political
Ideology
Moderate
Conservative
Libertarian
Age of
Respondent
18 to 34
35 to 49
50 to 64
65 and older
Gender of
Respondent
Men
Women
Level of
Education
High school or less
Tech school/Some college
College graduate
Postgraduate work
College
Degree
College graduate
Not college graduate
Region of
State
Central/Lakes
Connecticut Valley
Manchester Area
Mass Border
North Country
Seacoast
Household
Income
Less than $45,000
$45,000 - $74,999
$75,000 - $99,999
$100,000 - $149,999
$150,000 or more
Media Usage
CNN viewer
Conservative radio listener
Epoch Times reader
Fox News viewer
Joe Rogan listener
Local NH news viewer
Newsmax viewer
NHPR listener
X (formerly Twitter) user
2020 Pres
Vote
Voted for Biden
Voted for Trump
Preferred
Candidate
Trump primary supporter
Not Trump primary supporter
15%
32%
17%
31%
32%
24%
30%
10%
6%
3%
29%
10%
31%
5%
27%
30%
7%
53%
5%
2%
30%
35%
8%
12%
34%
26%
54%
22%
26%
1%
6%
38%
2%
4%
3%
24%
22%
22%
32%
36%
24%
27%
7%
17%
29%
34%
35%
18%
23%
17%
17%
5%
2%
1%
10%
18%
30%
18%
30%
37%
21%
22%
17%
6%
2%
15%
16%
20%
35%
20%
27%
21%
27%
29%
25%
35%
24%
30%
30%
17%
11%
5%
1%
7%
3%
29%
16%
25%
25%
28%
26%
13%
30%
5%
3%
26%
28%
30%
25%
27%
13%
20%
16%
25%
24%
19%
34%
22%
17%
24%
24%
42%
34%
31%
24%
17%
23%
12%
12%
1%
14%
3%
3%
0%
7%
25%
27%
12%
35%
17%
32%
17%
31%
30%
18%
20%
31%
43%
14%
24%
20%
23%
13%
10%
40%
2%
3%
2%
11%
2%
37%
14%
29%
25%
27%
44%
46%
35%
11%
18%
18%
23%
21%
29%
29%
27%
41%
15%
28%
26%
38%
27%
40%
17%
20%
17%
33%
17%
40%
8%
23%
3%
6%
4%
6%
36%
2%
2%
3%
2%
3%
3%
1%
6%
30%
1%
31%
3%
27%
31%
8%
63%
4%
3%
23%
27%
20%
30%
28%
28%
27%
9%
2%
7%
408
523
690
239
139
422
256
248
344
182
153
417
513
123
196
266
344
610
320
159
78
214
151
134
191
180
159
181
174
84
225
200
171
566
160
314
126
223
160
716
187
531
385
How would you feel if each of the following Republican candidates were the Republican nominee for president? Ron DeSantis
Feelings if Ron DeSans Were Republican Nominee - Likely GOP Primary Voters

Enthusiastic or Satisfied Angry or Dissatisfied Don't know/Not sure
STATEWIDE November 2023
49%
47%
4%
N
934
Voting
Registration
Registered Republican
Registered Undeclared/Not Reg.
Party ID
Independent/Democrat
Republican
Political
Ideology
Moderate
Conservative
Libertarian
Age of
Respondent
18 to 34
35 to 49
50 to 64
65 and older
Gender of
Respondent
Men
Women
Level of
Education
High school or less
Tech school/Some college
College graduate
Postgraduate work
College
Degree
College graduate
Not college graduate
Region of
State
Central/Lakes
Connecticut Valley
Manchester Area
Mass Border
North Country
Seacoast
Household
Income
Less than $45,000
$45,000 - $74,999
$75,000 - $99,999
$100,000 - $149,999
$150,000 or more
Media Usage
CNN viewer
Conservative radio listener
Epoch Times reader
Fox News viewer
Joe Rogan listener
Local NH news viewer
Newsmax viewer
NHPR listener
X (formerly Twitter) user
2020 Pres
Vote
Voted for Biden
Voted for Trump
Preferred
Candidate
Trump primary supporter
Not Trump primary supporter
32%
63%
62%
35%
6%
3%
61%
15%
35%
83%
5%
2%
43%
68%
34%
56%
28%
64%
2%
4%
3%
60%
46%
49%
38%
35%
52%
50%
52%
5%
2%
1%
10%
35%
60%
58%
38%
6%
2%
36%
44%
42%
62%
60%
55%
51%
35%
5%
1%
7%
3%
53%
41%
42%
57%
5%
3%
46%
44%
55%
50%
46%
47%
53%
41%
42%
47%
54%
47%
1%
14%
3%
3%
0%
7%
57%
44%
42%
65%
34%
40%
54%
55%
23%
64%
2%
3%
2%
11%
2%
55%
32%
51%
47%
56%
73%
73%
76%
25%
45%
66%
47%
50%
42%
23%
24%
23%
69%
2%
2%
3%
2%
3%
3%
1%
6%
61%
4%
35%
94%
4%
3%
43%
57%
55%
36%
2%
7%
408
523
690
239
139
422
256
248
344
182
153
417
513
123
196
266
344
610
320
159
78
214
151
134
191
180
159
181
174
84
225
200
171
566
160
314
126
223
160
716
187
531
385
How would you feel if each of the following Republican candidates were the Republican nominee for president? Ron DeSantis
Feelings if Ron DeSans Were Republican Nominee - Likely GOP Primary Voters

Enthusiastic Satisfied Dissatisfied Angry
Don't know/Not
sure
STATEWIDE November 2023
25%
29%
24%
14%
8%
N
936
Voting
Registration
Registered Republican
Registered Undeclared/Not Reg.
Party ID
Independent/Democrat
Republican
Political
Ideology
Moderate
Conservative
Libertarian
Age of
Respondent
18 to 34
35 to 49
50 to 64
65 and older
Gender of
Respondent
Men
Women
Level of
Education
High school or less
Tech school/Some college
College graduate
Postgraduate work
College
Degree
College graduate
Not college graduate
Region of
State
Central/Lakes
Connecticut Valley
Manchester Area
Mass Border
North Country
Seacoast
Household
Income
Less than $45,000
$45,000 - $74,999
$75,000 - $99,999
$100,000 - $149,999
$150,000 or more
Media Usage
CNN viewer
Conservative radio listener
Epoch Times reader
Fox News viewer
Joe Rogan listener
Local NH news viewer
Newsmax viewer
NHPR listener
X (formerly Twitter) user
2020 Pres
Vote
Voted for Biden
Voted for Trump
Preferred
Candidate
Trump primary supporter
Not Trump primary supporter
19%
30%
31%
27%
21%
26%
17%
11%
11%
5%
30%
11%
28%
33%
25%
20%
10%
25%
7%
11%
16%
31%
27%
17%
32%
38%
36%
19%
24%
26%
11%
7%
4%
7%
4%
28%
30%
11%
26%
34%
35%
29%
8%
18%
21%
51%
9%
11%
8%
5%
40%
9%
6%
4%
17%
22%
28%
25%
32%
26%
23%
15%
13%
12%
4%
25%
24%
20%
30%
31%
30%
30%
28%
26%
24%
25%
22%
7%
18%
15%
13%
12%
5%
10%
7%
26%
24%
29%
30%
24%
25%
14%
13%
8%
8%
30%
25%
33%
27%
18%
16%
45%
19%
28%
27%
15%
32%
12%
26%
24%
20%
29%
33%
9%
12%
10%
15%
31%
10%
4%
17%
5%
11%
7%
9%
34%
39%
25%
14%
6%
26%
23%
27%
40%
27%
23%
16%
31%
18%
31%
9%
12%
15%
15%
25%
9%
10%
2%
13%
12%
20%
27%
15%
33%
8%
43%
26%
21%
26%
33%
40%
24%
35%
10%
36%
8%
36%
38%
21%
23%
37%
20%
40%
11%
29%
26%
21%
23%
4%
21%
5%
38%
6%
33%
12%
4%
3%
7%
4%
6%
4%
4%
5%
4%
12%
28%
12%
25%
47%
25%
23%
16%
4%
6%
14%
33%
14%
36%
20%
14%
38%
11%
18%
6%
10%
407
526
693
238
138
422
259
249
346
182
153
418
513
123
195
270
344
614
318
159
79
215
151
134
191
180
158
183
174
84
225
198
173
569
160
317
126
223
162
719
187
534
385
How would you feel if each of the following Republican candidates were the Republican nominee for president? Nikki Haley
Feelings if Nikki Haley Were Republican Nominee - Likely GOP Primary Voters

Enthusiastic or Satisfied Angry or Dissatisfied Don't know/Not sure
STATEWIDE November 2023
54%
38%
8%
N
936
Voting
Registration
Registered Republican
Registered Undeclared/Not Reg.
Party ID
Independent/Democrat
Republican
Political
Ideology
Moderate
Conservative
Libertarian
Age of
Respondent
18 to 34
35 to 49
50 to 64
65 and older
Gender of
Respondent
Men
Women
Level of
Education
High school or less
Tech school/Some college
College graduate
Postgraduate work
College
Degree
College graduate
Not college graduate
Region of
State
Central/Lakes
Connecticut Valley
Manchester Area
Mass Border
North Country
Seacoast
Household
Income
Less than $45,000
$45,000 - $74,999
$75,000 - $99,999
$100,000 - $149,999
$150,000 or more
Media Usage
CNN viewer
Conservative radio listener
Epoch Times reader
Fox News viewer
Joe Rogan listener
Local NH news viewer
Newsmax viewer
NHPR listener
X (formerly Twitter) user
2020 Pres
Vote
Voted for Biden
Voted for Trump
Preferred
Candidate
Trump primary supporter
Not Trump primary supporter
50%
57%
39%
37%
11%
5%
58%
43%
35%
46%
7%
11%
33%
63%
65%
63%
30%
31%
4%
7%
4%
62%
64%
41%
34%
30%
29%
56%
49%
9%
6%
4%
17%
47%
60%
41%
35%
12%
4%
55%
53%
50%
58%
33%
42%
40%
35%
12%
5%
10%
7%
54%
54%
37%
38%
8%
8%
75%
44%
61%
55%
33%
48%
21%
38%
34%
35%
60%
43%
4%
17%
5%
11%
7%
9%
60%
61%
53%
54%
33%
31%
28%
46%
33%
55%
9%
10%
2%
13%
12%
53%
67%
39%
68%
18%
79%
34%
57%
63%
44%
26%
58%
25%
78%
17%
61%
39%
25%
3%
7%
4%
6%
4%
4%
5%
4%
12%
53%
59%
41%
28%
6%
14%
69%
34%
25%
56%
6%
10%
407
526
693
238
138
422
259
249
346
182
153
418
513
123
195
270
344
614
318
159
79
215
151
134
191
180
158
183
174
84
225
198
173
569
160
317
126
223
162
719
187
534
385
How would you feel if each of the following Republican candidates were the Republican nominee for president? Nikki Haley
Feelings if Nikki Haley Were Republican Nominee - Likely GOP Primary Voters

Enthusiastic Satisfied Dissatisfied Angry
Don't know/Not
sure
STATEWIDE November 2023
18%
26%
25%
20%
11%
N
936
Voting
Registration
Registered Republican
Registered Undeclared/Not Reg.
Party ID
Independent/Democrat
Republican
Political
Ideology
Moderate
Conservative
Libertarian
Age of
Respondent
18 to 34
35 to 49
50 to 64
65 and older
Gender of
Respondent
Men
Women
Level of
Education
High school or less
Tech school/Some college
College graduate
Postgraduate work
College
Degree
College graduate
Not college graduate
Region of
State
Central/Lakes
Connecticut Valley
Manchester Area
Mass Border
North Country
Seacoast
Household
Income
Less than $45,000
$45,000 - $74,999
$75,000 - $99,999
$100,000 - $149,999
$150,000 or more
Media Usage
CNN viewer
Conservative radio listener
Epoch Times reader
Fox News viewer
Joe Rogan listener
Local NH news viewer
Newsmax viewer
NHPR listener
X (formerly Twitter) user
2020 Pres
Vote
Voted for Biden
Voted for Trump
Preferred
Candidate
Trump primary supporter
Not Trump primary supporter
18%
18%
12%
37%
24%
25%
31%
12%
14%
9%
18%
18%
32%
8%
27%
18%
11%
48%
12%
8%
42%
18%
3%
11%
38%
24%
32%
23%
28%
9%
9%
34%
6%
11%
11%
9%
13%
17%
44%
28%
26%
36%
12%
34%
25%
27%
6%
18%
24%
17%
21%
11%
12%
3%
17%
13%
22%
26%
26%
27%
23%
21%
20%
14%
9%
15%
16%
21%
17%
17%
25%
23%
32%
21%
24%
27%
25%
34%
26%
18%
14%
12%
8%
11%
12%
19%
16%
28%
22%
26%
23%
16%
29%
12%
10%
13%
13%
16%
27%
37%
6%
26%
20%
28%
24%
13%
35%
26%
22%
21%
22%
31%
28%
20%
26%
30%
18%
16%
13%
16%
19%
5%
9%
2%
18%
20%
20%
17%
20%
17%
32%
21%
35%
25%
24%
19%
24%
23%
21%
26%
24%
21%
22%
12%
28%
5%
15%
2%
23%
5%
34%
9%
18%
14%
44%
25%
50%
21%
12%
21%
7%
42%
23%
24%
29%
17%
38%
9%
16%
28%
25%
26%
21%
25%
20%
18%
24%
20%
48%
8%
26%
1%
11%
5%
13%
46%
10%
7%
7%
11%
10%
10%
8%
10%
9%
23%
0%
33%
4%
26%
22%
8%
65%
11%
9%
15%
22%
18%
37%
25%
26%
31%
6%
11%
10%
407
526
693
239
139
422
259
248
346
182
153
419
513
123
196
269
344
614
319
159
80
215
151
134
191
180
159
184
174
84
225
200
173
570
160
317
125
223
162
719
187
534
385
How would you feel if each of the following Republican candidates were the Republican nominee for president? Vivek Ramaswamy
Feelings if Vivek Ramaswamy Were Republican Nominee - Likely GOP Primary Voters

Enthusiastic or Satisfied Angry or Dissatisfied Don't know/Not sure
STATEWIDE November 2023
44%
45%
11%
N
936
Voting
Registration
Registered Republican
Registered Undeclared/Not Reg.
Party ID
Independent/Democrat
Republican
Political
Ideology
Moderate
Conservative
Libertarian
Age of
Respondent
18 to 34
35 to 49
50 to 64
65 and older
Gender of
Respondent
Men
Women
Level of
Education
High school or less
Tech school/Some college
College graduate
Postgraduate work
College
Degree
College graduate
Not college graduate
Region of
State
Central/Lakes
Connecticut Valley
Manchester Area
Mass Border
North Country
Seacoast
Household
Income
Less than $45,000
$45,000 - $74,999
$75,000 - $99,999
$100,000 - $149,999
$150,000 or more
Media Usage
CNN viewer
Conservative radio listener
Epoch Times reader
Fox News viewer
Joe Rogan listener
Local NH news viewer
Newsmax viewer
NHPR listener
X (formerly Twitter) user
2020 Pres
Vote
Voted for Biden
Voted for Trump
Preferred
Candidate
Trump primary supporter
Not Trump primary supporter
30%
54%
56%
37%
14%
9%
50%
26%
38%
66%
12%
8%
53%
57%
27%
41%
33%
62%
6%
11%
11%
37%
39%
53%
56%
52%
49%
44%
27%
11%
12%
3%
17%
39%
48%
47%
43%
14%
9%
32%
42%
44%
49%
56%
50%
45%
38%
12%
8%
11%
12%
47%
38%
41%
52%
12%
10%
39%
33%
44%
51%
50%
41%
45%
48%
51%
40%
47%
41%
16%
19%
5%
9%
2%
18%
52%
41%
53%
45%
41%
43%
45%
45%
32%
54%
5%
15%
2%
23%
5%
55%
16%
60%
37%
68%
54%
67%
59%
21%
35%
77%
33%
52%
22%
36%
25%
31%
70%
10%
7%
7%
11%
10%
10%
8%
10%
9%
55%
4%
33%
87%
11%
9%
33%
59%
56%
31%
11%
10%
407
526
693
239
139
422
259
248
346
182
153
419
513
123
196
269
344
614
319
159
80
215
151
134
191
180
159
184
174
84
225
200
173
570
160
317
125
223
162
719
187
534
385
How would you feel if each of the following Republican candidates were the Republican nominee for president? Vivek Ramaswamy
Feelings if Vivek Ramaswamy Were Republican Nominee - Likely GOP Primary Voters

Enthusiastic Satisfied Dissatisfied Angry
Don't know/Not
sure
STATEWIDE November 2023
46%
17%
10%
26%
2%
N
937
Voting
Registration
Registered Republican
Registered Undeclared/Not Reg.
Party ID
Independent/Democrat
Republican
Political
Ideology
Moderate
Conservative
Libertarian
Age of
Respondent
18 to 34
35 to 49
50 to 64
65 and older
Gender of
Respondent
Men
Women
Level of
Education
High school or less
Tech school/Some college
College graduate
Postgraduate work
College
Degree
College graduate
Not college graduate
Region of
State
Central/Lakes
Connecticut Valley
Manchester Area
Mass Border
North Country
Seacoast
Household
Income
Less than $45,000
$45,000 - $74,999
$75,000 - $99,999
$100,000 - $149,999
$150,000 or more
Media Usage
CNN viewer
Conservative radio listener
Epoch Times reader
Fox News viewer
Joe Rogan listener
Local NH news viewer
Newsmax viewer
NHPR listener
X (formerly Twitter) user
2020 Pres
Vote
Voted for Biden
Voted for Trump
Preferred
Candidate
Trump primary supporter
Not Trump primary supporter
27%
60%
16%
17%
11%
9%
42%
13%
3%
0%
57%
15%
19%
12%
11%
7%
12%
65%
2%
1%
51%
63%
21%
23%
17%
19%
12%
11%
8%
13%
7%
51%
1%
2%
1%
52%
39%
52%
45%
13%
22%
12%
16%
7%
10%
11%
12%
27%
28%
21%
25%
1%
0%
4%
2%
40%
51%
23%
12%
10%
9%
25%
27%
2%
1%
25%
38%
43%
61%
15%
14%
18%
18%
9%
12%
15%
5%
46%
35%
22%
17%
5%
2%
2%
53%
33%
18%
14%
9%
11%
19%
39%
1%
3%
42%
51%
38%
55%
51%
47%
18%
7%
17%
8%
20%
22%
13%
22%
6%
12%
6%
8%
26%
18%
36%
25%
23%
21%
1%
1%
3%
2%
0%
3%
38%
45%
37%
51%
71%
19%
12%
24%
17%
5%
8%
9%
10%
16%
3%
32%
31%
26%
16%
21%
2%
3%
2%
0%
57%
19%
86%
33%
69%
59%
82%
68%
16%
14%
6%
5%
19%
21%
16%
10%
13%
10%
5%
11%
3%
11%
2%
10%
3%
7%
14%
23%
60%
6%
35%
5%
13%
4%
11%
57%
1%
4%
0%
2%
2%
1%
1%
0%
3%
60%
0%
21%
1%
10%
7%
7%
89%
1%
2%
13%
92%
26%
4%
15%
3%
44%
0%
2%
0%
406
527
694
238
139
423
259
250
346
182
153
418
515
123
196
270
344
615
319
159
80
217
151
134
190
180
158
184
174
84
225
200
174
569
160
318
126
223
162
721
186
533
387
How would you feel if each of the following Republican candidates were the Republican nominee for president? Donald Trump
Feelings if Donald Trump Were Republican Nominee - Likely GOP Primary Voters

Enthusiastic or Satisfied Angry or Dissatisfied Don't know/Not sure
STATEWIDE November 2023
63%
36%
2%
N
937
Voting
Registration
Registered Republican
Registered Undeclared/Not Reg.
Party ID
Independent/Democrat
Republican
Political
Ideology
Moderate
Conservative
Libertarian
Age of
Respondent
18 to 34
35 to 49
50 to 64
65 and older
Gender of
Respondent
Men
Women
Level of
Education
High school or less
Tech school/Some college
College graduate
Postgraduate work
College
Degree
College graduate
Not college graduate
Region of
State
Central/Lakes
Connecticut Valley
Manchester Area
Mass Border
North Country
Seacoast
Household
Income
Less than $45,000
$45,000 - $74,999
$75,000 - $99,999
$100,000 - $149,999
$150,000 or more
Media Usage
CNN viewer
Conservative radio listener
Epoch Times reader
Fox News viewer
Joe Rogan listener
Local NH news viewer
Newsmax viewer
NHPR listener
X (formerly Twitter) user
2020 Pres
Vote
Voted for Biden
Voted for Trump
Preferred
Candidate
Trump primary supporter
Not Trump primary supporter
44%
77%
53%
22%
3%
0%
75%
27%
23%
72%
2%
1%
74%
81%
40%
25%
18%
59%
1%
2%
1%
65%
61%
64%
61%
34%
38%
32%
37%
1%
0%
4%
2%
63%
63%
35%
36%
2%
1%
40%
51%
62%
78%
55%
47%
36%
22%
5%
2%
2%
71%
47%
28%
50%
1%
3%
60%
59%
55%
62%
71%
69%
39%
41%
42%
36%
29%
28%
1%
1%
3%
2%
0%
3%
57%
57%
61%
69%
75%
40%
40%
37%
31%
25%
2%
3%
2%
0%
71%
25%
91%
52%
91%
76%
92%
81%
26%
29%
71%
9%
46%
8%
23%
7%
19%
71%
1%
4%
0%
2%
2%
1%
1%
0%
3%
81%
1%
18%
97%
1%
2%
38%
96%
59%
3%
2%
0%
406
527
694
238
139
423
259
250
346
182
153
418
515
123
196
270
344
615
319
159
80
217
151
134
190
180
158
184
174
84
225
200
174
569
160
318
126
223
162
721
186
533
387
How would you feel if each of the following Republican candidates were the Republican nominee for president? Donald Trump
Feelings if Donald Trump Were Republican Nominee - Likely GOP Primary Voters

Favorable Neutral Unfavorable
Don't know enough
about to say
STATEWIDE November 2023
12%
34%
24%
30%
N
947
Voting
Registration
Registered Republican
Registered Undeclared/Not Reg.
Party ID
Independent/Democrat
Republican
Political
Ideology
Moderate
Conservative
Libertarian
Age of
Respondent
18 to 34
35 to 49
50 to 64
65 and older
Gender of
Respondent
Men
Women
Level of
Education
High school or less
Tech school/Some college
College graduate
Postgraduate work
College
Degree
College graduate
Not college graduate
Region of
State
Central/Lakes
Connecticut Valley
Manchester Area
Mass Border
North Country
Seacoast
Household
Income
Less than $45,000
$45,000 - $74,999
$75,000 - $99,999
$100,000 - $149,999
$150,000 or more
Media Usage
CNN viewer
Conservative radio listener
Epoch Times reader
Fox News viewer
Joe Rogan listener
Local NH news viewer
Newsmax viewer
NHPR listener
X (formerly Twitter) user
2020 Pres
Vote
Voted for Biden
Voted for Trump
Preferred
Candidate
Trump primary supporter
Not Trump primary supporter
6%
17%
30%
37%
34%
16%
30%
30%
15%
5%
37%
25%
15%
49%
33%
21%
13%
17%
10%
19%
37%
42%
26%
15%
26%
42%
31%
23%
17%
16%
7%
3%
45%
30%
28%
30%
21%
20%
19%
42%
16%
34%
46%
24%
11%
14%
27%
39%
26%
21%
36%
25%
16%
12%
8%
14%
28%
29%
38%
35%
28%
28%
25%
19%
28%
31%
29%
32%
12%
14%
36%
29%
21%
28%
31%
30%
20%
15%
13%
8%
2%
15%
23%
15%
36%
46%
25%
47%
19%
31%
15%
26%
47%
16%
38%
39%
36%
19%
26%
22%
12%
9%
17%
12%
10%
38%
42%
32%
35%
34%
22%
19%
29%
21%
40%
28%
30%
21%
31%
16%
5%
15%
13%
15%
4%
16%
18%
18%
14%
37%
29%
34%
37%
28%
47%
35%
47%
36%
27%
25%
23%
22%
31%
18%
25%
11%
28%
31%
30%
30%
26%
37%
20%
21%
25%
22%
15%
5%
34%
29%
21%
36%
30%
30%
14%
9%
31%
39%
26%
21%
29%
31%
406
538
705
237
139
434
260
248
357
182
153
428
515
124
196
269
355
624
320
160
91
214
151
134
191
180
159
184
174
85
225
198
174
568
161
315
126
223
162
732
185
533
397
Below is a list of national public figures who have announced they are running for the Republican nomination for president in 2024. Please indicate
whether you have a favorable or unfavorable opinion of each of them or if you don't know enough about them to say - Doug Burgum
Favorability - Doug Burgum - Likely GOP Primary Voters

Favorable Neutral Unfavorable
Don't know enough
about to say
STATEWIDE November 2023
17%
20%
60%
3%
N
949
Voting
Registration
Registered Republican
Registered Undeclared/Not Reg.
Party ID
Independent/Democrat
Republican
Political
Ideology
Moderate
Conservative
Libertarian
Age of
Respondent
18 to 34
35 to 49
50 to 64
65 and older
Gender of
Respondent
Men
Women
Level of
Education
High school or less
Tech school/Some college
College graduate
Postgraduate work
College
Degree
College graduate
Not college graduate
Region of
State
Central/Lakes
Connecticut Valley
Manchester Area
Mass Border
North Country
Seacoast
Household
Income
Less than $45,000
$45,000 - $74,999
$75,000 - $99,999
$100,000 - $149,999
$150,000 or more
Media Usage
CNN viewer
Conservative radio listener
Epoch Times reader
Fox News viewer
Joe Rogan listener
Local NH news viewer
Newsmax viewer
NHPR listener
X (formerly Twitter) user
2020 Pres
Vote
Voted for Biden
Voted for Trump
Preferred
Candidate
Trump primary supporter
Not Trump primary supporter
23%
13%
25%
16%
49%
68%
3%
3%
12%
33%
17%
28%
67%
39%
4%
0%
6%
7%
38%
17%
12%
30%
78%
75%
32%
5%
0%
16%
25%
17%
3%
20%
18%
13%
31%
61%
54%
71%
59%
3%
3%
7%
19%
15%
17%
23%
57%
62%
7%
0%
21%
23%
17%
12%
24%
20%
16%
21%
54%
56%
62%
62%
0%
0%
4%
5%
15%
22%
19%
22%
62%
56%
5%
0%
33%
12%
19%
19%
6%
11%
13%
25%
21%
31%
18%
15%
54%
39%
60%
50%
76%
71%
24%
0%
4%
18%
14%
23%
14%
16%
13%
29%
18%
13%
18%
68%
57%
59%
62%
65%
0%
10%
15%
32%
4%
25%
2%
9%
1%
6%
38%
23%
29%
9%
26%
4%
26%
23%
14%
26%
61%
38%
88%
47%
94%
64%
76%
80%
37%
0%
1%
0%
9%
51%
15%
35%
73%
13%
4%
0%
30%
1%
26%
11%
45%
80%
0%
7%
408
538
705
239
139
433
260
250
357
182
153
430
515
123
196
271
355
626
319
160
91
216
151
134
191
180
158
184
174
85
225
200
174
570
161
318
126
223
162
731
187
535
397
Below is a list of national public figures who have announced they are running for the Republican nomination for president in 2024. Please indicate
whether you have a favorable or unfavorable opinion of each of them or if you don't know enough about them to say - Chris Christie
Favorability - Chris Chrise - Likely GOP Primary Voters

Favorable Neutral Unfavorable
Don't know enough
about to say
STATEWIDE November 2023
38%
22%
39%
1%
N
951
Voting
Registration
Registered Republican
Registered Undeclared/Not Reg.
Party ID
Independent/Democrat
Republican
Political
Ideology
Moderate
Conservative
Libertarian
Age of
Respondent
18 to 34
35 to 49
50 to 64
65 and older
Gender of
Respondent
Men
Women
Level of
Education
High school or less
Tech school/Some college
College graduate
Postgraduate work
College
Degree
College graduate
Not college graduate
Region of
State
Central/Lakes
Connecticut Valley
Manchester Area
Mass Border
North Country
Seacoast
Household
Income
Less than $45,000
$45,000 - $74,999
$75,000 - $99,999
$100,000 - $149,999
$150,000 or more
Media Usage
CNN viewer
Conservative radio listener
Epoch Times reader
Fox News viewer
Joe Rogan listener
Local NH news viewer
Newsmax viewer
NHPR listener
X (formerly Twitter) user
2020 Pres
Vote
Voted for Biden
Voted for Trump
Preferred
Candidate
Trump primary supporter
Not Trump primary supporter
24%
49%
22%
22%
52%
29%
3%
0%
47%
13%
25%
12%
27%
75%
2%
38%
55%
17%
32%
21%
22%
30%
21%
60%
3%
0%
49%
34%
33%
35%
18%
22%
24%
25%
33%
44%
43%
33%
1%
7%
29%
45%
20%
23%
48%
32%
3%
0%
27%
32%
34%
48%
13%
21%
28%
21%
60%
46%
34%
32%
0%
5%
42%
30%
24%
18%
33%
52%
2%
0%
36%
33%
46%
37%
41%
31%
12%
24%
14%
25%
23%
35%
52%
31%
40%
38%
36%
34%
12%
1%
43%
35%
26%
55%
29%
18%
15%
40%
15%
20%
39%
50%
34%
23%
49%
6%
1%
50%
22%
41%
38%
40%
56%
67%
55%
12%
11%
13%
25%
16%
33%
24%
17%
26%
15%
39%
65%
33%
46%
26%
20%
16%
19%
73%
0%
1%
0%
0%
0%
47%
1%
27%
2%
24%
97%
2%
0%
34%
42%
16%
30%
50%
25%
0%
3%
410
538
705
241
139
435
260
250
359
182
153
430
517
124
196
273
355
628
320
160
91
218
151
134
191
180
160
184
174
85
225
202
174
571
161
319
126
223
162
733
187
535
397
Below is a list of national public figures who have announced they are running for the Republican nomination for president in 2024. Please indicate
whether you have a favorable or unfavorable opinion of each of them or if you don't know enough about them to say - Ron DeSantis
Favorability - Ron DeSans - Likely GOP Primary Voters

Favorable Neutral Unfavorable
Don't know enough
about to say
STATEWIDE November 2023
42%
20%
32%
6%
N
948
Voting
Registration
Registered Republican
Registered Undeclared/Not Reg.
Party ID
Independent/Democrat
Republican
Political
Ideology
Moderate
Conservative
Libertarian
Age of
Respondent
18 to 34
35 to 49
50 to 64
65 and older
Gender of
Respondent
Men
Women
Level of
Education
High school or less
Tech school/Some college
College graduate
Postgraduate work
College
Degree
College graduate
Not college graduate
Region of
State
Central/Lakes
Connecticut Valley
Manchester Area
Mass Border
North Country
Seacoast
Household
Income
Less than $45,000
$45,000 - $74,999
$75,000 - $99,999
$100,000 - $149,999
$150,000 or more
Media Usage
CNN viewer
Conservative radio listener
Epoch Times reader
Fox News viewer
Joe Rogan listener
Local NH news viewer
Newsmax viewer
NHPR listener
X (formerly Twitter) user
2020 Pres
Vote
Voted for Biden
Voted for Trump
Preferred
Candidate
Trump primary supporter
Not Trump primary supporter
36%
47%
23%
17%
33%
32%
8%
4%
46%
31%
19%
24%
29%
42%
7%
2%
23%
50%
48%
19%
19%
18%
56%
24%
28%
2%
7%
6%
51%
49%
26%
30%
20%
22%
19%
15%
26%
20%
55%
45%
3%
9%
0%
9%
35%
49%
20%
19%
35%
30%
10%
2%
41%
38%
39%
48%
30%
25%
19%
13%
27%
35%
35%
30%
1%
1%
7%
9%
44%
39%
16%
27%
32%
32%
8%
1%
58%
33%
45%
45%
26%
38%
21%
13%
21%
25%
14%
21%
19%
27%
28%
28%
59%
36%
2%
27%
5%
2%
1%
6%
48%
47%
40%
42%
26%
26%
24%
14%
14%
30%
24%
24%
40%
32%
44%
1%
4%
6%
12%
1%
47%
46%
34%
53%
16%
65%
30%
42%
45%
11%
28%
16%
22%
8%
24%
11%
24%
36%
40%
24%
49%
20%
75%
11%
57%
31%
17%
2%
2%
2%
5%
2%
1%
2%
3%
2%
43%
39%
18%
29%
34%
24%
5%
8%
51%
30%
22%
17%
23%
44%
4%
9%
407
537
704
239
138
433
260
249
357
182
153
430
514
124
195
270
355
625
319
159
91
216
151
134
191
180
158
184
173
85
225
200
174
570
160
317
126
222
162
730
187
533
397
Below is a list of national public figures who have announced they are running for the Republican nomination for president in 2024. Please indicate
whether you have a favorable or unfavorable opinion of each of them or if you don't know enough about them to say - Nikki Haley
Favorability - Nikki Haley - Likely GOP Primary Voters

Favorable Neutral Unfavorable
Don't know enough
about to say
STATEWIDE November 2023
7%
26%
38%
29%
N
946
Voting
Registration
Registered Republican
Registered Undeclared/Not Reg.
Party ID
Independent/Democrat
Republican
Political
Ideology
Moderate
Conservative
Libertarian
Age of
Respondent
18 to 34
35 to 49
50 to 64
65 and older
Gender of
Respondent
Men
Women
Level of
Education
High school or less
Tech school/Some college
College graduate
Postgraduate work
College
Degree
College graduate
Not college graduate
Region of
State
Central/Lakes
Connecticut Valley
Manchester Area
Mass Border
North Country
Seacoast
Household
Income
Less than $45,000
$45,000 - $74,999
$75,000 - $99,999
$100,000 - $149,999
$150,000 or more
Media Usage
CNN viewer
Conservative radio listener
Epoch Times reader
Fox News viewer
Joe Rogan listener
Local NH news viewer
Newsmax viewer
NHPR listener
X (formerly Twitter) user
2020 Pres
Vote
Voted for Biden
Voted for Trump
Preferred
Candidate
Trump primary supporter
Not Trump primary supporter
5%
8%
27%
26%
36%
40%
32%
27%
6%
8%
25%
32%
37%
39%
32%
21%
0%
9%
9%
25%
25%
31%
41%
38%
37%
34%
28%
24%
6%
6%
2%
16%
34%
30%
16%
20%
40%
32%
44%
40%
20%
32%
38%
24%
4%
9%
31%
22%
26%
48%
39%
21%
9%
6%
3%
9%
25%
24%
36%
20%
34%
41%
32%
43%
32%
30%
30%
27%
7%
7%
27%
24%
38%
38%
28%
31%
4%
2%
5%
20%
0%
7%
34%
24%
24%
21%
28%
27%
37%
33%
38%
34%
38%
43%
25%
40%
33%
25%
33%
24%
4%
22%
8%
2%
1%
29%
25%
29%
26%
23%
35%
24%
46%
39%
54%
32%
29%
18%
33%
22%
11%
11%
1%
10%
1%
10%
23%
3%
12%
23%
25%
20%
28%
24%
26%
14%
23%
25%
50%
32%
56%
31%
46%
43%
50%
57%
34%
16%
32%
22%
30%
29%
22%
14%
17%
29%
6%
12%
27%
26%
40%
28%
28%
34%
6%
7%
33%
17%
29%
50%
31%
25%
406
537
704
237
139
433
260
248
356
182
153
427
515
124
195
269
355
624
319
159
91
214
151
134
191
180
159
183
174
85
225
198
174
568
161
315
126
223
162
731
185
533
396
Below is a list of national public figures who have announced they are running for the Republican nomination for president in 2024. Please indicate
whether you have a favorable or unfavorable opinion of each of them or if you don't know enough about them to say - Asa Hutchinson
Favorability - Asa Hutchinson - Likely GOP Primary Voters

Favorable Neutral Unfavorable
Don't know enough
about to say
STATEWIDE November 2023
30%
23%
40%
7%
N
949
Voting
Registration
Registered Republican
Registered Undeclared/Not Reg.
Party ID
Independent/Democrat
Republican
Political
Ideology
Moderate
Conservative
Libertarian
Age of
Respondent
18 to 34
35 to 49
50 to 64
65 and older
Gender of
Respondent
Men
Women
Level of
Education
High school or less
Tech school/Some college
College graduate
Postgraduate work
College
Degree
College graduate
Not college graduate
Region of
State
Central/Lakes
Connecticut Valley
Manchester Area
Mass Border
North Country
Seacoast
Household
Income
Less than $45,000
$45,000 - $74,999
$75,000 - $99,999
$100,000 - $149,999
$150,000 or more
Media Usage
CNN viewer
Conservative radio listener
Epoch Times reader
Fox News viewer
Joe Rogan listener
Local NH news viewer
Newsmax viewer
NHPR listener
X (formerly Twitter) user
2020 Pres
Vote
Voted for Biden
Voted for Trump
Preferred
Candidate
Trump primary supporter
Not Trump primary supporter
22%
36%
18%
28%
53%
29%
6%
7%
34%
20%
28%
12%
30%
66%
8%
2%
46%
39%
12%
11%
30%
21%
40%
23%
60%
2%
8%
6%
26%
28%
27%
44%
29%
20%
31%
16%
42%
43%
40%
29%
4%
9%
2%
11%
29%
31%
19%
27%
43%
37%
9%
5%
24%
26%
35%
31%
16%
26%
21%
26%
56%
44%
37%
33%
3%
3%
7%
9%
33%
25%
24%
22%
35%
49%
8%
3%
18%
17%
36%
39%
44%
23%
34%
18%
17%
26%
9%
33%
38%
41%
47%
33%
43%
37%
10%
25%
1%
2%
5%
7%
41%
27%
30%
34%
23%
15%
27%
29%
27%
33%
41%
44%
41%
25%
40%
2%
3%
0%
14%
4%
46%
11%
43%
27%
54%
37%
60%
39%
15%
16%
8%
30%
21%
22%
26%
16%
33%
8%
29%
77%
25%
46%
19%
35%
20%
25%
74%
9%
4%
2%
6%
5%
2%
5%
3%
3%
38%
1%
28%
7%
26%
89%
7%
3%
26%
37%
16%
32%
53%
22%
5%
9%
408
537
705
239
139
434
260
250
357
182
153
430
515
123
196
271
355
626
319
160
91
216
150
134
191
180
158
184
174
85
225
200
174
570
161
317
126
223
162
731
187
535
397
Below is a list of national public figures who have announced they are running for the Republican nomination for president in 2024. Please indicate
whether you have a favorable or unfavorable opinion of each of them or if you don't know enough about them to say - Vivek Ramaswamy
Favorability - Vivek Ramaswamy - Likely GOP Primary Voters

Favorable Neutral Unfavorable
Don't know enough
about to say
STATEWIDE November 2023
51%
15%
34%
0%
N
948
Voting
Registration
Registered Republican
Registered Undeclared/Not Reg.
Party ID
Independent/Democrat
Republican
Political
Ideology
Moderate
Conservative
Libertarian
Age of
Respondent
18 to 34
35 to 49
50 to 64
65 and older
Gender of
Respondent
Men
Women
Level of
Education
High school or less
Tech school/Some college
College graduate
Postgraduate work
College
Degree
College graduate
Not college graduate
Region of
State
Central/Lakes
Connecticut Valley
Manchester Area
Mass Border
North Country
Seacoast
Household
Income
Less than $45,000
$45,000 - $74,999
$75,000 - $99,999
$100,000 - $149,999
$150,000 or more
Media Usage
CNN viewer
Conservative radio listener
Epoch Times reader
Fox News viewer
Joe Rogan listener
Local NH news viewer
Newsmax viewer
NHPR listener
X (formerly Twitter) user
2020 Pres
Vote
Voted for Biden
Voted for Trump
Preferred
Candidate
Trump primary supporter
Not Trump primary supporter
33%
65%
15%
14%
52%
21%
0%
63%
17%
17%
9%
21%
74%
0%
70%
71%
22%
6%
15%
18%
24%
14%
60%
0%
56%
50%
49%
46%
10%
14%
19%
20%
34%
37%
32%
34%
0%
50%
52%
16%
13%
33%
35%
0%
32%
42%
59%
57%
7%
12%
10%
22%
61%
46%
31%
21%
0%
58%
38%
17%
10%
25%
52%
0%
55%
59%
44%
58%
51%
46%
6%
17%
14%
7%
21%
23%
39%
24%
42%
35%
28%
31%
0%
43%
47%
47%
46%
73%
14%
9%
18%
30%
2%
42%
44%
35%
24%
25%
59%
24%
87%
40%
60%
66%
72%
68%
19%
14%
3%
4%
13%
31%
11%
20%
14%
6%
27%
73%
9%
47%
9%
23%
7%
18%
74%
0%
0%
0%
66%
0%
19%
1%
16%
99%
0%
21%
92%
20%
8%
59%
0%
0%
408
537
704
239
139
434
259
250
356
182
153
431
513
124
196
270
355
625
319
159
91
217
151
134
190
180
158
184
174
85
225
200
174
569
160
317
126
223
162
731
187
534
397
Below is a list of national public figures who have announced they are running for the Republican nomination for president in 2024. Please indicate
whether you have a favorable or unfavorable opinion of each of them or if you don't know enough about them to say - Donald Trump
Favorability - Donald Trump - Likely GOP Primary Voters

Ability to
win general
election
Age
Attacks by
opponents
or media
Baggage Bombastic
Chaos or
drama
Corrupt
personality
STATEWIDE November 2023
9%
0%
14%
0%
6%
2%
0%
Voting
Registration
Registered Republican
Registered Undeclared/Not Reg.
Party ID
Independent/Democrat
Republican
Political
Ideology
Moderate
Conservative
Libertarian
Age of
Respondent
18 to 34
35 to 49
50 to 64
65 and older
Gender of
Respondent
Men
Women
Level of
Education
High school or less
Tech school/Some college
College graduate
Postgraduate work
College
Degree
College graduate
Not college graduate
Region of
State
Central/Lakes
Connecticut Valley
Manchester Area
Mass Border
North Country
Seacoast
Household
Income
Less than $45,000
$45,000 - $74,999
$75,000 - $99,999
$100,000 - $149,999
$150,000 or more
Media Usage
CNN viewer
Conservative radio listener
Epoch Times reader
Fox News viewer
Joe Rogan listener
Local NH news viewer
Newsmax viewer
NHPR listener
X (formerly Twitter) user
2020 Pres
Vote
Voted for Biden
Voted for Trump
Preferred
Candidate
Trump primary supporter
Not Trump primary supporter
12%
6%
0%
1%
7%
19%
0%
1%
3%
8%
3%
2%
0%
1%
9%
9%
1%
0%
18%
2%
1%
0%
8%
1%
2%
4%
0%
1%
30%
8%
3%
0%
1%
0%
15%
22%
4%
1%
0%
3%
7%
7%
3%
1%
5%
1%
0%
1%
2%
7%
12%
24%
1%
0%
1%
12%
17%
15%
3%
1%
0%
7%
9%
1%
3%
2%
4%
2%
1%
0%
1%
1%
7%
10%
0%
1%
13%
14%
1%
0%
7%
4%
3%
2%
1%
0%
5%
8%
15%
6%
1%
1%
0%
11%
11%
17%
14%
0%
1%
1%
3%
7%
5%
7%
5%
3%
4%
0%
1%
1%
10%
7%
0%
1%
15%
11%
0%
1%
6%
6%
2%
3%
0%
1%
3%
3%
11%
1%
25%
8%
0%
0%
0%
0%
1%
4%
19%
22%
14%
7%
12%
1%
1%
12%
5%
2%
5%
5%
7%
5%
2%
1%
2%
2%
3%
1%
0%
0%
1%
10%
6%
15%
7%
0%
1%
0%
0%
0%
23%
8%
12%
13%
14%
1%
0%
2%
1%
14%
6%
3%
4%
3%
2%
2%
2%
2%
0%
0%
0%
11%
11%
8%
8%
18%
8%
5%
14%
9%
1%
1%
0%
1%
0%
1%
1%
15%
4%
24%
14%
10%
11%
30%
22%
2%
0%
1%
1%
1%
1%
0%
1%
3%
3%
7%
1%
8%
1%
3%
4%
2%
4%
0%
4%
2%
2%
0%
1%
6%
1%
2%
0%
1%
0%
0%
10%
0%
1%
0%
18%
0%
1%
0%
7%
1%
1%
7%
2%
13%
4%
0%
11%
18%
1%
8%
3%
4%
1%
1%
What is your biggest concern, if any, about Donald Trump as a candidate for president in 2024? (coded)
Biggest Concern if Trump is 2024 GOP Nominee (coded) - Likely GOP Primary Voters

Dishonesty
Divisive or
unpopular
Do not want as
president
Everything
General character
concerns
STATEWIDE November 2023
3%
7%
2%
1%
4%
Voting
Registration
Registered Republican
Registered Undeclared/Not Reg.
Party ID
Independent/Democrat
Republican
Political
Ideology
Moderate
Conservative
Libertarian
Age of
Respondent
18 to 34
35 to 49
50 to 64
65 and older
Gender of
Respondent
Men
Women
Level of
Education
High school or less
Tech school/Some college
College graduate
Postgraduate work
College
Degree
College graduate
Not college graduate
Region of
State
Central/Lakes
Connecticut Valley
Manchester Area
Mass Border
North Country
Seacoast
Household
Income
Less than $45,000
$45,000 - $74,999
$75,000 - $99,999
$100,000 - $149,999
$150,000 or more
Media Usage
CNN viewer
Conservative radio listener
Epoch Times reader
Fox News viewer
Joe Rogan listener
Local NH news viewer
Newsmax viewer
NHPR listener
X (formerly Twitter) user
2020 Pres
Vote
Voted for Biden
Voted for Trump
Preferred
Candidate
Trump primary supporter
Not Trump primary supporter
3%
2%
9%
6%
5%
0%
2%
0%
8%
1%
2%
6%
6%
12%
2%
3%
0%
4%
1%
14%
0%
1%
8%
7%
5%
5%
0%
0%
7%
0%
3%
0%
1%
7%
5%
2%
2%
4%
7%
7%
17%
2%
4%
0%
1%
0%
0%
4%
3%
5%
3%
7%
2%
3%
5%
9%
4%
1%
1%
1%
5%
4%
3%
4%
3%
2%
11%
5%
6%
9%
3%
1%
1%
4%
2%
1%
1%
8%
7%
3%
3%
2%
4%
7%
8%
3%
2%
1%
2%
3%
7%
4%
2%
1%
7%
0%
2%
7%
3%
7%
9%
17%
1%
1%
3%
6%
1%
1%
0%
0%
0%
3%
1%
0%
4%
2%
6%
8%
1%
4%
3%
3%
1%
4%
3%
8%
4%
1%
17%
8%
1%
1%
8%
1%
0%
0%
4%
1%
2%
7%
8%
0%
9%
1%
4%
0%
4%
0%
3%
6%
13%
9%
4%
7%
16%
10%
19%
7%
7%
0%
3%
0%
4%
1%
0%
2%
4%
0%
3%
4%
7%
2%
5%
2%
1%
1%
2%
11%
1%
9%
9%
2%
0%
10%
5%
1%
17%
4%
0%
11%
0%
4%
2%
7%
0%
What is your biggest concern, if any, about Donald Trump as a candidate for president in 2024? (coded)
Biggest Concern if Trump is 2024 GOP Nominee (coded) - Likely GOP Primary Voters

Incompetence
Indictments or
imprisonment
Narcissistic or
self-obsessed
Personal
retribution during
second term
Potential violence
against him
STATEWIDE November 2023
3%
8%
3%
1%
2%
Voting
Registration
Registered Republican
Registered Undeclared/Not Reg.
Party ID
Independent/Democrat
Republican
Political
Ideology
Moderate
Conservative
Libertarian
Age of
Respondent
18 to 34
35 to 49
50 to 64
65 and older
Gender of
Respondent
Men
Women
Level of
Education
High school or less
Tech school/Some college
College graduate
Postgraduate work
College
Degree
College graduate
Not college graduate
Region of
State
Central/Lakes
Connecticut Valley
Manchester Area
Mass Border
North Country
Seacoast
Household
Income
Less than $45,000
$45,000 - $74,999
$75,000 - $99,999
$100,000 - $149,999
$150,000 or more
Media Usage
CNN viewer
Conservative radio listener
Epoch Times reader
Fox News viewer
Joe Rogan listener
Local NH news viewer
Newsmax viewer
NHPR listener
X (formerly Twitter) user
2020 Pres
Vote
Voted for Biden
Voted for Trump
Preferred
Candidate
Trump primary supporter
Not Trump primary supporter
4%
1%
8%
8%
3%
2%
2%
0%
0%
3%
3%
2%
9%
5%
2%
4%
1%
2%
2%
1%
1%
4%
1%
1%
13%
8%
0%
2%
4%
1%
0%
1%
2%
3%
0%
3%
0%
1%
10%
10%
6%
9%
7%
4%
4%
0%
2%
1%
1%
4%
1%
2%
3%
2%
6%
10%
2%
3%
1%
1%
1%
2%
1%
2%
5%
2%
14%
6%
3%
11%
4%
3%
3%
2%
3%
1%
1%
1%
3%
2%
2%
3%
2%
8%
9%
2%
4%
1%
2%
2%
2%
0%
17%
0%
5%
2%
1%
19%
4%
5%
3%
3%
12%
1%
2%
3%
2%
5%
2%
0%
1%
2%
2%
0%
1%
1%
1%
4%
1%
2%
1%
5%
1%
8%
8%
14%
5%
16%
5%
3%
1%
3%
0%
1%
2%
0%
1%
1%
2%
2%
1%
4%
0%
1%
3%
2%
0%
3%
3%
5%
12%
8%
10%
8%
2%
14%
2%
9%
11%
2%
4%
2%
3%
0%
2%
1%
1%
3%
1%
2%
0%
1%
1%
1%
1%
1%
6%
3%
1%
3%
4%
4%
4%
0%
3%
3%
9%
6%
2%
4%
1%
3%
2%
2%
3%
9%
7%
4%
0%
1%
0%
0%
4%
What is your biggest concern, if any, about Donald Trump as a candidate for president in 2024? (coded)
Biggest Concern if Trump is 2024 GOP Nominee (coded) - Likely GOP Primary Voters

Result in
election fraud
Will undermine/
destroy
democracy
Other None
Don't know/Not
sure
STATEWIDE November 2023
4%
6%
7%
16%
0%
N
865
Voting
Registration
Registered Republican
Registered Undeclared/Not Reg.
Party ID
Independent/Democrat
Republican
Political
Ideology
Moderate
Conservative
Libertarian
Age of
Respondent
18 to 34
35 to 49
50 to 64
65 and older
Gender of
Respondent
Men
Women
Level of
Education
High school or less
Tech school/Some college
College graduate
Postgraduate work
College
Degree
College graduate
Not college graduate
Region of
State
Central/Lakes
Connecticut Valley
Manchester Area
Mass Border
North Country
Seacoast
Household
Income
Less than $45,000
$45,000 - $74,999
$75,000 - $99,999
$100,000 - $149,999
$150,000 or more
Media Usage
CNN viewer
Conservative radio listener
Epoch Times reader
Fox News viewer
Joe Rogan listener
Local NH news viewer
Newsmax viewer
NHPR listener
X (formerly Twitter) user
2020 Pres
Vote
Voted for Biden
Voted for Trump
Preferred
Candidate
Trump primary supporter
Not Trump primary supporter
1%
7%
11%
3%
9%
6%
7%
23%
0%
6%
1%
1%
21%
7%
7%
20%
2%
0%
3%
8%
1%
0%
0%
13%
8%
8%
8%
24%
15%
13%
0%
7%
6%
2%
7%
6%
7%
5%
7%
5%
4%
16%
17%
13%
27%
4%
0%
6%
3%
6%
6%
3%
11%
22%
10%
0%
3%
4%
4%
6%
12%
12%
6%
1%
3%
13%
5%
8%
8%
6%
16%
24%
0%
5%
3%
3%
12%
6%
9%
20%
7%
0%
2%
3%
1%
7%
2%
11%
9%
8%
9%
6%
4%
3%
17%
2%
8%
7%
0%
7%
8%
24%
9%
16%
24%
20%
1%
6%
3%
5%
1%
1%
10%
10%
3%
4%
7%
1%
15%
6%
3%
22%
10%
8%
15%
11%
30%
8%
5%
9%
2%
3%
5%
11%
3%
1%
16%
9%
0%
3%
0%
18%
9%
8%
8%
7%
7%
8%
8%
12%
9%
11%
2%
24%
10%
35%
13%
15%
19%
4%
0%
0%
0%
0%
6%
1%
28%
8%
3%
20%
0%
0%
0%
11%
11%
5%
11%
2%
37%
0%
391
471
635
225
132
387
233
244
309
175
131
392
468
118
185
260
299
558
303
140
75
203
128
131
181
172
128
175
170
84
184
195
163
506
142
281
102
207
158
659
175
509
340
What is your biggest concern, if any, about Donald Trump as a candidate for president in 2024? (coded)
Biggest Concern if Trump is 2024 GOP Nominee (coded) - Likely GOP Primary Voters

Very good Good Fair Poor Very poor
Don't
know/Not
sure
STATEWIDE November 2023
47%
20%
9%
5%
17%
1%
N
949
Voting
Registration
Registered Republican
Registered Undeclared/Not Reg.
Party ID
Independent/Democrat
Republican
Political
Ideology
Moderate
Conservative
Libertarian
Age of
Respondent
18 to 34
35 to 49
50 to 64
65 and older
Gender of
Respondent
Men
Women
Level of
Education
High school or less
Tech school/Some college
College graduate
Postgraduate work
College
Degree
College graduate
Not college graduate
Region of
State
Central/Lakes
Connecticut Valley
Manchester Area
Mass Border
North Country
Seacoast
Household
Income
Less than $45,000
$45,000 - $74,999
$75,000 - $99,999
$100,000 - $149,999
$150,000 or more
Media Usage
CNN viewer
Conservative radio listener
Epoch Times reader
Fox News viewer
Joe Rogan listener
Local NH news viewer
Newsmax viewer
NHPR listener
X (formerly Twitter) user
2020 Pres
Vote
Voted for Biden
Voted for Trump
Preferred
Candidate
Trump primary supporter
Not Trump primary supporter
30%
60%
20%
21%
9%
9%
8%
3%
33%
5%
1%
1%
58%
14%
24%
10%
9%
9%
3%
10%
4%
56%
1%
1%
63%
67%
17%
22%
21%
19%
8%
7%
17%
4%
3%
8%
3%
1%
38%
2%
1%
60%
44%
43%
35%
8%
19%
27%
37%
6%
12%
7%
10%
7%
4%
6%
5%
16%
21%
16%
13%
4%
1%
50%
44%
17%
23%
8%
10%
2%
8%
22%
13%
1%
2%
31%
35%
54%
53%
18%
17%
16%
26%
10%
14%
8%
7%
9%
8%
5%
3%
33%
25%
15%
9%
1%
1%
2%
54%
33%
22%
17%
8%
12%
4%
8%
12%
28%
1%
0%
44%
60%
38%
51%
53%
46%
19%
20%
21%
9%
30%
23%
14%
3%
8%
13%
4%
10%
5%
7%
7%
3%
4%
5%
17%
10%
26%
19%
8%
16%
1%
5%
0%
43%
42%
44%
50%
50%
23%
13%
26%
27%
13%
8%
14%
3%
9%
15%
8%
6%
6%
6%
1%
18%
22%
21%
8%
20%
3%
1%
2%
51%
16%
84%
37%
54%
64%
67%
61%
14%
24%
20%
11%
21%
39%
18%
25%
28%
19%
10%
9%
2%
11%
5%
7%
7%
6%
8%
4%
13%
0%
7%
1%
4%
0%
1%
12%
12%
40%
2%
22%
1%
4%
0%
2%
42%
2%
0%
2%
2%
3%
4%
61%
1%
24%
1%
10%
5%
4%
11%
1%
81%
1%
1%
20%
84%
26%
13%
13%
3%
9%
0%
30%
0%
2%
410
536
704
241
139
434
260
251
357
182
153
428
517
124
197
270
355
626
320
160
91
216
151
134
191
180
160
184
172
85
225
202
172
568
161
320
126
223
162
732
187
535
395
How would you rate Donald Trump on each of the following attributes? Policy positions on major issues
Rang of Donald Trump's Policy Posions on Major Issues - Likely GOP Primary Voters

Very good or good Fair Very poor or poor Don't know/Not sure
STATEWIDE November 2023
67%
9%
22%
1%
N
949
Voting
Registration
Registered Republican
Registered Undeclared/Not Reg.
Party ID
Independent/Democrat
Republican
Political
Ideology
Moderate
Conservative
Libertarian
Age of
Respondent
18 to 34
35 to 49
50 to 64
65 and older
Gender of
Respondent
Men
Women
Level of
Education
High school or less
Tech school/Some college
College graduate
Postgraduate work
College
Degree
College graduate
Not college graduate
Region of
State
Central/Lakes
Connecticut Valley
Manchester Area
Mass Border
North Country
Seacoast
Household
Income
Less than $45,000
$45,000 - $74,999
$75,000 - $99,999
$100,000 - $149,999
$150,000 or more
Media Usage
CNN viewer
Conservative radio listener
Epoch Times reader
Fox News viewer
Joe Rogan listener
Local NH news viewer
Newsmax viewer
NHPR listener
X (formerly Twitter) user
2020 Pres
Vote
Voted for Biden
Voted for Trump
Preferred
Candidate
Trump primary supporter
Not Trump primary supporter
49%
81%
9%
9%
40%
8%
1%
1%
82%
24%
9%
9%
7%
66%
1%
1%
85%
88%
37%
8%
7%
17%
7%
4%
46%
2%
1%
68%
63%
70%
72%
6%
12%
7%
10%
22%
25%
22%
18%
4%
1%
68%
67%
8%
10%
24%
21%
1%
2%
49%
52%
71%
79%
10%
14%
8%
7%
41%
33%
20%
12%
1%
1%
2%
76%
51%
8%
12%
15%
36%
1%
0%
63%
80%
59%
60%
83%
69%
14%
3%
8%
13%
4%
10%
22%
17%
32%
21%
13%
21%
1%
5%
0%
66%
55%
70%
77%
63%
8%
14%
3%
9%
15%
26%
28%
27%
14%
21%
3%
1%
2%
75%
36%
95%
58%
93%
82%
92%
88%
34%
10%
9%
2%
11%
5%
7%
7%
6%
8%
16%
54%
3%
30%
2%
8%
1%
2%
54%
2%
0%
2%
2%
3%
4%
85%
2%
10%
5%
4%
92%
1%
1%
46%
97%
13%
3%
39%
0%
2%
410
536
704
241
139
434
260
251
357
182
153
428
517
124
197
270
355
626
320
160
91
216
151
134
191
180
160
184
172
85
225
202
172
568
161
320
126
223
162
732
187
535
395
How would you rate Donald Trump on each of the following attributes? Policy positions on major issues
Rang of Donald Trump's Policy Posions on Major Issues - Likely GOP Primary Voters

Very good Good Fair Poor Very poor
Don't
know/Not
sure
STATEWIDE November 2023
28%
18%
18%
8%
28%
0%
N
952
Voting
Registration
Registered Republican
Registered Undeclared/Not Reg.
Party ID
Independent/Democrat
Republican
Political
Ideology
Moderate
Conservative
Libertarian
Age of
Respondent
18 to 34
35 to 49
50 to 64
65 and older
Gender of
Respondent
Men
Women
Level of
Education
High school or less
Tech school/Some college
College graduate
Postgraduate work
College
Degree
College graduate
Not college graduate
Region of
State
Central/Lakes
Connecticut Valley
Manchester Area
Mass Border
North Country
Seacoast
Household
Income
Less than $45,000
$45,000 - $74,999
$75,000 - $99,999
$100,000 - $149,999
$150,000 or more
Media Usage
CNN viewer
Conservative radio listener
Epoch Times reader
Fox News viewer
Joe Rogan listener
Local NH news viewer
Newsmax viewer
NHPR listener
X (formerly Twitter) user
2020 Pres
Vote
Voted for Biden
Voted for Trump
Preferred
Candidate
Trump primary supporter
Not Trump primary supporter
12%
39%
10%
24%
23%
14%
10%
7%
44%
15%
0%
0%
36%
3%
24%
2%
16%
24%
10%
2%
14%
70%
0%
0%
39%
42%
4%
15%
24%
15%
26%
15%
19%
12%
10%
7%
9%
9%
55%
0%
1%
31%
25%
29%
26%
25%
18%
24%
11%
17%
13%
37%
4%
9%
7%
14%
28%
31%
26%
23%
0%
0%
1%
27%
28%
15%
21%
21%
15%
7%
9%
29%
27%
0%
0%
17%
22%
24%
37%
11%
12%
23%
20%
12%
20%
21%
16%
5%
8%
8%
10%
54%
37%
24%
17%
1%
1%
0%
31%
20%
21%
11%
18%
17%
9%
7%
20%
44%
0%
1%
29%
20%
26%
41%
28%
22%
18%
40%
12%
11%
8%
29%
7%
6%
21%
13%
38%
18%
10%
15%
4%
8%
8%
8%
35%
19%
37%
28%
18%
23%
1%
1%
0%
25%
35%
15%
27%
37%
15%
9%
26%
18%
20%
20%
9%
23%
26%
18%
6%
13%
1%
11%
2%
34%
34%
35%
18%
24%
0%
0%
39%
11%
65%
19%
35%
38%
55%
42%
8%
12%
10%
19%
15%
23%
27%
14%
32%
8%
15%
8%
9%
16%
33%
14%
25%
10%
10%
13%
8%
1%
11%
3%
7%
2%
10%
9%
21%
62%
5%
38%
6%
14%
4%
6%
65%
0%
0%
0%
0%
0%
36%
23%
0%
22%
0%
9%
1%
10%
98%
0%
3%
62%
10%
28%
26%
6%
12%
3%
48%
0%
0%
0%
410
539
706
241
139
436
260
251
359
182
153
431
517
124
196
273
355
628
320
160
91
219
151
134
191
180
160
184
174
85
225
202
174
570
161
320
126
223
162
734
187
535
398
How would you rate Donald Trump on each of the following attributes? Honesty and integrity
Rang of Donald Trump's Honesty & Integrity - Likely GOP Primary Voters

Very good or good Fair Very poor or poor Don't know/Not sure
STATEWIDE November 2023
46%
18%
36%
0%
N
952
Voting
Registration
Registered Republican
Registered Undeclared/Not Reg.
Party ID
Independent/Democrat
Republican
Political
Ideology
Moderate
Conservative
Libertarian
Age of
Respondent
18 to 34
35 to 49
50 to 64
65 and older
Gender of
Respondent
Men
Women
Level of
Education
High school or less
Tech school/Some college
College graduate
Postgraduate work
College
Degree
College graduate
Not college graduate
Region of
State
Central/Lakes
Connecticut Valley
Manchester Area
Mass Border
North Country
Seacoast
Household
Income
Less than $45,000
$45,000 - $74,999
$75,000 - $99,999
$100,000 - $149,999
$150,000 or more
Media Usage
CNN viewer
Conservative radio listener
Epoch Times reader
Fox News viewer
Joe Rogan listener
Local NH news viewer
Newsmax viewer
NHPR listener
X (formerly Twitter) user
2020 Pres
Vote
Voted for Biden
Voted for Trump
Preferred
Candidate
Trump primary supporter
Not Trump primary supporter
22%
63%
23%
14%
55%
22%
0%
0%
60%
4%
16%
24%
24%
72%
0%
0%
53%
66%
19%
26%
15%
19%
21%
18%
62%
0%
1%
56%
43%
53%
26%
11%
17%
13%
37%
33%
40%
33%
37%
0%
0%
1%
42%
48%
21%
15%
36%
36%
0%
0%
28%
34%
46%
57%
12%
20%
21%
16%
59%
45%
32%
27%
1%
1%
0%
53%
32%
18%
17%
29%
50%
0%
1%
47%
59%
38%
52%
36%
50%
7%
6%
21%
13%
38%
18%
45%
34%
42%
36%
26%
32%
1%
1%
0%
40%
43%
41%
45%
56%
20%
9%
23%
26%
18%
40%
47%
35%
29%
26%
0%
0%
51%
21%
85%
35%
58%
65%
69%
74%
16%
15%
8%
9%
16%
33%
14%
25%
10%
10%
34%
70%
6%
49%
9%
21%
6%
15%
74%
0%
0%
0%
0%
0%
59%
0%
22%
0%
18%
99%
0%
13%
90%
26%
6%
61%
3%
0%
0%
410
539
706
241
139
436
260
251
359
182
153
431
517
124
196
273
355
628
320
160
91
219
151
134
191
180
160
184
174
85
225
202
174
570
161
320
126
223
162
734
187
535
398
How would you rate Donald Trump on each of the following attributes? Honesty and integrity
Rang of Donald Trump's Honesty & Integrity - Likely GOP Primary Voters

Very good Good Fair Poor Very poor
Don't
know/Not
sure
STATEWIDE November 2023
16%
21%
19%
13%
30%
0%
N
950
Voting
Registration
Registered Republican
Registered Undeclared/Not Reg.
Party ID
Independent/Democrat
Republican
Political
Ideology
Moderate
Conservative
Libertarian
Age of
Respondent
18 to 34
35 to 49
50 to 64
65 and older
Gender of
Respondent
Men
Women
Level of
Education
High school or less
Tech school/Some college
College graduate
Postgraduate work
College
Degree
College graduate
Not college graduate
Region of
State
Central/Lakes
Connecticut Valley
Manchester Area
Mass Border
North Country
Seacoast
Household
Income
Less than $45,000
$45,000 - $74,999
$75,000 - $99,999
$100,000 - $149,999
$150,000 or more
Media Usage
CNN viewer
Conservative radio listener
Epoch Times reader
Fox News viewer
Joe Rogan listener
Local NH news viewer
Newsmax viewer
NHPR listener
X (formerly Twitter) user
2020 Pres
Vote
Voted for Biden
Voted for Trump
Preferred
Candidate
Trump primary supporter
Not Trump primary supporter
7%
24%
13%
27%
22%
16%
11%
16%
47%
18%
1%
21%
3%
25%
10%
20%
14%
17%
4%
17%
69%
0%
13%
24%
5%
41%
25%
11%
14%
22%
15%
11%
17%
14%
19%
11%
55%
2%
0%
18%
17%
11%
17%
19%
16%
34%
19%
22%
14%
16%
26%
9%
19%
11%
9%
31%
34%
26%
28%
0%
1%
17%
16%
23%
20%
13%
23%
16%
11%
30%
31%
0%
0%
11%
9%
16%
22%
7%
17%
25%
25%
17%
20%
20%
18%
12%
17%
9%
15%
53%
37%
28%
21%
0%
1%
19%
10%
25%
13%
19%
19%
12%
15%
24%
43%
0%
0%
13%
15%
15%
30%
9%
16%
13%
23%
12%
15%
35%
30%
24%
27%
15%
15%
23%
15%
13%
18%
19%
9%
8%
14%
37%
17%
39%
31%
25%
26%
0%
1%
0%
20%
18%
9%
11%
29%
10%
16%
38%
17%
14%
13%
15%
15%
32%
21%
22%
12%
2%
20%
11%
34%
39%
35%
21%
25%
1%
0%
24%
2%
32%
14%
17%
20%
31%
21%
9%
17%
8%
31%
11%
47%
21%
27%
28%
1%
22%
14%
23%
15%
23%
29%
31%
28%
10%
11%
9%
7%
18%
5%
11%
7%
9%
10%
25%
66%
7%
42%
7%
18%
4%
15%
69%
1%
0%
0%
0%
21%
27%
24%
1%
16%
4%
12%
95%
0%
1%
37%
7%
39%
19%
18%
19%
5%
53%
0%
1%
410
537
704
241
139
435
260
249
359
182
153
429
517
124
197
271
355
626
320
160
91
219
151
132
191
180
160
184
174
83
225
202
174
569
161
318
126
223
162
732
187
535
396
How would you rate Donald Trump on each of the following attributes? Temperament
Rang of Donald Trump's Temperament - Likely GOP Primary Voters

Very good or good Fair Very poor or poor Don't know/Not sure
STATEWIDE November 2023
37%
19%
44%
0%
N
950
Voting
Registration
Registered Republican
Registered Undeclared/Not Reg.
Party ID
Independent/Democrat
Republican
Political
Ideology
Moderate
Conservative
Libertarian
Age of
Respondent
18 to 34
35 to 49
50 to 64
65 and older
Gender of
Respondent
Men
Women
Level of
Education
High school or less
Tech school/Some college
College graduate
Postgraduate work
College
Degree
College graduate
Not college graduate
Region of
State
Central/Lakes
Connecticut Valley
Manchester Area
Mass Border
North Country
Seacoast
Household
Income
Less than $45,000
$45,000 - $74,999
$75,000 - $99,999
$100,000 - $149,999
$150,000 or more
Media Usage
CNN viewer
Conservative radio listener
Epoch Times reader
Fox News viewer
Joe Rogan listener
Local NH news viewer
Newsmax viewer
NHPR listener
X (formerly Twitter) user
2020 Pres
Vote
Voted for Biden
Voted for Trump
Preferred
Candidate
Trump primary supporter
Not Trump primary supporter
19%
51%
22%
16%
57%
34%
1%
45%
12%
20%
14%
34%
73%
0%
55%
49%
16%
14%
22%
15%
30%
28%
69%
2%
0%
38%
33%
45%
36%
22%
14%
16%
26%
40%
53%
37%
37%
0%
1%
40%
35%
13%
23%
47%
41%
0%
0%
18%
26%
42%
46%
17%
20%
20%
18%
65%
54%
37%
36%
0%
1%
44%
23%
19%
19%
36%
58%
0%
0%
26%
38%
27%
45%
44%
46%
24%
27%
15%
15%
23%
15%
50%
35%
58%
39%
32%
39%
0%
1%
0%
30%
34%
47%
28%
43%
13%
15%
15%
32%
21%
56%
51%
37%
41%
36%
1%
0%
41%
11%
63%
25%
64%
41%
58%
49%
10%
22%
14%
23%
15%
23%
29%
31%
28%
10%
37%
76%
14%
60%
13%
30%
12%
23%
79%
1%
0%
0%
0%
48%
24%
1%
28%
99%
0%
9%
77%
19%
18%
72%
5%
1%
410
537
704
241
139
435
260
249
359
182
153
429
517
124
197
271
355
626
320
160
91
219
151
132
191
180
160
184
174
83
225
202
174
569
161
318
126
223
162
732
187
535
396
How would you rate Donald Trump on each of the following attributes? Temperament
Rang of Donald Trump's Temperament - Likely GOP Primary Voters

Very good Good Fair Poor Very poor
Don't
know/Not
sure
STATEWIDE November 2023
36%
18%
16%
11%
19%
0%
N
950
Voting
Registration
Registered Republican
Registered Undeclared/Not Reg.
Party ID
Independent/Democrat
Republican
Political
Ideology
Moderate
Conservative
Libertarian
Age of
Respondent
18 to 34
35 to 49
50 to 64
65 and older
Gender of
Respondent
Men
Women
Level of
Education
High school or less
Tech school/Some college
College graduate
Postgraduate work
College
Degree
College graduate
Not college graduate
Region of
State
Central/Lakes
Connecticut Valley
Manchester Area
Mass Border
North Country
Seacoast
Household
Income
Less than $45,000
$45,000 - $74,999
$75,000 - $99,999
$100,000 - $149,999
$150,000 or more
Media Usage
CNN viewer
Conservative radio listener
Epoch Times reader
Fox News viewer
Joe Rogan listener
Local NH news viewer
Newsmax viewer
NHPR listener
X (formerly Twitter) user
2020 Pres
Vote
Voted for Biden
Voted for Trump
Preferred
Candidate
Trump primary supporter
Not Trump primary supporter
17%
50%
21%
17%
15%
16%
15%
8%
32%
10%
0%
0%
44%
11%
20%
13%
17%
12%
10%
14%
9%
50%
0%
36%
52%
7%
39%
15%
22%
6%
21%
18%
9%
8%
18%
10%
5%
36%
0%
0%
36%
35%
40%
32%
19%
14%
22%
23%
12%
20%
14%
12%
13%
9%
5%
17%
18%
22%
19%
16%
1%
38%
34%
13%
23%
15%
17%
11%
11%
24%
16%
0%
0%
23%
20%
33%
51%
17%
20%
23%
15%
13%
24%
12%
15%
12%
11%
12%
10%
36%
26%
19%
10%
1%
43%
21%
19%
19%
14%
20%
11%
11%
14%
30%
0%
31%
38%
32%
46%
43%
28%
12%
15%
19%
15%
29%
21%
29%
18%
15%
10%
4%
16%
7%
18%
8%
10%
15%
12%
21%
12%
26%
18%
8%
23%
0%
1%
42%
25%
26%
42%
38%
9%
15%
34%
14%
24%
16%
22%
12%
15%
12%
12%
11%
7%
15%
9%
22%
26%
20%
13%
18%
1%
50%
11%
67%
28%
50%
44%
68%
43%
12%
13%
13%
12%
14%
37%
24%
14%
26%
11%
14%
14%
12%
19%
5%
15%
12%
15%
16%
10%
20%
2%
13%
1%
7%
4%
13%
16%
13%
41%
6%
25%
7%
10%
3%
3%
45%
0%
0%
0%
0%
46%
1%
22%
4%
18%
7%
8%
15%
6%
71%
0%
14%
66%
17%
20%
20%
9%
15%
4%
33%
0%
0%
408
539
706
239
139
436
258
250
358
182
153
430
516
124
197
271
355
626
320
160
91
218
151
134
190
180
158
184
174
85
225
202
174
569
161
320
126
223
162
734
185
533
398
How would you rate Donald Trump on each of the following attributes? Communication skills
Rang of Donald Trump's Communicaon Skills - Likely GOP Primary Voters

Very good or good Fair Very poor or poor Don't know/Not sure
STATEWIDE November 2023
54%
16%
30%
0%
N
950
Voting
Registration
Registered Republican
Registered Undeclared/Not Reg.
Party ID
Independent/Democrat
Republican
Political
Ideology
Moderate
Conservative
Libertarian
Age of
Respondent
18 to 34
35 to 49
50 to 64
65 and older
Gender of
Respondent
Men
Women
Level of
Education
High school or less
Tech school/Some college
College graduate
Postgraduate work
College
Degree
College graduate
Not college graduate
Region of
State
Central/Lakes
Connecticut Valley
Manchester Area
Mass Border
North Country
Seacoast
Household
Income
Less than $45,000
$45,000 - $74,999
$75,000 - $99,999
$100,000 - $149,999
$150,000 or more
Media Usage
CNN viewer
Conservative radio listener
Epoch Times reader
Fox News viewer
Joe Rogan listener
Local NH news viewer
Newsmax viewer
NHPR listener
X (formerly Twitter) user
2020 Pres
Vote
Voted for Biden
Voted for Trump
Preferred
Candidate
Trump primary supporter
Not Trump primary supporter
38%
66%
15%
16%
47%
17%
0%
0%
64%
24%
17%
12%
18%
64%
0%
75%
67%
29%
6%
21%
18%
19%
12%
53%
0%
0%
56%
49%
62%
55%
12%
20%
14%
12%
32%
31%
24%
33%
1%
51%
57%
15%
17%
34%
27%
0%
0%
39%
39%
56%
66%
13%
24%
12%
15%
48%
37%
31%
19%
1%
62%
39%
14%
20%
24%
41%
0%
43%
53%
51%
61%
72%
49%
29%
18%
15%
10%
4%
16%
28%
29%
34%
28%
23%
34%
0%
1%
51%
40%
60%
56%
62%
16%
22%
12%
15%
12%
34%
37%
27%
28%
26%
1%
63%
24%
80%
43%
87%
68%
81%
69%
23%
14%
14%
12%
19%
5%
15%
12%
15%
16%
23%
62%
8%
39%
8%
17%
7%
16%
61%
0%
0%
0%
0%
68%
5%
18%
7%
14%
87%
0%
30%
86%
20%
9%
49%
5%
0%
408
539
706
239
139
436
258
250
358
182
153
430
516
124
197
271
355
626
320
160
91
218
151
134
190
180
158
184
174
85
225
202
174
569
161
320
126
223
162
734
185
533
398
How would you rate Donald Trump on each of the following attributes? Communication skills
Rang of Donald Trump's Communicaon Skills - Likely GOP Primary Voters

Very good Good Fair Poor Very poor
Don't
know/Not
sure
STATEWIDE November 2023
43%
23%
7%
8%
20%
0%
N
951
Voting
Registration
Registered Republican
Registered Undeclared/Not Reg.
Party ID
Independent/Democrat
Republican
Political
Ideology
Moderate
Conservative
Libertarian
Age of
Respondent
18 to 34
35 to 49
50 to 64
65 and older
Gender of
Respondent
Men
Women
Level of
Education
High school or less
Tech school/Some college
College graduate
Postgraduate work
College
Degree
College graduate
Not college graduate
Region of
State
Central/Lakes
Connecticut Valley
Manchester Area
Mass Border
North Country
Seacoast
Household
Income
Less than $45,000
$45,000 - $74,999
$75,000 - $99,999
$100,000 - $149,999
$150,000 or more
Media Usage
CNN viewer
Conservative radio listener
Epoch Times reader
Fox News viewer
Joe Rogan listener
Local NH news viewer
Newsmax viewer
NHPR listener
X (formerly Twitter) user
2020 Pres
Vote
Voted for Biden
Voted for Trump
Preferred
Candidate
Trump primary supporter
Not Trump primary supporter
23%
59%
24%
21%
9%
6%
9%
6%
35%
8%
0%
56%
5%
24%
18%
7%
6%
7%
9%
6%
61%
0%
0%
37%
67%
19%
39%
20%
20%
9%
6%
8%
11%
5%
10%
5%
2%
43%
0%
0%
56%
43%
42%
23%
11%
22%
26%
40%
3%
8%
10%
8%
10%
7%
4%
11%
20%
21%
18%
18%
0%
0%
46%
41%
19%
25%
8%
6%
4%
11%
23%
17%
0%
0%
27%
30%
49%
51%
14%
21%
21%
28%
12%
10%
7%
3%
11%
11%
5%
7%
36%
28%
18%
11%
0%
0%
50%
29%
25%
18%
5%
11%
6%
11%
14%
31%
0%
0%
43%
53%
33%
48%
37%
50%
18%
27%
25%
11%
37%
22%
12%
2%
5%
10%
5%
5%
4%
8%
7%
10%
12%
5%
22%
10%
29%
21%
10%
17%
0%
0%
0%
37%
38%
38%
48%
48%
27%
20%
25%
29%
15%
5%
7%
8%
6%
13%
9%
11%
7%
6%
1%
23%
25%
22%
11%
23%
0%
48%
17%
78%
37%
38%
63%
60%
56%
14%
25%
11%
15%
18%
51%
16%
31%
27%
13%
5%
9%
2%
8%
5%
6%
5%
6%
9%
7%
16%
1%
11%
1%
6%
2%
9%
14%
15%
47%
4%
26%
5%
9%
3%
3%
50%
0%
0%
0%
0%
0%
56%
1%
29%
0%
8%
3%
6%
10%
2%
86%
0%
0%
16%
80%
26%
17%
10%
3%
13%
0%
34%
0%
410
538
705
241
139
436
260
250
359
182
153
431
516
124
197
272
355
627
320
160
91
219
151
134
191
180
160
184
174
85
225
202
174
570
161
320
126
223
162
733
187
535
398
How would you rate Donald Trump on each of the following attributes? Decision-making
Rang of Donald Trump's Decision-making - Likely GOP Primary Voters

Very good or good Fair Very poor or poor Don't know/Not sure
STATEWIDE November 2023
66%
7%
27%
0%
N
951
Voting
Registration
Registered Republican
Registered Undeclared/Not Reg.
Party ID
Independent/Democrat
Republican
Political
Ideology
Moderate
Conservative
Libertarian
Age of
Respondent
18 to 34
35 to 49
50 to 64
65 and older
Gender of
Respondent
Men
Women
Level of
Education
High school or less
Tech school/Some college
College graduate
Postgraduate work
College
Degree
College graduate
Not college graduate
Region of
State
Central/Lakes
Connecticut Valley
Manchester Area
Mass Border
North Country
Seacoast
Household
Income
Less than $45,000
$45,000 - $74,999
$75,000 - $99,999
$100,000 - $149,999
$150,000 or more
Media Usage
CNN viewer
Conservative radio listener
Epoch Times reader
Fox News viewer
Joe Rogan listener
Local NH news viewer
Newsmax viewer
NHPR listener
X (formerly Twitter) user
2020 Pres
Vote
Voted for Biden
Voted for Trump
Preferred
Candidate
Trump primary supporter
Not Trump primary supporter
47%
80%
9%
6%
45%
14%
0%
80%
23%
7%
6%
13%
70%
0%
0%
76%
86%
39%
9%
6%
8%
16%
8%
53%
0%
0%
67%
64%
68%
63%
3%
8%
10%
8%
29%
28%
22%
29%
0%
0%
65%
66%
8%
6%
27%
28%
0%
0%
41%
51%
70%
79%
12%
10%
7%
3%
47%
39%
23%
18%
0%
0%
75%
47%
5%
11%
20%
42%
0%
0%
61%
79%
58%
59%
73%
72%
12%
2%
5%
10%
5%
5%
27%
18%
37%
31%
22%
22%
0%
0%
0%
63%
58%
63%
77%
63%
5%
7%
8%
6%
13%
31%
36%
29%
17%
24%
0%
72%
28%
93%
55%
89%
79%
91%
82%
27%
5%
9%
2%
8%
5%
6%
5%
6%
9%
23%
64%
5%
37%
6%
15%
4%
12%
64%
0%
0%
0%
0%
0%
84%
1%
8%
3%
8%
96%
0%
0%
42%
97%
10%
3%
48%
0%
0%
410
538
705
241
139
436
260
250
359
182
153
431
516
124
197
272
355
627
320
160
91
219
151
134
191
180
160
184
174
85
225
202
174
570
161
320
126
223
162
733
187
535
398
How would you rate Donald Trump on each of the following attributes? Decision-making
Rang of Donald Trump's Decision-making - Likely GOP Primary Voters

Very good Good Fair Poor Very poor
Don't
know/Not
sure
STATEWIDE November 2023
42%
18%
10%
6%
23%
0%
N
950
Voting
Registration
Registered Republican
Registered Undeclared/Not Reg.
Party ID
Independent/Democrat
Republican
Political
Ideology
Moderate
Conservative
Libertarian
Age of
Respondent
18 to 34
35 to 49
50 to 64
65 and older
Gender of
Respondent
Men
Women
Level of
Education
High school or less
Tech school/Some college
College graduate
Postgraduate work
College
Degree
College graduate
Not college graduate
Region of
State
Central/Lakes
Connecticut Valley
Manchester Area
Mass Border
North Country
Seacoast
Household
Income
Less than $45,000
$45,000 - $74,999
$75,000 - $99,999
$100,000 - $149,999
$150,000 or more
Media Usage
CNN viewer
Conservative radio listener
Epoch Times reader
Fox News viewer
Joe Rogan listener
Local NH news viewer
Newsmax viewer
NHPR listener
X (formerly Twitter) user
2020 Pres
Vote
Voted for Biden
Voted for Trump
Preferred
Candidate
Trump primary supporter
Not Trump primary supporter
22%
58%
19%
17%
13%
8%
5%
8%
41%
9%
0%
0%
55%
5%
20%
11%
9%
15%
7%
5%
9%
64%
0%
0%
46%
65%
13%
30%
19%
17%
6%
8%
12%
1%
4%
13%
16%
4%
44%
1%
0%
0%
50%
42%
45%
26%
13%
18%
19%
25%
4%
9%
11%
23%
11%
7%
3%
2%
21%
24%
22%
24%
1%
0%
44%
41%
19%
17%
9%
11%
3%
9%
24%
22%
0%
0%
28%
39%
43%
49%
17%
9%
23%
19%
8%
16%
6%
11%
9%
6%
4%
8%
39%
30%
24%
13%
0%
1%
1%
46%
34%
21%
12%
9%
13%
6%
7%
18%
33%
0%
0%
44%
28%
45%
51%
39%
42%
7%
46%
12%
8%
21%
26%
13%
4%
9%
10%
16%
7%
12%
7%
6%
9%
3%
3%
23%
15%
28%
22%
21%
22%
1%
1%
1%
49%
45%
29%
45%
49%
13%
14%
28%
19%
10%
9%
3%
14%
16%
15%
5%
8%
7%
6%
2%
24%
30%
23%
14%
24%
0%
0%
1%
0%
50%
15%
80%
36%
47%
57%
73%
59%
11%
9%
14%
9%
14%
33%
18%
4%
19%
16%
13%
6%
3%
9%
15%
8%
18%
7%
7%
8%
4%
2%
10%
1%
6%
1%
3%
10%
20%
61%
5%
31%
5%
10%
5%
10%
56%
0%
1%
1%
1%
1%
0%
1%
0%
55%
1%
23%
0%
12%
3%
6%
8%
4%
88%
0%
0%
17%
77%
17%
19%
15%
3%
11%
1%
40%
0%
1%
0%
410
537
704
241
139
435
260
249
359
182
153
431
515
124
196
272
355
627
320
159
91
219
150
134
191
180
160
184
173
84
225
202
174
570
160
319
126
222
162
732
187
534
397
How would you rate Donald Trump on each of the following attributes? Ability to understand the problems facing people like you
Rang of Donald Trump's Ability to Understand Problems Facing People Like You - Likely GOP Primary Voters

Very good or good Fair Very poor or poor Don't know/Not sure
STATEWIDE November 2023
60%
10%
29%
0%
N
950
Voting
Registration
Registered Republican
Registered Undeclared/Not Reg.
Party ID
Independent/Democrat
Republican
Political
Ideology
Moderate
Conservative
Libertarian
Age of
Respondent
18 to 34
35 to 49
50 to 64
65 and older
Gender of
Respondent
Men
Women
Level of
Education
High school or less
Tech school/Some college
College graduate
Postgraduate work
College
Degree
College graduate
Not college graduate
Region of
State
Central/Lakes
Connecticut Valley
Manchester Area
Mass Border
North Country
Seacoast
Household
Income
Less than $45,000
$45,000 - $74,999
$75,000 - $99,999
$100,000 - $149,999
$150,000 or more
Media Usage
CNN viewer
Conservative radio listener
Epoch Times reader
Fox News viewer
Joe Rogan listener
Local NH news viewer
Newsmax viewer
NHPR listener
X (formerly Twitter) user
2020 Pres
Vote
Voted for Biden
Voted for Trump
Preferred
Candidate
Trump primary supporter
Not Trump primary supporter
41%
75%
13%
8%
46%
17%
0%
0%
75%
16%
9%
15%
16%
69%
0%
0%
76%
84%
30%
6%
8%
12%
17%
8%
58%
1%
0%
0%
63%
59%
64%
51%
4%
9%
11%
23%
32%
31%
25%
26%
1%
0%
63%
58%
9%
11%
27%
31%
0%
0%
45%
48%
66%
68%
8%
16%
6%
11%
47%
36%
28%
21%
0%
1%
1%
67%
47%
9%
13%
24%
40%
0%
0%
51%
74%
57%
59%
60%
68%
13%
4%
9%
10%
16%
7%
35%
22%
34%
31%
24%
25%
1%
1%
1%
62%
59%
57%
64%
59%
9%
3%
14%
16%
15%
29%
38%
29%
19%
26%
0%
0%
1%
0%
59%
29%
89%
50%
80%
76%
76%
78%
27%
13%
6%
3%
9%
15%
8%
18%
7%
7%
28%
65%
7%
40%
6%
16%
5%
14%
65%
0%
1%
1%
1%
1%
0%
1%
0%
77%
1%
12%
3%
10%
96%
0%
0%
33%
96%
15%
3%
51%
1%
1%
0%
410
537
704
241
139
435
260
249
359
182
153
431
515
124
196
272
355
627
320
159
91
219
150
134
191
180
160
184
173
84
225
202
174
570
160
319
126
222
162
732
187
534
397
How would you rate Donald Trump on each of the following attributes? Ability to understand the problems facing people like you
Rang of Donald Trump's Ability to Understand Problems Facing People Like You - Likely GOP Primary Voters

Very good Good Fair Poor Very poor
Don't
know/Not
sure
STATEWIDE November 2023
43%
20%
12%
7%
17%
0%
N
951
Voting
Registration
Registered Republican
Registered Undeclared/Not Reg.
Party ID
Independent/Democrat
Republican
Political
Ideology
Moderate
Conservative
Libertarian
Age of
Respondent
18 to 34
35 to 49
50 to 64
65 and older
Gender of
Respondent
Men
Women
Level of
Education
High school or less
Tech school/Some college
College graduate
Postgraduate work
College
Degree
College graduate
Not college graduate
Region of
State
Central/Lakes
Connecticut Valley
Manchester Area
Mass Border
North Country
Seacoast
Household
Income
Less than $45,000
$45,000 - $74,999
$75,000 - $99,999
$100,000 - $149,999
$150,000 or more
Media Usage
CNN viewer
Conservative radio listener
Epoch Times reader
Fox News viewer
Joe Rogan listener
Local NH news viewer
Newsmax viewer
NHPR listener
X (formerly Twitter) user
2020 Pres
Vote
Voted for Biden
Voted for Trump
Preferred
Candidate
Trump primary supporter
Not Trump primary supporter
30%
53%
15%
24%
13%
12%
12%
4%
30%
6%
1%
0%
51%
20%
25%
8%
14%
6%
4%
16%
5%
50%
0%
0%
56%
58%
16%
16%
21%
28%
15%
15%
9%
9%
3%
15%
3%
3%
33%
1%
0%
56%
34%
38%
48%
12%
26%
27%
14%
8%
13%
13%
17%
6%
7%
11%
6%
18%
20%
10%
15%
0%
0%
1%
45%
42%
18%
22%
13%
12%
5%
9%
20%
14%
0%
0%
21%
33%
47%
54%
25%
23%
17%
19%
10%
14%
10%
14%
11%
8%
13%
2%
32%
23%
12%
12%
1%
1%
51%
28%
18%
24%
12%
12%
7%
9%
12%
26%
0%
0%
39%
36%
33%
46%
63%
46%
24%
28%
18%
20%
10%
23%
14%
21%
15%
10%
11%
5%
7%
5%
8%
10%
3%
9%
16%
9%
25%
14%
12%
16%
0%
0%
1%
0%
32%
42%
42%
55%
47%
21%
16%
17%
16%
28%
19%
9%
15%
10%
1%
8%
11%
3%
11%
6%
19%
21%
23%
7%
18%
1%
1%
54%
14%
79%
32%
62%
59%
71%
52%
17%
20%
15%
14%
20%
27%
21%
21%
31%
15%
8%
15%
2%
15%
7%
7%
1%
11%
13%
7%
15%
3%
10%
4%
7%
5%
4%
19%
11%
40%
2%
22%
1%
5%
1%
2%
36%
1%
0%
0%
0%
0%
0%
56%
1%
26%
2%
12%
8%
3%
20%
3%
70%
0%
0%
19%
76%
20%
20%
19%
4%
12%
1%
29%
1%
409
539
706
240
139
436
260
251
358
182
153
430
517
124
196
273
355
628
320
159
91
219
151
134
191
180
160
184
174
85
225
201
174
570
161
320
126
223
162
734
187
534
398
How would you rate Donald Trump on each of the following attributes? Physical and mental fitness
Rang of Donald Trump's Physical & Mental Fitness - Likely GOP Primary Voters

Very good or good Fair Very poor or poor Don't know/Not sure
STATEWIDE November 2023
63%
12%
24%
0%
N
951
Voting
Registration
Registered Republican
Registered Undeclared/Not Reg.
Party ID
Independent/Democrat
Republican
Political
Ideology
Moderate
Conservative
Libertarian
Age of
Respondent
18 to 34
35 to 49
50 to 64
65 and older
Gender of
Respondent
Men
Women
Level of
Education
High school or less
Tech school/Some college
College graduate
Postgraduate work
College
Degree
College graduate
Not college graduate
Region of
State
Central/Lakes
Connecticut Valley
Manchester Area
Mass Border
North Country
Seacoast
Household
Income
Less than $45,000
$45,000 - $74,999
$75,000 - $99,999
$100,000 - $149,999
$150,000 or more
Media Usage
CNN viewer
Conservative radio listener
Epoch Times reader
Fox News viewer
Joe Rogan listener
Local NH news viewer
Newsmax viewer
NHPR listener
X (formerly Twitter) user
2020 Pres
Vote
Voted for Biden
Voted for Trump
Preferred
Candidate
Trump primary supporter
Not Trump primary supporter
45%
77%
13%
12%
41%
11%
1%
0%
75%
28%
14%
6%
10%
65%
0%
0%
72%
79%
44%
15%
15%
9%
11%
6%
47%
1%
0%
68%
60%
65%
62%
8%
13%
13%
17%
24%
27%
21%
21%
0%
0%
1%
62%
64%
13%
12%
25%
23%
0%
0%
46%
56%
65%
72%
10%
14%
10%
14%
43%
30%
25%
13%
1%
1%
69%
52%
12%
12%
18%
35%
0%
0%
63%
64%
51%
67%
73%
70%
14%
21%
15%
10%
11%
5%
23%
14%
33%
24%
16%
25%
0%
0%
1%
0%
53%
58%
59%
71%
75%
19%
9%
15%
10%
1%
26%
32%
26%
18%
24%
1%
1%
73%
29%
93%
53%
89%
81%
93%
83%
32%
8%
15%
2%
15%
7%
7%
1%
11%
13%
18%
56%
4%
32%
5%
12%
6%
6%
55%
1%
0%
0%
0%
0%
0%
81%
2%
12%
8%
6%
90%
0%
0%
39%
96%
19%
4%
41%
1%
1%
409
539
706
240
139
436
260
251
358
182
153
430
517
124
196
273
355
628
320
159
91
219
151
134
191
180
160
184
174
85
225
201
174
570
161
320
126
223
162
734
187
534
398
How would you rate Donald Trump on each of the following attributes? Physical and mental fitness
Rang of Donald Trump's Physical & Mental Fitness - Likely GOP Primary Voters

Favorable Neutral Unfavorable
Don't know enough
about to say
STATEWIDE November 2023
27%
9%
63%
0%
N
1,943
Voting
Registration
Registered Republican
Registered Undeclared/Not Reg.
Party ID
Independent/Democrat
Republican
Political
Ideology
Moderate
Conservative
Libertarian
Age of
Respondent
18 to 34
35 to 49
50 to 64
65 and older
Gender of
Respondent
Men
Women
Level of
Education
High school or less
Tech school/Some college
College graduate
Postgraduate work
College
Degree
College graduate
Not college graduate
Region of
State
Central/Lakes
Connecticut Valley
Manchester Area
Mass Border
North Country
Seacoast
Household
Income
Less than $45,000
$45,000 - $74,999
$75,000 - $99,999
$100,000 - $149,999
$150,000 or more
Media Usage
CNN viewer
Conservative radio listener
Epoch Times reader
Fox News viewer
Joe Rogan listener
Local NH news viewer
Newsmax viewer
NHPR listener
X (formerly Twitter) user
2020 Pres
Vote
Voted for Biden
Voted for Trump
Preferred
Candidate
Trump primary supporter
Not Trump primary supporter
22%
64%
13%
14%
64%
22%
0%
61%
4%
18%
4%
21%
92%
0%
0%
62%
68%
14%
14%
15%
11%
24%
17%
75%
0%
30%
32%
26%
17%
8%
9%
11%
11%
63%
58%
63%
72%
0%
1%
24%
32%
9%
10%
67%
58%
0%
13%
20%
30%
37%
6%
7%
8%
15%
81%
73%
62%
48%
0%
0%
34%
17%
11%
7%
55%
76%
0%
23%
31%
26%
29%
28%
28%
4%
9%
10%
6%
14%
15%
73%
60%
64%
65%
58%
57%
1%
0%
21%
20%
29%
28%
35%
9%
6%
13%
18%
4%
70%
74%
58%
54%
61%
1%
40%
7%
86%
21%
51%
59%
65%
67%
9%
9%
2%
5%
8%
28%
12%
21%
14%
3%
50%
91%
9%
71%
22%
29%
14%
19%
88%
0%
0%
0%
64%
0%
20%
1%
16%
98%
0%
21%
92%
20%
8%
59%
0%
0%
713
546
772
1,155
161
473
545
487
613
385
450
996
902
296
467
590
585
1,176
763
393
184
422
318
257
360
400
383
315
329
202
340
710
185
1,217
202
366
150
238
454
806
1,053
534
397
Below is a list of public figures. Please indicate whether you have a favorable or unfavorable opinion of each of them or if you don't know enough
about them to say - Donald Trump
Favorability - Donald Trump

Ability to win
election
Abortion
Border/
Immigration
Character or
honesty
Climate change
or
environment
Cost of living
STATEWIDE November 2023
0%
4%
18%
0%
0%
3%
Voting
Registration
Registered Republican
Registered Undeclared/Not Reg.
Party ID
Independent/Democrat
Republican
Political
Ideology
Moderate
Conservative
Libertarian
Age of
Respondent
18 to 34
35 to 49
50 to 64
65 and older
Gender of
Respondent
Men
Women
Level of
Education
High school or less
Tech school/Some college
College graduate
Postgraduate work
College
Degree
College graduate
Not college graduate
Region of
State
Central/Lakes
Connecticut Valley
Manchester Area
Mass Border
North Country
Seacoast
Household
Income
Less than $45,000
$45,000 - $74,999
$75,000 - $99,999
$100,000 - $149,999
$150,000 or more
Media Usage
CNN viewer
Conservative radio listener
Epoch Times reader
Fox News viewer
Joe Rogan listener
Local NH news viewer
Newsmax viewer
NHPR listener
X (formerly Twitter) user
2020 Pres
Vote
Voted for Biden
Voted for Trump
Preferred
Candidate
Trump primary supporter
Not Trump primary supporter
1%
6%
2%
14%
20%
1%
0%
0%
0%
1%
5%
0%
1%
12%
20%
13%
0%
1%
0%
1%
4%
0%
0%
0%
0%
1%
8%
25%
19%
18%
0%
1%
1%
5%
4%
2%
0%
1%
5%
4%
4%
2%
20%
16%
17%
15%
1%
1%
1%
0%
3%
2%
5%
4%
0%
0%
5%
3%
16%
19%
1%
0%
0%
0%
3%
4%
0%
1%
4%
4%
6%
1%
9%
12%
25%
18%
2%
1%
0%
0%
0%
1%
6%
4%
2%
1%
3%
4%
22%
11%
1%
0%
0%
3%
4%
0%
1%
5%
7%
1%
6%
2%
4%
12%
22%
17%
15%
19%
22%
1%
0%
0%
0%
0%
1%
0%
0%
0%
1%
8%
1%
2%
3%
5%
0%
1%
0%
0%
3%
5%
7%
1%
3%
11%
15%
32%
14%
10%
1%
0%
0%
1%
0%
0%
1%
1%
2%
1%
4%
8%
0%
0%
0%
1%
0%
1%
0%
1%
1%
3%
8%
4%
4%
1%
0%
6%
11%
3%
25%
14%
37%
24%
28%
34%
11%
1%
1%
1%
0%
0%
0%
0%
0%
0%
0%
0%
0%
1%
1%
3%
1%
2%
3%
6%
4%
3%
2%
0%
1%
15%
22%
1%
0%
2%
0%
1%
4%
1%
1%
5%
1%
15%
22%
1%
0%
3%
3%
Right now, what are the most important issues to you when thinking about which candidate you support in the 2024 Republican primary? Issue #1
(coded)
Most Important Issues in Deciding Candidate to Support - 1st Issue - Likely GOP Primary Voters (coded)

Crime or drugs
Culture
wars/Stopping
Wokeism
Education
Election
integrity
Energy Foreign policy
STATEWIDE November 2023
1%
0%
0%
0%
1%
15%
Voting
Registration
Registered Republican
Registered Undeclared/Not Reg.
Party ID
Independent/Democrat
Republican
Political
Ideology
Moderate
Conservative
Libertarian
Age of
Respondent
18 to 34
35 to 49
50 to 64
65 and older
Gender of
Respondent
Men
Women
Level of
Education
High school or less
Tech school/Some college
College graduate
Postgraduate work
College
Degree
College graduate
Not college graduate
Region of
State
Central/Lakes
Connecticut Valley
Manchester Area
Mass Border
North Country
Seacoast
Household
Income
Less than $45,000
$45,000 - $74,999
$75,000 - $99,999
$100,000 - $149,999
$150,000 or more
Media Usage
CNN viewer
Conservative radio listener
Epoch Times reader
Fox News viewer
Joe Rogan listener
Local NH news viewer
Newsmax viewer
NHPR listener
X (formerly Twitter) user
2020 Pres
Vote
Voted for Biden
Voted for Trump
Preferred
Candidate
Trump primary supporter
Not Trump primary supporter
1%
1%
1%
0%
0%
1%
2%
1%
12%
18%
1%
0%
1%
0%
0%
0%
2%
0%
16%
11%
2%
1%
1%
1%
1%
0%
1%
3%
2%
13%
18%
13%
1%
1%
1%
0%
0%
1%
2%
1%
0%
0%
1%
1%
2%
2%
16%
15%
8%
23%
0%
1%
1%
0%
1%
0%
2%
17%
13%
1%
1%
1%
0%
0%
1%
1%
0%
1%
0%
0%
3%
1%
19%
16%
9%
19%
1%
1%
0%
0%
0%
1%
2%
0%
14%
17%
0%
1%
0%
1%
0%
0%
1%
1%
1%
0%
2%
0%
0%
0%
1%
0%
6%
6%
8%
20%
26%
16%
11%
1%
3%
0%
1%
1%
0%
0%
1%
1%
0%
0%
1%
1%
5%
25%
11%
12%
12%
11%
0%
0%
1%
1%
1%
2%
0%
1%
0%
0%
0%
0%
0%
0%
1%
0%
1%
2%
2%
1%
2%
0%
2%
1%
3%
3%
22%
22%
2%
17%
9%
14%
15%
12%
11%
1%
1%
0%
0%
0%
2%
0%
14%
12%
2%
0%
1%
0%
0%
1%
1%
2%
17%
13%
Right now, what are the most important issues to you when thinking about which candidate you support in the 2024 Republican primary? Issue #1
(coded)
Most Important Issues in Deciding Candidate to Support - 1st Issue - Likely GOP Primary Voters (coded)

Government
corruption
Gun rights Healthcare Jobs/Economy Not Trump
Personal
freedom
STATEWIDE November 2023
0%
1%
0%
40%
5%
1%
Voting
Registration
Registered Republican
Registered Undeclared/Not Reg.
Party ID
Independent/Democrat
Republican
Political
Ideology
Moderate
Conservative
Libertarian
Age of
Respondent
18 to 34
35 to 49
50 to 64
65 and older
Gender of
Respondent
Men
Women
Level of
Education
High school or less
Tech school/Some college
College graduate
Postgraduate work
College
Degree
College graduate
Not college graduate
Region of
State
Central/Lakes
Connecticut Valley
Manchester Area
Mass Border
North Country
Seacoast
Household
Income
Less than $45,000
$45,000 - $74,999
$75,000 - $99,999
$100,000 - $149,999
$150,000 or more
Media Usage
CNN viewer
Conservative radio listener
Epoch Times reader
Fox News viewer
Joe Rogan listener
Local NH news viewer
Newsmax viewer
NHPR listener
X (formerly Twitter) user
2020 Pres
Vote
Voted for Biden
Voted for Trump
Preferred
Candidate
Trump primary supporter
Not Trump primary supporter
0%
0%
0%
1%
1%
39%
41%
10%
0%
1%
1%
0%
1%
1%
1%
1%
43%
32%
2%
12%
1%
0%
1%
0%
1%
0%
0%
31%
47%
30%
0%
0%
10%
0%
1%
1%
1%
0%
1%
1%
0%
1%
0%
1%
41%
41%
32%
47%
1%
7%
6%
2%
1%
1%
0%
3%
1%
0%
1%
0%
0%
39%
40%
7%
3%
1%
0%
1%
1%
1%
0%
2%
1%
0%
39%
39%
39%
41%
7%
4%
3%
6%
3%
1%
0%
0%
1%
1%
0%
0%
0%
40%
39%
4%
5%
0%
2%
0%
0%
1%
1%
2%
1%
1%
0%
1%
1%
0%
0%
53%
53%
40%
23%
35%
42%
5%
0%
9%
6%
2%
2%
0%
1%
1%
2%
2%
0%
0%
1%
5%
0%
0%
44%
45%
26%
48%
41%
3%
8%
8%
0%
10%
3%
1%
0%
1%
0%
0%
1%
0%
1%
1%
1%
1%
1%
0%
1%
0%
0%
0%
1%
47%
35%
49%
42%
31%
46%
43%
39%
40%
2%
8%
6%
1%
0%
12%
1%
0%
1%
1%
1%
1%
1%
1%
1%
1%
0%
1%
1%
1%
45%
23%
24%
1%
0%
0%
1%
1%
1%
0%
35%
46%
8%
1%
0%
Right now, what are the most important issues to you when thinking about which candidate you support in the 2024 Republican primary? Issue #1
(coded)
Most Important Issues in Deciding Candidate to Support - 1st Issue - Likely GOP Primary Voters (coded)

Protecting
democracy or
Constitution
Taxes, budget,
or debt
Uniting the
country/
Bipartisanship
Other None
STATEWIDE November 2023
4%
2%
2%
2%
0%
N
877
Voting
Registration
Registered Republican
Registered Undeclared/Not Reg.
Party ID
Independent/Democrat
Republican
Political
Ideology
Moderate
Conservative
Libertarian
Age of
Respondent
18 to 34
35 to 49
50 to 64
65 and older
Gender of
Respondent
Men
Women
Level of
Education
High school or less
Tech school/Some college
College graduate
Postgraduate work
College
Degree
College graduate
Not college graduate
Region of
State
Central/Lakes
Connecticut Valley
Manchester Area
Mass Border
North Country
Seacoast
Household
Income
Less than $45,000
$45,000 - $74,999
$75,000 - $99,999
$100,000 - $149,999
$150,000 or more
Media Usage
CNN viewer
Conservative radio listener
Epoch Times reader
Fox News viewer
Joe Rogan listener
Local NH news viewer
Newsmax viewer
NHPR listener
X (formerly Twitter) user
2020 Pres
Vote
Voted for Biden
Voted for Trump
Preferred
Candidate
Trump primary supporter
Not Trump primary supporter
3%
4%
3%
1%
3%
1%
2%
2%
0%
3%
5%
2%
1%
1%
4%
2%
3%
0%
15%
3%
3%
1%
1%
0%
0%
5%
1%
2%
4%
0%
2%
2%
11%
2%
1%
3%
3%
1%
2%
2%
2%
3%
1%
4%
0%
5%
2%
2%
2%
1%
2%
1%
3%
0%
5%
1%
1%
7%
2%
2%
1%
3%
4%
3%
2%
3%
3%
2%
1%
0%
4%
3%
2%
2%
1%
4%
2%
3%
0%
1%
1%
3%
2%
15%
1%
4%
1%
0%
7%
1%
4%
0%
1%
3%
2%
1%
1%
3%
3%
1%
2%
3%
0%
1%
2%
2%
1%
3%
2%
0%
1%
2%
12%
1%
3%
2%
3%
1%
0%
4%
3%
4%
2%
1%
4%
11%
2%
12%
0%
4%
1%
1%
1%
2%
1%
1%
2%
1%
0%
1%
3%
2%
0%
4%
5%
6%
2%
3%
1%
2%
4%
3%
4%
0%
0%
0%
3%
6%
2%
1%
1%
7%
1%
5%
0%
2%
6%
1%
3%
3%
3%
1%
0%
385
489
653
220
135
400
237
246
323
177
125
398
475
119
185
269
301
570
304
138
78
213
131
134
177
179
126
178
172
84
186
195
174
523
157
295
107
223
156
680
167
503
358
Right now, what are the most important issues to you when thinking about which candidate you support in the 2024 Republican primary? Issue #1
(coded)
Most Important Issues in Deciding Candidate to Support - 1st Issue - Likely GOP Primary Voters (coded)

Ability to win
election
Abortion
Border/
Immigration
Character or
honesty
Climate change
or
environment
Cost of living
STATEWIDE November 2023
0%
6%
25%
1%
1%
4%
Voting
Registration
Registered Republican
Registered Undeclared/Not Reg.
Party ID
Independent/Democrat
Republican
Political
Ideology
Moderate
Conservative
Libertarian
Age of
Respondent
18 to 34
35 to 49
50 to 64
65 and older
Gender of
Respondent
Men
Women
Level of
Education
High school or less
Tech school/Some college
College graduate
Postgraduate work
College
Degree
College graduate
Not college graduate
Region of
State
Central/Lakes
Connecticut Valley
Manchester Area
Mass Border
North Country
Seacoast
Household
Income
Less than $45,000
$45,000 - $74,999
$75,000 - $99,999
$100,000 - $149,999
$150,000 or more
Media Usage
CNN viewer
Conservative radio listener
Epoch Times reader
Fox News viewer
Joe Rogan listener
Local NH news viewer
Newsmax viewer
NHPR listener
X (formerly Twitter) user
2020 Pres
Vote
Voted for Biden
Voted for Trump
Preferred
Candidate
Trump primary supporter
Not Trump primary supporter
0%
6%
5%
18%
31%
0%
1%
1%
0%
5%
3%
1%
5%
7%
31%
7%
1%
1%
0%
2%
4%
3%
0%
8%
3%
30%
30%
18%
0%
1%
1%
0%
1%
3%
2%
7%
1%
3%
8%
9%
1%
37%
24%
21%
11%
2%
1%
1%
0%
1%
2%
6%
4%
0%
11%
2%
27%
24%
1%
1%
0%
1%
3%
4%
1%
4%
6%
5%
7%
21%
19%
26%
30%
2%
1%
1%
3%
0%
0%
3%
5%
5%
2%
0%
6%
5%
28%
20%
1%
1%
0%
1%
4%
4%
1%
12%
1%
3%
4%
1%
12%
29%
21%
18%
22%
35%
28%
1%
1%
1%
1%
1%
0%
1%
1%
0%
0%
3%
1%
6%
4%
1%
4%
1%
4%
13%
12%
1%
5%
23%
23%
12%
32%
25%
0%
0%
1%
1%
0%
0%
1%
3%
2%
6%
2%
6%
1%
0%
1%
5%
6%
6%
9%
1%
1%
6%
22%
21%
39%
24%
27%
33%
22%
33%
15%
1%
1%
1%
1%
1%
1%
0%
1%
0%
0%
1%
0%
1%
0%
0%
1%
2%
3%
2%
5%
2%
4%
5%
2%
6%
1%
5%
10%
31%
3%
1%
2%
0%
2%
3%
5%
0%
8%
3%
16%
38%
1%
1%
1%
0%
5%
2%
Right now, what are the most important issues to you when thinking about which candidate you support in the 2024 Republican primary? Issue #2
(coded)
Most Important Issues in Deciding Candidate to Support - 2nd Issue - Likely GOP Primary Voters (coded)

Crime or drugs
Culture
wars/Stopping
Wokeism
Education
Election
integrity
Energy Foreign policy
STATEWIDE November 2023
2%
0%
4%
0%
2%
20%
Voting
Registration
Registered Republican
Registered Undeclared/Not Reg.
Party ID
Independent/Democrat
Republican
Political
Ideology
Moderate
Conservative
Libertarian
Age of
Respondent
18 to 34
35 to 49
50 to 64
65 and older
Gender of
Respondent
Men
Women
Level of
Education
High school or less
Tech school/Some college
College graduate
Postgraduate work
College
Degree
College graduate
Not college graduate
Region of
State
Central/Lakes
Connecticut Valley
Manchester Area
Mass Border
North Country
Seacoast
Household
Income
Less than $45,000
$45,000 - $74,999
$75,000 - $99,999
$100,000 - $149,999
$150,000 or more
Media Usage
CNN viewer
Conservative radio listener
Epoch Times reader
Fox News viewer
Joe Rogan listener
Local NH news viewer
Newsmax viewer
NHPR listener
X (formerly Twitter) user
2020 Pres
Vote
Voted for Biden
Voted for Trump
Preferred
Candidate
Trump primary supporter
Not Trump primary supporter
1%
3%
0%
6%
3%
0%
1%
2%
20%
20%
3%
1%
0%
2%
10%
1%
2%
20%
20%
0%
4%
2%
1%
0%
15%
3%
0%
1%
0%
2%
1%
20%
17%
28%
3%
3%
1%
2%
0%
1%
0%
0%
8%
15%
1%
2%
3%
16%
16%
24%
32%
0%
4%
0%
5%
3%
0%
2%
1%
17%
22%
4%
1%
1%
4%
1%
0%
2%
1%
7%
4%
1%
1%
2%
1%
2%
25%
26%
18%
15%
3%
2%
0%
6%
1%
1%
2%
1%
17%
25%
1%
0%
7%
0%
1%
1%
0%
0%
9%
0%
1%
15%
1%
1%
1%
8%
2%
1%
1%
17%
34%
20%
17%
9%
27%
1%
7%
5%
0%
1%
0%
2%
11%
8%
1%
1%
2%
1%
1%
8%
19%
17%
23%
23%
26%
3%
1%
9%
3%
5%
3%
6%
7%
1%
0%
0%
0%
0%
7%
1%
8%
0%
13%
4%
0%
6%
1%
1%
0%
1%
1%
2%
1%
1%
0%
10%
20%
16%
18%
21%
19%
23%
20%
24%
3%
1%
0%
5%
1%
1%
2%
1%
20%
20%
1%
4%
0%
0%
5%
4%
0%
0%
3%
17%
24%
Right now, what are the most important issues to you when thinking about which candidate you support in the 2024 Republican primary? Issue #2
(coded)
Most Important Issues in Deciding Candidate to Support - 2nd Issue - Likely GOP Primary Voters (coded)

Government
corruption
Gun rights Healthcare Jobs/Economy Not Trump
STATEWIDE November 2023
0%
0%
1%
22%
3%
Voting
Registration
Registered Republican
Registered Undeclared/Not Reg.
Party ID
Independent/Democrat
Republican
Political
Ideology
Moderate
Conservative
Libertarian
Age of
Respondent
18 to 34
35 to 49
50 to 64
65 and older
Gender of
Respondent
Men
Women
Level of
Education
High school or less
Tech school/Some college
College graduate
Postgraduate work
College
Degree
College graduate
Not college graduate
Region of
State
Central/Lakes
Connecticut Valley
Manchester Area
Mass Border
North Country
Seacoast
Household
Income
Less than $45,000
$45,000 - $74,999
$75,000 - $99,999
$100,000 - $149,999
$150,000 or more
Media Usage
CNN viewer
Conservative radio listener
Epoch Times reader
Fox News viewer
Joe Rogan listener
Local NH news viewer
Newsmax viewer
NHPR listener
X (formerly Twitter) user
2020 Pres
Vote
Voted for Biden
Voted for Trump
Preferred
Candidate
Trump primary supporter
Not Trump primary supporter
0%
0%
1%
0%
2%
20%
24%
6%
0%
0%
0%
2%
0%
3%
23%
21%
2%
4%
0%
2%
0%
2%
23%
25%
16%
5%
0%
0%
0%
0%
2%
1%
1%
2%
22%
22%
19%
30%
1%
6%
1%
0%
1%
0%
1%
20%
24%
5%
0%
0%
0%
0%
0%
1%
2%
1%
20%
21%
22%
25%
2%
1%
0%
6%
0%
0%
1%
0%
1%
1%
23%
20%
3%
1%
1%
0%
1%
2%
0%
2%
2%
1%
14%
23%
23%
24%
32%
17%
2%
6%
5%
0%
1%
1%
0%
2%
4%
30%
12%
15%
28%
13%
1%
1%
7%
0%
8%
0%
0%
1%
0%
0%
1%
1%
2%
2%
2%
1%
2%
1%
3%
1%
2%
2%
3%
1%
1%
1%
2%
2%
38%
20%
12%
22%
22%
23%
34%
20%
14%
1%
4%
0%
0%
6%
0%
0%
0%
3%
23%
13%
13%
0%
0%
1%
1%
0%
27%
16%
4%
Right now, what are the most important issues to you when thinking about which candidate you support in the 2024 Republican primary? Issue #2
(coded)
Most Important Issues in Deciding Candidate to Support - 2nd Issue - Likely GOP Primary Voters (coded)

Personal
freedom
Protecting
democracy or
Constitution
Taxes, budget,
or debt
Uniting the
country/
Bipartisanship
Other
STATEWIDE November 2023
1%
1%
3%
1%
3%
N
856
Voting
Registration
Registered Republican
Registered Undeclared/Not Reg.
Party ID
Independent/Democrat
Republican
Political
Ideology
Moderate
Conservative
Libertarian
Age of
Respondent
18 to 34
35 to 49
50 to 64
65 and older
Gender of
Respondent
Men
Women
Level of
Education
High school or less
Tech school/Some college
College graduate
Postgraduate work
College
Degree
College graduate
Not college graduate
Region of
State
Central/Lakes
Connecticut Valley
Manchester Area
Mass Border
North Country
Seacoast
Household
Income
Less than $45,000
$45,000 - $74,999
$75,000 - $99,999
$100,000 - $149,999
$150,000 or more
Media Usage
CNN viewer
Conservative radio listener
Epoch Times reader
Fox News viewer
Joe Rogan listener
Local NH news viewer
Newsmax viewer
NHPR listener
X (formerly Twitter) user
2020 Pres
Vote
Voted for Biden
Voted for Trump
Preferred
Candidate
Trump primary supporter
Not Trump primary supporter
0%
1%
3%
0%
3%
3%
1%
1%
5%
2%
1%
0%
0%
5%
3%
2%
0%
2%
2%
8%
1%
1%
2%
4%
3%
3%
1%
2%
1%
2%
4%
1%
1%
1%
2%
1%
2%
2%
4%
2%
5%
2%
1%
1%
1%
3%
5%
2%
2%
1%
1%
1%
1%
1%
4%
0%
1%
3%
3%
0%
1%
1%
3%
3%
1%
1%
2%
5%
3%
2%
1%
3%
1%
6%
5%
5%
1%
1%
1%
3%
3%
4%
0%
2%
2%
5%
0%
1%
2%
0%
0%
1%
2%
2%
3%
0%
0%
1%
3%
4%
7%
2%
2%
3%
1%
0%
1%
1%
2%
2%
3%
5%
4%
4%
2%
1%
0%
1%
3%
3%
0%
1%
5%
8%
1%
0%
0%
2%
1%
0%
0%
1%
4%
5%
1%
3%
6%
2%
1%
1%
2%
1%
1%
1%
0%
5%
2%
0%
0%
4%
4%
1%
2%
3%
3%
4%
3%
4%
8%
0%
3%
1%
1%
0%
2%
1%
8%
3%
4%
1%
1%
2%
1%
5%
1%
0%
7%
3%
2%
0%
3%
1%
11%
0%
1%
2%
4%
1%
2%
4%
2%
372
481
637
214
135
399
233
237
313
175
125
381
471
117
183
267
286
553
300
136
78
211
122
133
169
179
126
175
165
76
184
193
173
503
156
294
107
223
153
664
161
498
343
Right now, what are the most important issues to you when thinking about which candidate you support in the 2024 Republican primary? Issue #2
(coded)
Most Important Issues in Deciding Candidate to Support - 2nd Issue - Likely GOP Primary Voters (coded)

Ability to win
election
Abortion
Border/
Immigration
Character or
honesty
Climate change
or
environment
Cost of living
STATEWIDE November 2023
0%
5%
11%
2%
1%
2%
Voting
Registration
Registered Republican
Registered Undeclared/Not Reg.
Party ID
Independent/Democrat
Republican
Political
Ideology
Moderate
Conservative
Libertarian
Age of
Respondent
18 to 34
35 to 49
50 to 64
65 and older
Gender of
Respondent
Men
Women
Level of
Education
High school or less
Tech school/Some college
College graduate
Postgraduate work
College
Degree
College graduate
Not college graduate
Region of
State
Central/Lakes
Connecticut Valley
Manchester Area
Mass Border
North Country
Seacoast
Household
Income
Less than $45,000
$45,000 - $74,999
$75,000 - $99,999
$100,000 - $149,999
$150,000 or more
Media Usage
CNN viewer
Conservative radio listener
Epoch Times reader
Fox News viewer
Joe Rogan listener
Local NH news viewer
Newsmax viewer
NHPR listener
X (formerly Twitter) user
2020 Pres
Vote
Voted for Biden
Voted for Trump
Preferred
Candidate
Trump primary supporter
Not Trump primary supporter
1%
7%
4%
6%
14%
1%
2%
3%
0%
2%
1%
2%
6%
4%
13%
5%
1%
2%
0%
4%
2%
1%
11%
5%
4%
11%
8%
19%
1%
2%
2%
3%
1%
2%
2%
1%
2%
3%
6%
5%
11%
8%
11%
17%
9%
4%
1%
1%
1%
1%
1%
2%
0%
1%
5%
1%
0%
6%
5%
7%
14%
1%
2%
2%
1%
2%
1%
2%
1%
6%
5%
4%
7%
7%
15%
10%
11%
3%
1%
1%
2%
3%
2%
2%
2%
2%
2%
1%
5%
5%
10%
12%
1%
2%
1%
2%
1%
2%
1%
1%
3%
0%
4%
1%
13%
8%
8%
17%
9%
9%
7%
14%
2%
2%
5%
1%
1%
3%
1%
1%
1%
1%
5%
1%
1%
2%
0%
2%
2%
5%
3%
6%
3%
3%
10%
3%
20%
4%
28%
1%
5%
1%
1%
1%
1%
1%
2%
1%
0%
1%
2%
0%
3%
1%
2%
1%
1%
8%
14%
1%
7%
2%
2%
12%
6%
4%
7%
5%
7%
8%
17%
11%
14%
15%
8%
1%
2%
0%
2%
0%
3%
1%
3%
4%
4%
2%
1%
1%
4%
0%
4%
0%
2%
3%
0%
2%
2%
3%
3%
9%
12%
5%
1%
3%
6%
1%
2%
1%
7%
4%
7%
17%
3%
0%
2%
2%
0%
Right now, what are the most important issues to you when thinking about which candidate you support in the 2024 Republican primary? Issue #3
(coded)
Most Important Issues in Deciding Candidate to Support - 3rd Issue - Likely GOP Primary Voters (coded)

Crime or drugs
Culture
wars/Stopping
Wokeism
Education
Election
integrity
Energy Foreign policy
STATEWIDE November 2023
5%
1%
4%
1%
6%
22%
Voting
Registration
Registered Republican
Registered Undeclared/Not Reg.
Party ID
Independent/Democrat
Republican
Political
Ideology
Moderate
Conservative
Libertarian
Age of
Respondent
18 to 34
35 to 49
50 to 64
65 and older
Gender of
Respondent
Men
Women
Level of
Education
High school or less
Tech school/Some college
College graduate
Postgraduate work
College
Degree
College graduate
Not college graduate
Region of
State
Central/Lakes
Connecticut Valley
Manchester Area
Mass Border
North Country
Seacoast
Household
Income
Less than $45,000
$45,000 - $74,999
$75,000 - $99,999
$100,000 - $149,999
$150,000 or more
Media Usage
CNN viewer
Conservative radio listener
Epoch Times reader
Fox News viewer
Joe Rogan listener
Local NH news viewer
Newsmax viewer
NHPR listener
X (formerly Twitter) user
2020 Pres
Vote
Voted for Biden
Voted for Trump
Preferred
Candidate
Trump primary supporter
Not Trump primary supporter
6%
4%
1%
2%
4%
3%
2%
0%
9%
4%
15%
28%
6%
1%
2%
0%
4%
2%
0%
2%
5%
9%
26%
12%
0%
2%
14%
0%
3%
0%
3%
5%
2%
1%
0%
0%
19%
5%
0%
11%
30%
20%
6%
6%
2%
3%
4%
1%
1%
1%
1%
6%
12%
1%
0%
1%
2%
7%
3%
1%
16%
35%
23%
20%
5%
5%
0%
2%
7%
1%
0%
1%
8%
4%
24%
21%
4%
3%
4%
6%
1%
1%
1%
2%
5%
2%
8%
2%
1%
1%
1%
2%
3%
13%
2%
17%
23%
20%
27%
5%
3%
1%
1%
4%
3%
1%
1%
8%
3%
23%
21%
0%
10%
4%
8%
1%
8%
1%
0%
3%
0%
2%
3%
18%
1%
2%
0%
5%
1%
2%
1%
2%
4%
7%
2%
2%
18%
5%
42%
10%
20%
19%
13%
27%
5%
1%
8%
6%
4%
1%
5%
1%
1%
3%
1%
5%
7%
3%
1%
2%
1%
0%
0%
6%
1%
12%
6%
3%
20%
22%
19%
32%
14%
1%
1%
4%
8%
2%
9%
2%
8%
1%
0%
4%
1%
1%
1%
6%
3%
0%
6%
1%
7%
3%
2%
2%
5%
2%
3%
1%
2%
0%
1%
0%
0%
1%
5%
1%
4%
2%
16%
7%
3%
4%
2%
26%
18%
32%
24%
9%
27%
14%
24%
16%
6%
1%
2%
0%
4%
3%
0%
3%
7%
1%
25%
15%
6%
3%
1%
2%
1%
7%
1%
0%
6%
5%
22%
24%
Right now, what are the most important issues to you when thinking about which candidate you support in the 2024 Republican primary? Issue #3
(coded)
Most Important Issues in Deciding Candidate to Support - 3rd Issue - Likely GOP Primary Voters (coded)

Government
corruption
Gun rights Healthcare Jobs/Economy Not Trump
STATEWIDE November 2023
1%
1%
4%
16%
0%
Voting
Registration
Registered Republican
Registered Undeclared/Not Reg.
Party ID
Independent/Democrat
Republican
Political
Ideology
Moderate
Conservative
Libertarian
Age of
Respondent
18 to 34
35 to 49
50 to 64
65 and older
Gender of
Respondent
Men
Women
Level of
Education
High school or less
Tech school/Some college
College graduate
Postgraduate work
College
Degree
College graduate
Not college graduate
Region of
State
Central/Lakes
Connecticut Valley
Manchester Area
Mass Border
North Country
Seacoast
Household
Income
Less than $45,000
$45,000 - $74,999
$75,000 - $99,999
$100,000 - $149,999
$150,000 or more
Media Usage
CNN viewer
Conservative radio listener
Epoch Times reader
Fox News viewer
Joe Rogan listener
Local NH news viewer
Newsmax viewer
NHPR listener
X (formerly Twitter) user
2020 Pres
Vote
Voted for Biden
Voted for Trump
Preferred
Candidate
Trump primary supporter
Not Trump primary supporter
1%
2%
0%
2%
2%
6%
18%
14%
1%
0%
1%
1%
2%
0%
5%
2%
13%
24%
0%
1%
0%
2%
0%
3%
2%
0%
0%
7%
3%
25%
11%
13%
1%
2%
2%
0%
0%
0%
2%
6%
1%
10%
1%
2%
14%
11%
20%
25%
1%
1%
1%
2%
3%
8%
2%
15%
16%
0%
0%
1%
3%
2%
4%
4%
0%
4%
1%
4%
7%
11%
13%
12%
23%
1%
1%
0%
1%
2%
0%
4%
6%
2%
17%
13%
0%
1%
2%
3%
1%
2%
0%
3%
1%
3%
0%
0%
11%
9%
0%
2%
5%
9%
14%
23%
37%
8%
1%
1%
0%
0%
0%
1%
3%
1%
1%
1%
2%
5%
1%
13%
3%
0%
0%
0%
9%
10%
15%
22%
18%
0%
2%
0%
1%
1%
3%
1%
0%
2%
5%
3%
1%
1%
1%
1%
1%
0%
5%
2%
1%
6%
2%
2%
1%
2%
23%
12%
24%
12%
39%
14%
31%
17%
11%
1%
1%
0%
1%
2%
0%
2%
5%
3%
16%
14%
3%
0%
3%
1%
3%
6%
1%
14%
18%
1%
Right now, what are the most important issues to you when thinking about which candidate you support in the 2024 Republican primary? Issue #3
(coded)
Most Important Issues in Deciding Candidate to Support - 3rd Issue - Likely GOP Primary Voters (coded)

Personal
freedom
Protecting
democracy or
Constitution
Taxes, budget,
or debt
Uniting the
country/
Bipartisanship
Other
STATEWIDE November 2023
1%
1%
4%
1%
10%
N
829
Voting
Registration
Registered Republican
Registered Undeclared/Not Reg.
Party ID
Independent/Democrat
Republican
Political
Ideology
Moderate
Conservative
Libertarian
Age of
Respondent
18 to 34
35 to 49
50 to 64
65 and older
Gender of
Respondent
Men
Women
Level of
Education
High school or less
Tech school/Some college
College graduate
Postgraduate work
College
Degree
College graduate
Not college graduate
Region of
State
Central/Lakes
Connecticut Valley
Manchester Area
Mass Border
North Country
Seacoast
Household
Income
Less than $45,000
$45,000 - $74,999
$75,000 - $99,999
$100,000 - $149,999
$150,000 or more
Media Usage
CNN viewer
Conservative radio listener
Epoch Times reader
Fox News viewer
Joe Rogan listener
Local NH news viewer
Newsmax viewer
NHPR listener
X (formerly Twitter) user
2020 Pres
Vote
Voted for Biden
Voted for Trump
Preferred
Candidate
Trump primary supporter
Not Trump primary supporter
0%
2%
2%
5%
3%
1%
1%
14%
7%
2%
0%
3%
5%
1%
1%
2%
7%
19%
3%
2%
0%
2%
0%
3%
6%
1%
1%
2%
3%
8%
12%
1%
3%
0%
1%
0%
1%
3%
2%
6%
2%
6%
1%
2%
8%
12%
14%
2%
2%
1%
1%
1%
6%
1%
1%
10%
9%
0%
1%
4%
1%
1%
10%
3%
1%
4%
2%
3%
1%
12%
10%
14%
5%
2%
1%
1%
1%
3%
6%
1%
2%
9%
11%
0%
5%
3%
0%
0%
2%
1%
0%
8%
2%
3%
3%
2%
4%
1%
1%
1%
0%
0%
2%
9%
13%
13%
10%
6%
7%
4%
0%
0%
1%
3%
0%
6%
10%
0%
3%
1%
1%
1%
1%
0%
1%
8%
14%
7%
8%
20%
2%
0%
4%
0%
2%
3%
5%
2%
2%
2%
1%
2%
1%
3%
1%
4%
5%
9%
1%
3%
3%
7%
2%
6%
5%
0%
2%
0%
2%
1%
0%
0%
0%
2%
5%
17%
4%
12%
2%
6%
2%
6%
17%
2%
0%
2%
4%
1%
1%
3%
7%
23%
0%
3%
1%
4%
4%
2%
12%
6%
351
474
617
207
132
396
213
234
297
171
121
365
462
109
180
263
275
539
289
129
76
195
121
132
169
175
122
161
161
76
181
188
173
481
154
292
107
220
149
655
143
474
341
Right now, what are the most important issues to you when thinking about which candidate you support in the 2024 Republican primary? Issue #3
(coded)
Most Important Issues in Deciding Candidate to Support - 3rd Issue - Likely GOP Primary Voters (coded)

Strongly
support
Somewhat
support
Neutral
Somewhat
oppose
Strongly
oppose
Don't
know/Not
sure
STATEWIDE November 2023
30%
17%
14%
12%
26%
1%
N
952
Voting
Registration
Registered Republican
Registered Undeclared/Not Reg.
Party ID
Independent/Democrat
Republican
Political
Ideology
Moderate
Conservative
Libertarian
Age of
Respondent
18 to 34
35 to 49
50 to 64
65 and older
Gender of
Respondent
Men
Women
Level of
Education
High school or less
Tech school/Some college
College graduate
Postgraduate work
College
Degree
College graduate
Not college graduate
Region of
State
Central/Lakes
Connecticut Valley
Manchester Area
Mass Border
North Country
Seacoast
Household
Income
Less than $45,000
$45,000 - $74,999
$75,000 - $99,999
$100,000 - $149,999
$150,000 or more
Media Usage
CNN viewer
Conservative radio listener
Epoch Times reader
Fox News viewer
Joe Rogan listener
Local NH news viewer
Newsmax viewer
NHPR listener
X (formerly Twitter) user
2020 Pres
Vote
Voted for Biden
Voted for Trump
Preferred
Candidate
Trump primary supporter
Not Trump primary supporter
15%
41%
18%
17%
10%
17%
10%
13%
47%
11%
1%
2%
36%
11%
18%
16%
17%
3%
14%
5%
13%
65%
2%
1%
32%
43%
10%
26%
22%
8%
22%
10%
16%
5%
17%
12%
15%
6%
52%
2%
1%
31%
28%
40%
19%
14%
13%
8%
42%
17%
11%
18%
10%
12%
17%
4%
9%
24%
29%
29%
20%
2%
2%
0%
32%
28%
19%
15%
8%
18%
11%
12%
28%
25%
1%
2%
19%
23%
31%
36%
10%
17%
24%
14%
9%
13%
9%
20%
12%
11%
6%
17%
49%
36%
28%
12%
1%
1%
2%
1%
34%
21%
18%
14%
15%
11%
12%
11%
19%
41%
2%
1%
27%
30%
29%
26%
48%
24%
14%
33%
11%
29%
22%
6%
5%
15%
14%
12%
14%
22%
30%
5%
5%
8%
3%
17%
23%
18%
39%
23%
14%
31%
1%
3%
1%
0%
35%
21%
21%
45%
31%
11%
19%
17%
16%
20%
9%
8%
15%
11%
23%
9%
19%
9%
12%
2%
35%
33%
35%
15%
20%
0%
3%
1%
5%
34%
14%
63%
23%
51%
36%
60%
35%
8%
22%
5%
10%
14%
16%
20%
19%
14%
7%
11%
13%
10%
13%
21%
17%
6%
28%
13%
14%
13%
8%
13%
7%
9%
7%
11%
9%
19%
55%
8%
35%
5%
17%
5%
8%
63%
0%
1%
0%
1%
1%
3%
3%
0%
38%
2%
21%
5%
16%
1%
14%
3%
10%
89%
2%
0%
19%
44%
11%
25%
10%
19%
15%
7%
42%
4%
2%
1%
409
539
706
241
139
436
260
251
359
182
153
430
517
124
196
273
355
628
320
159
91
219
151
134
191
180
160
184
174
84
225
202
174
570
160
320
126
223
162
734
187
535
398
Do you support or oppose the following policies proposed by some Republican presidential candidates or don't you know enough about it to say?
Passing a law banning abortion nationwide after 15 weeks
Support or Oppose 15 Week Naonal Aboron Ban - Likely GOP Primary Voters

Support Neutral Oppose Don't know/Not sure
STATEWIDE November 2023
47%
14%
38%
1%
N
952
Voting
Registration
Registered Republican
Registered Undeclared/Not Reg.
Party ID
Independent/Democrat
Republican
Political
Ideology
Moderate
Conservative
Libertarian
Age of
Respondent
18 to 34
35 to 49
50 to 64
65 and older
Gender of
Respondent
Men
Women
Level of
Education
High school or less
Tech school/Some college
College graduate
Postgraduate work
College
Degree
College graduate
Not college graduate
Region of
State
Central/Lakes
Connecticut Valley
Manchester Area
Mass Border
North Country
Seacoast
Household
Income
Less than $45,000
$45,000 - $74,999
$75,000 - $99,999
$100,000 - $149,999
$150,000 or more
Media Usage
CNN viewer
Conservative radio listener
Epoch Times reader
Fox News viewer
Joe Rogan listener
Local NH news viewer
Newsmax viewer
NHPR listener
X (formerly Twitter) user
2020 Pres
Vote
Voted for Biden
Voted for Trump
Preferred
Candidate
Trump primary supporter
Not Trump primary supporter
32%
58%
10%
17%
57%
24%
1%
2%
54%
26%
17%
3%
28%
69%
2%
1%
58%
66%
18%
22%
10%
16%
20%
23%
64%
2%
1%
46%
41%
49%
61%
17%
11%
18%
10%
35%
46%
33%
29%
2%
2%
0%
51%
43%
8%
18%
40%
37%
1%
2%
28%
40%
55%
50%
9%
13%
9%
20%
61%
46%
34%
29%
1%
1%
2%
1%
52%
35%
15%
11%
31%
52%
2%
1%
41%
63%
40%
56%
69%
30%
5%
15%
14%
12%
14%
22%
53%
23%
43%
31%
17%
48%
1%
3%
1%
0%
46%
40%
38%
61%
51%
9%
8%
15%
11%
23%
44%
52%
44%
27%
22%
0%
3%
1%
5%
56%
19%
73%
38%
67%
56%
79%
50%
15%
11%
13%
10%
13%
21%
17%
6%
28%
13%
33%
68%
17%
48%
12%
26%
13%
19%
72%
0%
1%
0%
1%
1%
3%
3%
0%
58%
7%
16%
1%
24%
92%
2%
0%
31%
69%
10%
19%
57%
11%
2%
1%
409
539
706
241
139
436
260
251
359
182
153
430
517
124
196
273
355
628
320
159
91
219
151
134
191
180
160
184
174
84
225
202
174
570
160
320
126
223
162
734
187
535
398
Do you support or oppose the following policies proposed by some Republican presidential candidates or don't you know enough about it to say?
Passing a law banning abortion nationwide after 15 weeks
Support or Oppose 15 Week Naonal Aboron Ban - Likely GOP Primary Voters

Strongly
support
Somewhat
support
Neutral
Somewhat
oppose
Strongly
oppose
Don't
know/Not
sure
STATEWIDE November 2023
50%
20%
9%
11%
11%
0%
N
950
Voting
Registration
Registered Republican
Registered Undeclared/Not Reg.
Party ID
Independent/Democrat
Republican
Political
Ideology
Moderate
Conservative
Libertarian
Age of
Respondent
18 to 34
35 to 49
50 to 64
65 and older
Gender of
Respondent
Men
Women
Level of
Education
High school or less
Tech school/Some college
College graduate
Postgraduate work
College
Degree
College graduate
Not college graduate
Region of
State
Central/Lakes
Connecticut Valley
Manchester Area
Mass Border
North Country
Seacoast
Household
Income
Less than $45,000
$45,000 - $74,999
$75,000 - $99,999
$100,000 - $149,999
$150,000 or more
Media Usage
CNN viewer
Conservative radio listener
Epoch Times reader
Fox News viewer
Joe Rogan listener
Local NH news viewer
Newsmax viewer
NHPR listener
X (formerly Twitter) user
2020 Pres
Vote
Voted for Biden
Voted for Trump
Preferred
Candidate
Trump primary supporter
Not Trump primary supporter
36%
60%
20%
20%
5%
11%
20%
4%
19%
5%
0%
0%
61%
15%
20%
19%
9%
7%
5%
28%
4%
31%
0%
1%
55%
61%
38%
15%
19%
29%
5%
11%
8%
18%
5%
10%
7%
4%
14%
0%
0%
1%
52%
51%
58%
32%
20%
23%
10%
23%
8%
11%
9%
3%
9%
7%
9%
26%
10%
8%
13%
15%
0%
0%
0%
47%
52%
22%
17%
9%
9%
10%
12%
11%
10%
0%
0%
38%
34%
55%
59%
21%
25%
16%
19%
6%
13%
9%
8%
10%
11%
13%
9%
24%
17%
7%
6%
1%
0%
0%
57%
35%
18%
23%
8%
10%
11%
11%
6%
19%
0%
1%
57%
47%
37%
45%
48%
64%
12%
33%
31%
17%
8%
17%
6%
7%
14%
12%
7%
5%
16%
1%
7%
9%
32%
4%
10%
12%
12%
17%
4%
9%
0%
0%
1%
43%
41%
56%
46%
42%
19%
19%
12%
25%
33%
18%
4%
4%
10%
8%
9%
12%
17%
16%
5%
11%
24%
10%
4%
12%
0%
1%
1%
56%
28%
77%
52%
49%
61%
58%
61%
33%
13%
19%
13%
19%
9%
17%
16%
18%
22%
9%
7%
6%
10%
8%
8%
3%
6%
7%
13%
17%
2%
7%
32%
7%
20%
8%
12%
9%
28%
3%
12%
3%
7%
2%
7%
25%
0%
1%
0%
0%
0%
0%
0%
0%
60%
11%
19%
23%
8%
10%
10%
16%
3%
39%
0%
1%
35%
70%
20%
18%
12%
5%
16%
4%
17%
3%
0%
408
538
706
239
139
436
260
251
357
182
153
430
515
124
196
272
355
627
320
158
91
219
150
134
191
180
159
184
174
84
225
202
174
570
160
320
126
223
162
733
187
533
398
Do you support or oppose the following policies proposed by some Republican presidential candidates or don't you know enough about it to say?
Making drug traffickers, smugglers, and drug dealers eligible for the death penalty
Support or Oppose Making Drug Traffickers, Smugglers & Dealers Eligible for Death Penalty - Likely GOP Primary Voters

Support Neutral Oppose Don't know/Not sure
STATEWIDE November 2023
69%
9%
22%
0%
N
950
Voting
Registration
Registered Republican
Registered Undeclared/Not Reg.
Party ID
Independent/Democrat
Republican
Political
Ideology
Moderate
Conservative
Libertarian
Age of
Respondent
18 to 34
35 to 49
50 to 64
65 and older
Gender of
Respondent
Men
Women
Level of
Education
High school or less
Tech school/Some college
College graduate
Postgraduate work
College
Degree
College graduate
Not college graduate
Region of
State
Central/Lakes
Connecticut Valley
Manchester Area
Mass Border
North Country
Seacoast
Household
Income
Less than $45,000
$45,000 - $74,999
$75,000 - $99,999
$100,000 - $149,999
$150,000 or more
Media Usage
CNN viewer
Conservative radio listener
Epoch Times reader
Fox News viewer
Joe Rogan listener
Local NH news viewer
Newsmax viewer
NHPR listener
X (formerly Twitter) user
2020 Pres
Vote
Voted for Biden
Voted for Trump
Preferred
Candidate
Trump primary supporter
Not Trump primary supporter
56%
79%
5%
11%
38%
9%
0%
0%
81%
34%
9%
7%
9%
58%
0%
1%
69%
80%
68%
5%
11%
8%
25%
9%
23%
0%
0%
1%
72%
74%
68%
55%
8%
11%
9%
3%
19%
15%
23%
42%
0%
0%
0%
70%
69%
9%
9%
21%
22%
0%
0%
58%
59%
71%
77%
6%
13%
9%
8%
34%
28%
20%
15%
1%
0%
0%
75%
59%
8%
10%
17%
30%
0%
1%
69%
80%
67%
62%
56%
81%
6%
7%
14%
12%
7%
5%
26%
13%
19%
26%
36%
13%
0%
0%
1%
62%
60%
68%
70%
75%
18%
4%
4%
10%
8%
20%
36%
28%
19%
17%
0%
1%
1%
69%
48%
90%
72%
58%
78%
75%
79%
55%
9%
7%
6%
10%
8%
8%
3%
6%
7%
22%
44%
4%
18%
35%
13%
23%
15%
38%
0%
1%
0%
0%
0%
0%
0%
0%
79%
34%
8%
10%
13%
55%
0%
1%
55%
88%
12%
5%
33%
7%
0%
408
538
706
239
139
436
260
251
357
182
153
430
515
124
196
272
355
627
320
158
91
219
150
134
191
180
159
184
174
84
225
202
174
570
160
320
126
223
162
733
187
533
398
Do you support or oppose the following policies proposed by some Republican presidential candidates or don't you know enough about it to say?
Making drug traffickers, smugglers, and drug dealers eligible for the death penalty
Support or Oppose Making Drug Traffickers, Smugglers & Dealers Eligible for Death Penalty - Likely GOP Primary Voters

Strongly
support
Somewhat
support
Neutral
Somewhat
oppose
Strongly
oppose
Don't
know/Not
sure
STATEWIDE November 2023
34%
13%
16%
12%
19%
7%
N
950
Voting
Registration
Registered Republican
Registered Undeclared/Not Reg.
Party ID
Independent/Democrat
Republican
Political
Ideology
Moderate
Conservative
Libertarian
Age of
Respondent
18 to 34
35 to 49
50 to 64
65 and older
Gender of
Respondent
Men
Women
Level of
Education
High school or less
Tech school/Some college
College graduate
Postgraduate work
College
Degree
College graduate
Not college graduate
Region of
State
Central/Lakes
Connecticut Valley
Manchester Area
Mass Border
North Country
Seacoast
Household
Income
Less than $45,000
$45,000 - $74,999
$75,000 - $99,999
$100,000 - $149,999
$150,000 or more
Media Usage
CNN viewer
Conservative radio listener
Epoch Times reader
Fox News viewer
Joe Rogan listener
Local NH news viewer
Newsmax viewer
NHPR listener
X (formerly Twitter) user
2020 Pres
Vote
Voted for Biden
Voted for Trump
Preferred
Candidate
Trump primary supporter
Not Trump primary supporter
27%
40%
10%
15%
15%
16%
13%
10%
31%
9%
4%
9%
38%
24%
14%
8%
18%
8%
11%
13%
10%
44%
8%
3%
45%
43%
18%
11%
16%
11%
10%
19%
19%
5%
8%
20%
14%
8%
25%
15%
5%
7%
35%
32%
39%
35%
14%
16%
10%
4%
20%
19%
11%
6%
11%
14%
5%
16%
17%
11%
22%
36%
2%
8%
14%
3%
28%
40%
13%
13%
18%
14%
12%
11%
20%
18%
9%
5%
25%
30%
46%
31%
14%
9%
15%
13%
14%
14%
12%
20%
6%
14%
4%
18%
34%
32%
19%
6%
8%
2%
3%
12%
38%
28%
14%
11%
17%
14%
12%
11%
12%
33%
8%
4%
38%
31%
33%
27%
43%
35%
17%
8%
11%
10%
7%
18%
13%
9%
21%
13%
12%
21%
8%
11%
11%
28%
6%
6%
16%
27%
22%
19%
14%
17%
9%
13%
1%
4%
18%
3%
33%
22%
40%
39%
42%
8%
6%
22%
17%
15%
27%
26%
10%
16%
3%
9%
16%
11%
8%
20%
21%
24%
16%
17%
20%
3%
6%
1%
2%
0%
43%
18%
64%
25%
61%
43%
51%
63%
16%
10%
11%
9%
14%
11%
14%
19%
15%
14%
8%
14%
9%
20%
9%
17%
8%
13%
20%
14%
6%
2%
16%
2%
12%
19%
1%
13%
18%
48%
4%
20%
4%
11%
4%
8%
36%
7%
3%
12%
5%
14%
2%
0%
3%
44%
3%
14%
8%
18%
8%
9%
25%
9%
53%
8%
4%
23%
51%
12%
13%
22%
7%
13%
10%
25%
10%
5%
9%
408
539
706
239
139
436
260
251
358
182
153
429
517
124
196
272
355
627
320
159
91
219
151
132
191
180
160
184
174
83
225
202
174
569
160
320
126
223
162
734
186
534
397
Do you support or oppose the following policies proposed by some Republican presidential candidates or don't you know enough about it to say?
Ending birthright citizenship
Support or Oppose Ending Birthright Cizenship - Likely GOP Primary Voters

Support Neutral Oppose Don't know/Not sure
STATEWIDE November 2023
47%
16%
30%
7%
N
950
Voting
Registration
Registered Republican
Registered Undeclared/Not Reg.
Party ID
Independent/Democrat
Republican
Political
Ideology
Moderate
Conservative
Libertarian
Age of
Respondent
18 to 34
35 to 49
50 to 64
65 and older
Gender of
Respondent
Men
Women
Level of
Education
High school or less
Tech school/Some college
College graduate
Postgraduate work
College
Degree
College graduate
Not college graduate
Region of
State
Central/Lakes
Connecticut Valley
Manchester Area
Mass Border
North Country
Seacoast
Household
Income
Less than $45,000
$45,000 - $74,999
$75,000 - $99,999
$100,000 - $149,999
$150,000 or more
Media Usage
CNN viewer
Conservative radio listener
Epoch Times reader
Fox News viewer
Joe Rogan listener
Local NH news viewer
Newsmax viewer
NHPR listener
X (formerly Twitter) user
2020 Pres
Vote
Voted for Biden
Voted for Trump
Preferred
Candidate
Trump primary supporter
Not Trump primary supporter
37%
55%
15%
16%
44%
20%
4%
9%
52%
32%
18%
8%
22%
57%
8%
3%
56%
60%
29%
10%
19%
19%
19%
16%
45%
15%
5%
7%
49%
48%
49%
39%
20%
19%
11%
6%
28%
25%
26%
52%
2%
8%
14%
3%
40%
53%
18%
14%
32%
29%
9%
5%
39%
39%
61%
44%
14%
14%
12%
20%
40%
46%
24%
24%
8%
2%
3%
12%
51%
39%
17%
14%
24%
43%
8%
4%
55%
40%
44%
37%
50%
53%
13%
9%
21%
13%
12%
21%
24%
39%
34%
47%
20%
23%
9%
13%
1%
4%
18%
3%
41%
28%
62%
56%
57%
27%
26%
10%
16%
3%
29%
40%
27%
25%
40%
3%
6%
1%
2%
0%
53%
29%
73%
39%
72%
57%
70%
78%
29%
8%
14%
9%
20%
9%
17%
8%
13%
20%
32%
54%
7%
36%
6%
23%
23%
9%
48%
7%
3%
12%
5%
14%
2%
0%
3%
58%
10%
18%
8%
17%
78%
8%
4%
35%
64%
22%
7%
38%
20%
5%
9%
408
539
706
239
139
436
260
251
358
182
153
429
517
124
196
272
355
627
320
159
91
219
151
132
191
180
160
184
174
83
225
202
174
569
160
320
126
223
162
734
186
534
397
Do you support or oppose the following policies proposed by some Republican presidential candidates or don't you know enough about it to say?
Ending birthright citizenship
Support or Oppose Ending Birthright Cizenship - Likely GOP Primary Voters

Strongly
support
Somewhat
support
Neutral
Somewhat
oppose
Strongly
oppose
Don't
know/Not
sure
STATEWIDE November 2023
32%
19%
10%
17%
21%
2%
N
945
Voting
Registration
Registered Republican
Registered Undeclared/Not Reg.
Party ID
Independent/Democrat
Republican
Political
Ideology
Moderate
Conservative
Libertarian
Age of
Respondent
18 to 34
35 to 49
50 to 64
65 and older
Gender of
Respondent
Men
Women
Level of
Education
High school or less
Tech school/Some college
College graduate
Postgraduate work
College
Degree
College graduate
Not college graduate
Region of
State
Central/Lakes
Connecticut Valley
Manchester Area
Mass Border
North Country
Seacoast
Household
Income
Less than $45,000
$45,000 - $74,999
$75,000 - $99,999
$100,000 - $149,999
$150,000 or more
Media Usage
CNN viewer
Conservative radio listener
Epoch Times reader
Fox News viewer
Joe Rogan listener
Local NH news viewer
Newsmax viewer
NHPR listener
X (formerly Twitter) user
2020 Pres
Vote
Voted for Biden
Voted for Trump
Preferred
Candidate
Trump primary supporter
Not Trump primary supporter
24%
38%
22%
16%
6%
13%
15%
19%
30%
13%
3%
1%
36%
19%
20%
14%
12%
4%
19%
12%
10%
51%
2%
1%
62%
33%
19%
18%
23%
10%
4%
12%
12%
9%
20%
22%
7%
9%
37%
3%
1%
22%
29%
46%
38%
19%
20%
13%
24%
12%
11%
14%
19%
23%
8%
15%
28%
17%
19%
17%
1%
1%
7%
36%
29%
18%
19%
9%
11%
16%
19%
18%
23%
4%
0%
25%
33%
37%
29%
11%
15%
21%
21%
7%
7%
8%
14%
10%
12%
10%
29%
46%
32%
19%
7%
1%
1%
5%
32%
30%
21%
13%
12%
7%
21%
12%
12%
37%
2%
1%
17%
19%
27%
35%
55%
35%
12%
21%
21%
7%
29%
23%
22%
22%
3%
5%
3%
11%
24%
4%
22%
24%
3%
19%
25%
21%
26%
27%
10%
13%
12%
1%
2%
38%
16%
42%
15%
49%
21%
20%
8%
33%
14%
3%
6%
5%
17%
2%
11%
28%
24%
16%
11%
27%
29%
21%
12%
23%
0%
7%
33%
7%
63%
20%
71%
22%
39%
44%
9%
23%
18%
13%
21%
17%
22%
25%
21%
14%
14%
5%
12%
8%
5%
13%
4%
12%
6%
18%
20%
8%
24%
5%
26%
29%
15%
17%
12%
49%
3%
26%
2%
16%
2%
9%
53%
1%
1%
1%
0%
40%
1%
21%
8%
12%
4%
17%
19%
8%
68%
2%
1%
13%
56%
24%
12%
9%
12%
21%
13%
33%
4%
0%
3%
409
532
699
241
139
436
253
244
359
182
153
424
517
124
196
273
349
621
320
159
91
219
150
134
184
180
160
184
168
84
225
202
174
563
160
320
126
223
162
727
187
528
398
Do you support or oppose the following policies proposed by some Republican presidential candidates or don't you know enough about it to say?
Stopping all military funding support for Ukraine
Support or Oppose Stopping All Military Support for Ukraine - Likely GOP Primary Voters

Support Neutral Oppose Don't know/Not sure
STATEWIDE November 2023
50%
10%
38%
2%
N
945
Voting
Registration
Registered Republican
Registered Undeclared/Not Reg.
Party ID
Independent/Democrat
Republican
Political
Ideology
Moderate
Conservative
Libertarian
Age of
Respondent
18 to 34
35 to 49
50 to 64
65 and older
Gender of
Respondent
Men
Women
Level of
Education
High school or less
Tech school/Some college
College graduate
Postgraduate work
College
Degree
College graduate
Not college graduate
Region of
State
Central/Lakes
Connecticut Valley
Manchester Area
Mass Border
North Country
Seacoast
Household
Income
Less than $45,000
$45,000 - $74,999
$75,000 - $99,999
$100,000 - $149,999
$150,000 or more
Media Usage
CNN viewer
Conservative radio listener
Epoch Times reader
Fox News viewer
Joe Rogan listener
Local NH news viewer
Newsmax viewer
NHPR listener
X (formerly Twitter) user
2020 Pres
Vote
Voted for Biden
Voted for Trump
Preferred
Candidate
Trump primary supporter
Not Trump primary supporter
45%
54%
6%
13%
46%
32%
3%
1%
56%
33%
12%
4%
30%
62%
2%
1%
80%
56%
29%
4%
12%
12%
16%
29%
59%
3%
1%
40%
49%
59%
61%
12%
11%
14%
47%
40%
27%
31%
1%
1%
7%
53%
48%
9%
11%
34%
42%
4%
0%
36%
48%
58%
50%
7%
7%
8%
14%
56%
44%
29%
35%
1%
1%
5%
54%
43%
12%
7%
33%
49%
2%
1%
29%
40%
48%
42%
84%
58%
22%
22%
3%
5%
3%
11%
49%
25%
49%
50%
13%
32%
12%
1%
2%
58%
37%
49%
48%
63%
3%
6%
5%
17%
2%
38%
58%
46%
28%
35%
0%
7%
56%
25%
76%
41%
88%
43%
64%
64%
24%
14%
5%
12%
8%
5%
13%
4%
12%
6%
30%
69%
12%
51%
7%
43%
31%
23%
70%
1%
1%
1%
0%
61%
9%
12%
4%
26%
86%
2%
1%
37%
68%
9%
12%
54%
17%
0%
3%
409
532
699
241
139
436
253
244
359
182
153
424
517
124
196
273
349
621
320
159
91
219
150
134
184
180
160
184
168
84
225
202
174
563
160
320
126
223
162
727
187
528
398
Do you support or oppose the following policies proposed by some Republican presidential candidates or don't you know enough about it to say?
Stopping all military funding support for Ukraine
Support or Oppose Stopping All Military Support for Ukraine - Likely GOP Primary Voters

Strongly
support
Somewhat
support
Neutral
Somewhat
oppose
Strongly
oppose
Don't
know/Not
sure
STATEWIDE November 2023
53%
16%
12%
4%
4%
10%
N
950
Voting
Registration
Registered Republican
Registered Undeclared/Not Reg.
Party ID
Independent/Democrat
Republican
Political
Ideology
Moderate
Conservative
Libertarian
Age of
Respondent
18 to 34
35 to 49
50 to 64
65 and older
Gender of
Respondent
Men
Women
Level of
Education
High school or less
Tech school/Some college
College graduate
Postgraduate work
College
Degree
College graduate
Not college graduate
Region of
State
Central/Lakes
Connecticut Valley
Manchester Area
Mass Border
North Country
Seacoast
Household
Income
Less than $45,000
$45,000 - $74,999
$75,000 - $99,999
$100,000 - $149,999
$150,000 or more
Media Usage
CNN viewer
Conservative radio listener
Epoch Times reader
Fox News viewer
Joe Rogan listener
Local NH news viewer
Newsmax viewer
NHPR listener
X (formerly Twitter) user
2020 Pres
Vote
Voted for Biden
Voted for Trump
Preferred
Candidate
Trump primary supporter
Not Trump primary supporter
45%
60%
20%
13%
15%
10%
6%
3%
5%
4%
10%
11%
61%
31%
15%
19%
9%
21%
3%
8%
2%
10%
10%
11%
93%
58%
33%
4%
14%
29%
0%
10%
23%
1%
3%
6%
2%
3%
4%
0%
13%
5%
55%
47%
68%
49%
14%
21%
8%
17%
10%
12%
10%
18%
7%
4%
3%
2%
5%
6%
4%
1%
9%
11%
7%
13%
46%
59%
15%
17%
12%
12%
4%
4%
5%
4%
18%
4%
44%
51%
59%
53%
18%
22%
11%
16%
16%
8%
9%
15%
7%
4%
3%
4%
6%
5%
6%
2%
9%
10%
11%
11%
56%
48%
14%
20%
12%
11%
3%
5%
4%
6%
11%
9%
57%
49%
43%
42%
84%
50%
19%
9%
18%
15%
8%
21%
7%
16%
9%
24%
1%
15%
5%
6%
4%
6%
2%
3%
5%
7%
5%
8%
1%
2%
7%
13%
21%
4%
4%
9%
53%
39%
55%
57%
55%
11%
18%
23%
12%
22%
10%
22%
9%
6%
8%
4%
4%
5%
6%
1%
6%
4%
3%
3%
12%
15%
12%
5%
16%
2%
64%
36%
77%
41%
86%
62%
58%
77%
33%
13%
21%
5%
22%
5%
13%
13%
6%
27%
17%
17%
3%
15%
2%
9%
16%
3%
16%
0%
8%
4%
5%
4%
3%
2%
5%
3%
6%
4%
5%
1%
4%
2%
2%
12%
3%
12%
7%
12%
6%
7%
8%
9%
7%
64%
7%
14%
24%
8%
29%
2%
11%
2%
14%
9%
15%
42%
69%
23%
7%
13%
9%
6%
2%
5%
3%
11%
9%
408
539
706
239
139
436
260
251
358
182
153
429
517
124
196
272
355
627
320
159
91
219
151
132
191
180
160
184
174
83
225
202
174
569
160
320
126
223
162
734
186
534
398
Do you support or oppose the following policies proposed by some Republican presidential candidates or don't you know enough about it to say?
Returning federal spending to pre-COVID-19 levels
Support or Oppose Returning Federal Spending to Pre COVID-19 Levels - Likely GOP Primary Voters

Support Neutral Oppose Don't know/Not sure
STATEWIDE November 2023
69%
12%
8%
10%
N
950
Voting
Registration
Registered Republican
Registered Undeclared/Not Reg.
Party ID
Independent/Democrat
Republican
Political
Ideology
Moderate
Conservative
Libertarian
Age of
Respondent
18 to 34
35 to 49
50 to 64
65 and older
Gender of
Respondent
Men
Women
Level of
Education
High school or less
Tech school/Some college
College graduate
Postgraduate work
College
Degree
College graduate
Not college graduate
Region of
State
Central/Lakes
Connecticut Valley
Manchester Area
Mass Border
North Country
Seacoast
Household
Income
Less than $45,000
$45,000 - $74,999
$75,000 - $99,999
$100,000 - $149,999
$150,000 or more
Media Usage
CNN viewer
Conservative radio listener
Epoch Times reader
Fox News viewer
Joe Rogan listener
Local NH news viewer
Newsmax viewer
NHPR listener
X (formerly Twitter) user
2020 Pres
Vote
Voted for Biden
Voted for Trump
Preferred
Candidate
Trump primary supporter
Not Trump primary supporter
64%
73%
15%
10%
11%
6%
10%
11%
76%
49%
9%
21%
5%
19%
10%
11%
97%
72%
62%
0%
10%
23%
3%
5%
10%
0%
13%
5%
69%
67%
76%
66%
10%
12%
10%
18%
12%
10%
7%
3%
9%
11%
7%
13%
61%
76%
12%
12%
9%
8%
18%
4%
62%
72%
71%
69%
16%
8%
9%
15%
13%
10%
9%
6%
9%
10%
11%
11%
70%
68%
12%
11%
7%
11%
11%
9%
76%
58%
61%
57%
92%
72%
7%
16%
9%
24%
1%
15%
10%
13%
9%
15%
3%
4%
7%
13%
21%
4%
4%
9%
64%
57%
78%
69%
77%
10%
22%
9%
6%
8%
11%
9%
8%
9%
13%
15%
12%
5%
16%
2%
77%
57%
81%
64%
91%
75%
71%
84%
60%
17%
17%
3%
15%
2%
9%
16%
3%
16%
3%
14%
8%
10%
1%
8%
5%
5%
17%
3%
12%
7%
12%
6%
7%
8%
9%
7%
78%
31%
8%
29%
5%
25%
9%
15%
65%
76%
13%
9%
11%
5%
11%
9%
408
539
706
239
139
436
260
251
358
182
153
429
517
124
196
272
355
627
320
159
91
219
151
132
191
180
160
184
174
83
225
202
174
569
160
320
126
223
162
734
186
534
398
Do you support or oppose the following policies proposed by some Republican presidential candidates or don't you know enough about it to say?
Returning federal spending to pre-COVID-19 levels
Support or Oppose Returning Federal Spending to Pre COVID-19 Levels - Likely GOP Primary Voters

Strongly
support
Somewhat
support
Neutral
Somewhat
oppose
Strongly
oppose
Don't
know/Not
sure
STATEWIDE November 2023
45%
16%
12%
12%
13%
1%
N
950
Voting
Registration
Registered Republican
Registered Undeclared/Not Reg.
Party ID
Independent/Democrat
Republican
Political
Ideology
Moderate
Conservative
Libertarian
Age of
Respondent
18 to 34
35 to 49
50 to 64
65 and older
Gender of
Respondent
Men
Women
Level of
Education
High school or less
Tech school/Some college
College graduate
Postgraduate work
College
Degree
College graduate
Not college graduate
Region of
State
Central/Lakes
Connecticut Valley
Manchester Area
Mass Border
North Country
Seacoast
Household
Income
Less than $45,000
$45,000 - $74,999
$75,000 - $99,999
$100,000 - $149,999
$150,000 or more
Media Usage
CNN viewer
Conservative radio listener
Epoch Times reader
Fox News viewer
Joe Rogan listener
Local NH news viewer
Newsmax viewer
NHPR listener
X (formerly Twitter) user
2020 Pres
Vote
Voted for Biden
Voted for Trump
Preferred
Candidate
Trump primary supporter
Not Trump primary supporter
32%
55%
9%
22%
19%
7%
15%
10%
24%
5%
2%
1%
54%
19%
20%
5%
10%
18%
10%
17%
5%
37%
1%
2%
50%
58%
26%
15%
21%
12%
21%
10%
16%
4%
8%
25%
7%
3%
19%
2%
1%
1%
48%
38%
55%
46%
15%
21%
13%
8%
8%
16%
10%
15%
15%
13%
7%
11%
11%
11%
16%
19%
2%
2%
33%
56%
18%
15%
17%
8%
14%
11%
16%
11%
2%
0%
35%
38%
42%
55%
13%
13%
15%
20%
8%
10%
15%
13%
13%
12%
17%
8%
29%
27%
9%
4%
3%
1%
2%
49%
37%
18%
13%
14%
9%
12%
12%
6%
28%
1%
2%
47%
42%
38%
43%
57%
47%
16%
6%
21%
13%
12%
19%
6%
18%
13%
4%
20%
16%
16%
23%
9%
17%
6%
8%
13%
10%
17%
23%
6%
9%
1%
2%
1%
0%
2%
44%
46%
37%
57%
34%
22%
10%
19%
14%
17%
8%
11%
21%
7%
9%
11%
9%
11%
14%
13%
15%
23%
12%
6%
25%
1%
0%
0%
2%
1%
60%
20%
80%
35%
69%
64%
74%
68%
24%
11%
22%
9%
21%
7%
13%
13%
22%
18%
10%
8%
2%
12%
16%
7%
4%
2%
10%
9%
15%
7%
15%
4%
9%
4%
4%
21%
8%
32%
1%
14%
4%
5%
5%
3%
25%
1%
2%
0%
2%
2%
0%
1%
3%
56%
3%
18%
7%
11%
18%
9%
24%
5%
46%
1%
3%
26%
71%
20%
10%
17%
5%
16%
7%
18%
7%
2%
0%
409
537
704
241
139
435
260
250
359
182
153
430
516
124
196
272
355
627
320
159
91
217
150
134
191
180
160
184
173
84
224
202
174
569
160
319
126
222
161
733
187
534
398
Do you support or oppose the following policies proposed by some Republican presidential candidates or do you not know enough about them to
say? Banning any Gaza refugees from coming to the United States
Support or Oppose Banning Gaza Refugees from Entering United States - Likely GOP Primary Voters

Support Neutral Oppose Don't know/Not sure
STATEWIDE November 2023
61%
12%
25%
1%
N
950
Voting
Registration
Registered Republican
Registered Undeclared/Not Reg.
Party ID
Independent/Democrat
Republican
Political
Ideology
Moderate
Conservative
Libertarian
Age of
Respondent
18 to 34
35 to 49
50 to 64
65 and older
Gender of
Respondent
Men
Women
Level of
Education
High school or less
Tech school/Some college
College graduate
Postgraduate work
College
Degree
College graduate
Not college graduate
Region of
State
Central/Lakes
Connecticut Valley
Manchester Area
Mass Border
North Country
Seacoast
Household
Income
Less than $45,000
$45,000 - $74,999
$75,000 - $99,999
$100,000 - $149,999
$150,000 or more
Media Usage
CNN viewer
Conservative radio listener
Epoch Times reader
Fox News viewer
Joe Rogan listener
Local NH news viewer
Newsmax viewer
NHPR listener
X (formerly Twitter) user
2020 Pres
Vote
Voted for Biden
Voted for Trump
Preferred
Candidate
Trump primary supporter
Not Trump primary supporter
41%
76%
19%
7%
38%
16%
2%
1%
73%
25%
10%
18%
15%
55%
1%
2%
65%
79%
39%
21%
10%
16%
11%
10%
44%
2%
1%
1%
64%
59%
67%
54%
8%
16%
10%
15%
26%
24%
23%
30%
2%
2%
50%
70%
17%
8%
30%
22%
2%
0%
47%
51%
57%
75%
8%
10%
15%
13%
42%
38%
26%
12%
3%
1%
2%
67%
50%
14%
9%
18%
40%
1%
2%
63%
48%
59%
56%
68%
66%
6%
18%
13%
4%
20%
16%
29%
34%
26%
40%
12%
17%
1%
2%
1%
0%
2%
66%
56%
56%
71%
51%
8%
11%
21%
7%
9%
25%
32%
22%
20%
38%
1%
0%
0%
2%
1%
71%
42%
89%
57%
76%
77%
87%
90%
41%
10%
8%
2%
12%
16%
7%
4%
2%
10%
17%
47%
9%
29%
8%
14%
9%
8%
46%
1%
2%
0%
2%
2%
0%
1%
3%
74%
10%
11%
18%
14%
70%
1%
3%
46%
81%
17%
5%
34%
14%
2%
0%
409
537
704
241
139
435
260
250
359
182
153
430
516
124
196
272
355
627
320
159
91
217
150
134
191
180
160
184
173
84
224
202
174
569
160
319
126
222
161
733
187
534
398
Do you support or oppose the following policies proposed by some Republican presidential candidates or do you not know enough about them to
say? Banning any Gaza refugees from coming to the United States
Support or Oppose Banning Gaza Refugees from Entering United States - Likely GOP Primary Voters

Watched all of
the debate
Watched most
of the debate
Did not watch
much of the
debate, but paid
close attention
to news stories
afterwards
Neither
watched the
debate nor paid
attention to
news stories
about it
Don't
know/Can't
remember
STATEWIDE November 2023
12%
15%
33%
39%
1%
N
951
Voting
Registration
Registered Republican
Registered Undeclared/Not Reg.
Party ID
Independent/Democrat
Republican
Political
Ideology
Moderate
Conservative
Libertarian
Age of
Respondent
18 to 34
35 to 49
50 to 64
65 and older
Gender of
Respondent
Men
Women
Level of
Education
High school or less
Tech school/Some college
College graduate
Postgraduate work
College
Degree
College graduate
Not college graduate
Region of
State
Central/Lakes
Connecticut Valley
Manchester Area
Mass Border
North Country
Seacoast
Household
Income
Less than $45,000
$45,000 - $74,999
$75,000 - $99,999
$100,000 - $149,999
$150,000 or more
Media Usage
CNN viewer
Conservative radio listener
Epoch Times reader
Fox News viewer
Joe Rogan listener
Local NH news viewer
Newsmax viewer
NHPR listener
X (formerly Twitter) user
2020 Pres
Vote
Voted for Biden
Voted for Trump
Preferred
Candidate
Trump primary supporter
Not Trump primary supporter
16%
10%
15%
14%
37%
31%
32%
44%
0%
1%
11%
16%
14%
17%
33%
35%
41%
32%
1%
0%
25%
11%
9%
22%
11%
13%
20%
36%
39%
34%
42%
39%
0%
14%
7%
9%
25%
10%
14%
17%
21%
42%
36%
26%
22%
31%
42%
48%
32%
3%
15%
10%
11%
18%
28%
38%
44%
34%
2%
0%
16%
10%
18%
7%
19%
14%
10%
17%
35%
36%
36%
30%
30%
40%
35%
44%
0%
2%
12%
12%
14%
16%
33%
36%
40%
36%
1%
0%
9%
9%
10%
17%
25%
7%
26%
7%
16%
6%
20%
10%
30%
35%
31%
45%
16%
40%
35%
48%
43%
32%
39%
39%
0%
4%
15%
6%
15%
3%
16%
17%
6%
15%
26%
19%
30%
51%
30%
37%
27%
39%
37%
39%
31%
38%
4%
14%
14%
7%
12%
16%
14%
3%
9%
15%
25%
23%
18%
16%
23%
20%
33%
18%
18%
33%
40%
28%
41%
15%
47%
38%
34%
48%
27%
23%
47%
30%
46%
19%
26%
39%
18%
1%
0%
12%
11%
16%
11%
30%
45%
41%
33%
1%
17%
7%
16%
13%
37%
29%
29%
50%
0%
2%
409
539
706
241
139
436
260
251
359
182
153
430
517
124
196
273
355
628
320
159
91
219
151
133
191
180
160
184
174
84
225
202
174
570
160
320
126
223
162
734
187
535
398
Five Republican candidates met for a debate in Miami, Florida, on November 8th. Which of the following best describes you?
Interacon with November Republican Primary Debate - Likely GOP Primary Voters

Yes No Don't know/Not sure
STATEWIDE November 2023
45%
47%
8%
N
949
Voting
Registration
Registered Republican
Registered Undeclared/Not Reg.
Party ID
Independent/Democrat
Republican
Political
Ideology
Moderate
Conservative
Libertarian
Age of
Respondent
18 to 34
35 to 49
50 to 64
65 and older
Gender of
Respondent
Men
Women
Level of
Education
High school or less
Tech school/Some college
College graduate
Postgraduate work
College
Degree
College graduate
Not college graduate
Region of
State
Central/Lakes
Connecticut Valley
Manchester Area
Mass Border
North Country
Seacoast
Household
Income
Less than $45,000
$45,000 - $74,999
$75,000 - $99,999
$100,000 - $149,999
$150,000 or more
Media Usage
CNN viewer
Conservative radio listener
Epoch Times reader
Fox News viewer
Joe Rogan listener
Local NH news viewer
Newsmax viewer
NHPR listener
X (formerly Twitter) user
2020 Pres
Vote
Voted for Biden
Voted for Trump
Preferred
Candidate
Trump primary supporter
Not Trump primary supporter
52%
40%
41%
51%
7%
9%
43%
52%
49%
41%
9%
6%
30%
39%
56%
63%
56%
31%
7%
6%
13%
33%
48%
49%
56%
55%
43%
47%
40%
12%
9%
4%
4%
47%
44%
46%
48%
7%
9%
51%
49%
34%
49%
40%
46%
58%
42%
9%
5%
8%
9%
43%
50%
49%
43%
9%
7%
39%
54%
47%
49%
41%
43%
49%
36%
48%
43%
59%
44%
12%
11%
4%
7%
1%
13%
50%
47%
47%
40%
41%
42%
47%
52%
45%
57%
8%
7%
1%
15%
2%
45%
52%
12%
54%
44%
40%
46%
34%
54%
45%
42%
81%
35%
52%
52%
47%
61%
41%
10%
7%
7%
10%
4%
8%
6%
5%
5%
40%
66%
52%
30%
9%
4%
60%
26%
31%
69%
9%
5%
408
538
705
239
139
435
258
248
359
182
153
429
516
123
196
270
355
626
319
159
90
218
151
134
191
180
160
184
172
84
225
201
174
567
160
319
126
222
162
732
187
534
397
Donald Trump qualified for the debate on November 8th but chose not to participate. Would you have preferred Trump to have participated in the
debate?
Wish Trump Had Parcipated in November Republican Primary Debate - Likely GOP Primary Voters

Chris Christie Ron DeSantis Nikki Haley
Vivek
Ramaswamy
Tim Scott
Don't
know/Not
sure
STATEWIDE November 2023
9%
10%
37%
26%
1%
16%
N
575
Voting
Registration
Registered Republican
Registered Undeclared/Not Reg.
Party ID
Independent/Democrat
Republican
Political
Ideology
Moderate
Conservative
Libertarian
Age of
Respondent
18 to 34
35 to 49
50 to 64
65 and older
Gender of
Respondent
Men
Women
Level of
Education
High school or less
Tech school/Some college
College graduate
Postgraduate work
College
Degree
College graduate
Not college graduate
Region of
State
Central/Lakes
Connecticut Valley
Manchester Area
Mass Border
North Country
Seacoast
Household
Income
Less than $45,000
$45,000 - $74,999
$75,000 - $99,999
$100,000 - $149,999
$150,000 or more
Media Usage
CNN viewer
Conservative radio listener
Epoch Times reader
Fox News viewer
Joe Rogan listener
Local NH news viewer
Newsmax viewer
NHPR listener
X (formerly Twitter) user
2020 Pres
Vote
Voted for Biden
Voted for Trump
Preferred
Candidate
Trump primary supporter
Not Trump primary supporter
16%
3%
8%
13%
37%
38%
27%
25%
1%
1%
12%
20%
5%
19%
14%
2%
36%
41%
26%
26%
2%
0%
18%
11%
7%
2%
8%
20%
13%
4%
4%
38%
63%
53%
25%
10%
1%
1%
2%
16%
21%
12%
7%
11%
16%
2%
10%
11%
10%
9%
48%
41%
29%
18%
12%
15%
25%
71%
1%
2%
3%
21%
20%
17%
11%
8%
7%
12%
39%
36%
23%
28%
1%
2%
19%
14%
9%
11%
9%
8%
11%
7%
8%
13%
42%
44%
30%
38%
22%
20%
32%
25%
1%
2%
2%
14%
15%
19%
16%
9%
10%
10%
9%
34%
43%
29%
21%
1%
2%
17%
15%
9%
5%
5%
25%
4%
6%
8%
10%
7%
4%
15%
18%
61%
45%
34%
24%
15%
42%
8%
19%
25%
31%
58%
20%
0%
3%
2%
1%
15%
22%
25%
14%
9%
13%
8%
7%
6%
7%
33%
8%
8%
8%
11%
9%
36%
41%
48%
32%
16%
29%
24%
28%
33%
15%
0%
1%
2%
2%
3%
18%
19%
8%
16%
23%
5%
16%
2%
12%
2%
3%
0%
1%
21%
10%
14%
7%
11%
8%
9%
12%
18%
1%
29%
47%
36%
39%
9%
45%
10%
36%
50%
48%
5%
33%
20%
75%
22%
69%
21%
5%
1%
1%
1%
1%
0%
1%
0%
7%
18%
20%
17%
5%
20%
8%
24%
23%
4%
27%
11%
1%
33%
56%
33%
0%
2%
0%
17%
16%
11%
5%
7%
16%
45%
23%
20%
37%
1%
1%
15%
17%
279
294
407
164
92
252
158
165
207
95
105
233
339
86
117
177
192
370
203
103
47
125
103
81
110
111
100
111
114
53
164
156
93
395
86
257
93
136
133
427
124
377
191
Which candidate do you think had the best performance in the debate on November 8th?
Who Believe Won November Republican Primary Debate - Likely GOP Primary Voters

Very interested
Somewhat
interested
Not very
interested
Not at all
interested
Don't know/Not
sure
STATEWIDE November 2023
21%
33%
26%
19%
1%
N
948
Voting
Registration
Registered Republican
Registered Undeclared/Not Reg.
Party ID
Independent/Democrat
Republican
Political
Ideology
Moderate
Conservative
Libertarian
Age of
Respondent
18 to 34
35 to 49
50 to 64
65 and older
Gender of
Respondent
Men
Women
Level of
Education
High school or less
Tech school/Some college
College graduate
Postgraduate work
College
Degree
College graduate
Not college graduate
Region of
State
Central/Lakes
Connecticut Valley
Manchester Area
Mass Border
North Country
Seacoast
Household
Income
Less than $45,000
$45,000 - $74,999
$75,000 - $99,999
$100,000 - $149,999
$150,000 or more
Media Usage
CNN viewer
Conservative radio listener
Epoch Times reader
Fox News viewer
Joe Rogan listener
Local NH news viewer
Newsmax viewer
NHPR listener
X (formerly Twitter) user
2020 Pres
Vote
Voted for Biden
Voted for Trump
Preferred
Candidate
Trump primary supporter
Not Trump primary supporter
24%
19%
35%
32%
22%
28%
17%
20%
1%
1%
23%
15%
30%
41%
29%
17%
17%
24%
1%
2%
17%
22%
24%
40%
34%
27%
32%
25%
29%
12%
19%
19%
0%
1%
18%
21%
15%
36%
31%
39%
23%
33%
22%
20%
49%
17%
25%
20%
12%
13%
4%
0%
1%
1%
20%
22%
37%
30%
21%
29%
19%
19%
3%
0%
24%
22%
24%
18%
28%
27%
38%
34%
26%
26%
20%
29%
18%
24%
17%
17%
3%
0%
1%
2%
20%
23%
36%
28%
25%
26%
17%
22%
1%
1%
14%
30%
18%
39%
18%
16%
35%
27%
32%
24%
40%
35%
29%
23%
29%
20%
23%
26%
21%
20%
18%
17%
19%
19%
1%
2%
4%
18%
33%
11%
21%
34%
38%
22%
36%
45%
25%
23%
21%
44%
21%
18%
21%
25%
8%
9%
23%
1%
0%
1%
4%
25%
27%
13%
28%
8%
34%
27%
20%
26%
34%
35%
12%
35%
42%
30%
40%
22%
36%
22%
20%
50%
20%
42%
27%
17%
37%
21%
18%
16%
24%
15%
8%
8%
16%
21%
15%
1%
2%
2%
1%
1%
21%
17%
33%
32%
26%
23%
18%
26%
1%
3%
24%
17%
41%
21%
16%
38%
17%
22%
1%
2%
407
538
703
241
139
436
257
251
358
182
153
428
517
124
196
270
355
625
319
159
91
216
150
134
191
180
160
181
174
84
225
202
174
567
160
318
126
223
159
731
187
532
398
How interested would you say that you are in further Republican primary debates?
Interest in Further Republican Primary Debates - Likely GOP Primary Voters

Attended an event featuring a
2024 presidential candidate
Donated to a 2024 presidential
candidate
Met a 2024 presidential
candidate
STATEWIDE November 2023
18%
12%
12%
Voting
Registration
Registered Republican
Registered Undeclared/Not Reg.
Party ID
Independent/Democrat
Republican
Political
Ideology
Moderate
Conservative
Libertarian
Age of
Respondent
18 to 34
35 to 49
50 to 64
65 and older
Gender of
Respondent
Men
Women
Level of
Education
High school or less
Tech school/Some college
College graduate
Postgraduate work
College
Degree
College graduate
Not college graduate
Region of
State
Central/Lakes
Connecticut Valley
Manchester Area
Mass Border
North Country
Seacoast
Household
Income
Less than $45,000
$45,000 - $74,999
$75,000 - $99,999
$100,000 - $149,999
$150,000 or more
Media Usage
CNN viewer
Conservative radio listener
Epoch Times reader
Fox News viewer
Joe Rogan listener
Local NH news viewer
Newsmax viewer
NHPR listener
X (formerly Twitter) user
2020 Pres
Vote
Voted for Biden
Voted for Trump
Preferred
Candidate
Trump primary supporter
Not Trump primary supporter
12%
22%
9%
15%
11%
12%
20%
13%
14%
6%
12%
13%
30%
16%
11%
9%
17%
7%
25%
12%
7%
15%
13%
22%
28%
23%
12%
8%
2%
10%
10%
10%
20%
19%
16%
13%
12%
15%
9%
27%
11%
12%
22%
17%
12%
13%
11%
20%
9%
21%
3%
18%
17%
12%
14%
11%
13%
14%
18%
11%
12%
40%
18%
18%
15%
11%
12%
7%
13%
13%
7%
11%
8%
17%
13%
21%
5%
14%
15%
6%
14%
7%
12%
12%
15%
16%
3%
19%
5%
6%
31%
20%
36%
17%
32%
15%
35%
18%
13%
14%
17%
20%
10%
9%
13%
17%
12%
8%
16%
13%
17%
12%
20%
12%
11%
12%
13%
20%
6%
14%
9%
14%
4%
16%
20%
10%
16%
12%
12%
Which of the following things, if any, have you done in the past year? (Please select all that apply)
Polical Acvies Engaged in Over Past Year - Likely GOP Primary Voters

Put a bumper sticker of a
2024 presidential candidate
on your car or personal item
Put a sign of a 2024
presidential candidate on
your yard or elsewhere on
your property
Volunteered for a 2024
presidential candidate
STATEWIDE November 2023
4%
8%
1%
N
947
Voting
Registration
Registered Republican
Registered Undeclared/Not Reg.
Party ID
Independent/Democrat
Republican
Political
Ideology
Moderate
Conservative
Libertarian
Age of
Respondent
18 to 34
35 to 49
50 to 64
65 and older
Gender of
Respondent
Men
Women
Level of
Education
High school or less
Tech school/Some college
College graduate
Postgraduate work
College
Degree
College graduate
Not college graduate
Region of
State
Central/Lakes
Connecticut Valley
Manchester Area
Mass Border
North Country
Seacoast
Household
Income
Less than $45,000
$45,000 - $74,999
$75,000 - $99,999
$100,000 - $149,999
$150,000 or more
Media Usage
CNN viewer
Conservative radio listener
Epoch Times reader
Fox News viewer
Joe Rogan listener
Local NH news viewer
Newsmax viewer
NHPR listener
X (formerly Twitter) user
2020 Pres
Vote
Voted for Biden
Voted for Trump
Preferred
Candidate
Trump primary supporter
Not Trump primary supporter
1%
6%
4%
12%
1%
2%
5%
2%
11%
1%
2%
0%
1%
6%
2%
3%
13%
3%
1%
1%
2%
5%
5%
1%
2%
10%
12%
5%
2%
2%
2%
4%
4%
12%
5%
2%
1%
5%
4%
4%
3%
11%
3%
8%
10%
2%
2%
2%
4%
4%
9%
6%
1%
2%
4%
3%
10%
1%
3%
1%
4%
6%
11%
13%
9%
6%
1%
0%
2%
2%
2%
0%
8%
4%
3%
3%
2%
10%
7%
10%
4%
13%
2%
0%
1%
2%
0%
5%
4%
13%
3%
2%
7%
8%
10%
11%
7%
9%
14%
7%
6%
9%
16%
11%
4%
2%
1%
2%
1%
2%
2%
2%
3%
1%
5%
2%
11%
1%
1%
1%
3%
6%
3%
16%
1%
1%
405
538
703
239
139
436
256
251
357
182
153
427
516
124
195
269
355
624
319
160
91
216
151
134
189
180
158
181
174
85
225
202
174
566
160
317
126
223
160
731
186
530
397
Which of the following things, if any, have you done in the past year? (Please select all that apply)
Polical Acvies Engaged in Over Past Year - Likely GOP Primary Voters

Attended an event Donated to Met
STATEWIDE November 2023
1%
0%
1%
N
631
Voting
Registration
Registered Republican
Registered Undeclared/Not Reg.
Party ID
Independent/Democrat
Republican
Political
Ideology
Moderate
Conservative
Libertarian
Age of
Respondent
18 to 34
35 to 49
50 to 64
65 and older
Gender of
Respondent
Men
Women
Level of
Education
High school or less
Tech school/Some college
College graduate
Postgraduate work
College
Degree
College graduate
Not college graduate
Region of
State
Central/Lakes
Connecticut Valley
Manchester Area
Mass Border
North Country
Seacoast
Household
Income
Less than $45,000
$45,000 - $74,999
$75,000 - $99,999
$100,000 - $149,999
$150,000 or more
Media Usage
CNN viewer
Conservative radio listener
Epoch Times reader
Fox News viewer
Joe Rogan listener
Local NH news viewer
Newsmax viewer
NHPR listener
X (formerly Twitter) user
2020 Pres
Vote
Voted for Biden
Voted for Trump
Preferred
Candidate
Trump primary supporter
Not Trump primary supporter
0%
1%
0%
0%
0%
1%
1%
1%
0%
1%
0%
3%
0%
1%
0%
0%
1%
3%
1%
0%
0%
0%
3%
1%
0%
1%
1%
2%
1%
0%
1%
1%
1%
0%
1%
2%
0%
1%
1%
1%
0%
1%
0%
1%
1%
2%
1%
1%
1%
0%
1%
2%
0%
1%
0%
0%
0%
0%
1%
1%
0%
0%
0%
0%
1%
2%
0%
0%
0%
1%
1%
2%
1%
0%
1%
2%
1%
0%
0%
0%
1%
0%
1%
0%
2%
1%
0%
2%
0%
0%
1%
0%
0%
1%
1%
0%
1%
0%
1%
0%
1%
1%
280
350
459
170
64
283
212
160
257
122
91
269
359
79
152
171
226
397
231
116
60
152
111
46
139
112
136
112
124
58
132
136
73
411
70
222
65
147
123
459
157
380
238
With which of the following 2024 presidential candidates have you done each of these things in the past year? (Please select all that apply) - Doug
Burgum
Polical Acvies Engaged in with Doug Burgum Over Past Year - Likely GOP Primary Voters

Attended an event
Displayed bumper
sticker
Donated to Met
STATEWIDE November 2023
2%
0%
1%
2%
N
642
Voting
Registration
Registered Republican
Registered Undeclared/Not Reg.
Party ID
Independent/Democrat
Republican
Political
Ideology
Moderate
Conservative
Libertarian
Age of
Respondent
18 to 34
35 to 49
50 to 64
65 and older
Gender of
Respondent
Men
Women
Level of
Education
High school or less
Tech school/Some college
College graduate
Postgraduate work
College
Degree
College graduate
Not college graduate
Region of
State
Central/Lakes
Connecticut Valley
Manchester Area
Mass Border
North Country
Seacoast
Household
Income
Less than $45,000
$45,000 - $74,999
$75,000 - $99,999
$100,000 - $149,999
$150,000 or more
Media Usage
CNN viewer
Conservative radio listener
Epoch Times reader
Fox News viewer
Joe Rogan listener
Local NH news viewer
Newsmax viewer
NHPR listener
X (formerly Twitter) user
2020 Pres
Vote
Voted for Biden
Voted for Trump
Preferred
Candidate
Trump primary supporter
Not Trump primary supporter
2%
3%
0%
1%
1%
2%
2%
3%
2%
0%
1%
1%
2%
1%
3%
2%
2%
0%
3%
1%
3%
2%
1%
2%
1%
3%
5%
0%
0%
1%
1%
2%
1%
3%
4%
1%
3%
0%
1%
1%
1%
3%
9%
3%
0%
0%
1%
1%
1%
8%
2%
0%
0%
5%
0%
0%
1%
0%
4%
3%
4%
3%
1%
1%
0%
1%
0%
0%
1%
4%
0%
2%
0%
5%
1%
1%
0%
6%
1%
0%
1%
2%
0%
2%
0%
0%
6%
1%
0%
0%
4%
7%
1%
3%
2%
3%
1%
1%
6%
0%
3%
1%
1%
1%
1%
4%
6%
1%
3%
1%
2%
2%
1%
4%
2%
2%
0%
0%
2%
2%
2%
4%
0%
0%
1%
3%
1%
285
355
466
174
64
289
214
163
261
122
95
272
367
87
157
170
226
396
243
118
60
158
114
47
139
119
135
112
125
59
136
146
71
421
71
228
66
146
127
463
162
390
239
With which of the following 2024 presidential candidates have you done each of these things in the past year? (Please select all that apply) - Chris
Christie
Polical Acvies Engaged in with Chris Chrise Over Past Year - Likely GOP Primary Voters

Attended an
event
Displayed
bumper
sticker
Displayed
sign
Donated to Met
Volunteered
for
STATEWIDE November 2023
8%
0%
1%
2%
4%
0%
N
679
Voting
Registration
Registered Republican
Registered Undeclared/Not Reg.
Party ID
Independent/Democrat
Republican
Political
Ideology
Moderate
Conservative
Libertarian
Age of
Respondent
18 to 34
35 to 49
50 to 64
65 and older
Gender of
Respondent
Men
Women
Level of
Education
High school or less
Tech school/Some college
College graduate
Postgraduate work
College
Degree
College graduate
Not college graduate
Region of
State
Central/Lakes
Connecticut Valley
Manchester Area
Mass Border
North Country
Seacoast
Household
Income
Less than $45,000
$45,000 - $74,999
$75,000 - $99,999
$100,000 - $149,999
$150,000 or more
Media Usage
CNN viewer
Conservative radio listener
Epoch Times reader
Fox News viewer
Joe Rogan listener
Local NH news viewer
Newsmax viewer
NHPR listener
X (formerly Twitter) user
2020 Pres
Vote
Voted for Biden
Voted for Trump
Preferred
Candidate
Trump primary supporter
Not Trump primary supporter
10%
5%
1%
1%
3%
1%
3%
4%
1%
6%
11%
1%
0%
1%
2%
0%
4%
2%
1%
18%
4%
2%
2%
1%
0%
5%
1%
5%
3%
1%
3%
5%
2%
2%
1%
4%
3%
3%
27%
1%
0%
1%
0%
2%
4%
1%
2%
2%
4%
5%
4%
1%
0%
1%
11%
0%
1%
0%
1%
1%
3%
2%
4%
0%
1%
11%
1%
4%
11%
1%
0%
1%
1%
1%
4%
2%
1%
2%
9%
2%
6%
1%
1%
9%
5%
0%
0%
0%
0%
1%
3%
3%
4%
0%
0%
5%
1%
5%
1%
40%
3%
1%
3%
2%
1%
3%
4%
2%
1%
2%
4%
0%
4%
1%
7%
1%
2%
3%
1%
3%
8%
2%
2%
15%
0%
1%
1%
1%
1%
3%
1%
4%
2%
9%
4%
2%
3%
1%
1%
22%
11%
5%
6%
22%
5%
25%
10%
6%
1%
1%
1%
1%
1%
1%
1%
1%
1%
1%
1%
1%
2%
1%
3%
1%
3%
4%
3%
2%
0%
5%
6%
2%
5%
0%
4%
4%
3%
4%
1%
1%
1%
1%
1%
2%
0%
8%
1%
1%
0%
1%
3%
5%
1%
1%
10%
2%
1%
1%
2%
2%
4%
3%
1%
311
366
486
190
76
295
216
166
265
124
123
273
402
88
155
177
255
432
243
122
62
159
113
76
141
123
136
113
146
58
167
151
76
434
89
235
87
161
126
494
159
419
245
With which of the following 2024 presidential candidates have you done each of these things in the past year? (Please select all that apply) - Ron
DeSantis
Polical Acvies Engaged in with Ron DeSans Over Past Year - Likely GOP Primary Voters

Attended an
event
Displayed
bumper
sticker
Displayed
sign
Donated to Met
Volunteered
for
STATEWIDE November 2023
4%
1%
1%
3%
4%
0%
N
657
Voting
Registration
Registered Republican
Registered Undeclared/Not Reg.
Party ID
Independent/Democrat
Republican
Political
Ideology
Moderate
Conservative
Libertarian
Age of
Respondent
18 to 34
35 to 49
50 to 64
65 and older
Gender of
Respondent
Men
Women
Level of
Education
High school or less
Tech school/Some college
College graduate
Postgraduate work
College
Degree
College graduate
Not college graduate
Region of
State
Central/Lakes
Connecticut Valley
Manchester Area
Mass Border
North Country
Seacoast
Household
Income
Less than $45,000
$45,000 - $74,999
$75,000 - $99,999
$100,000 - $149,999
$150,000 or more
Media Usage
CNN viewer
Conservative radio listener
Epoch Times reader
Fox News viewer
Joe Rogan listener
Local NH news viewer
Newsmax viewer
NHPR listener
X (formerly Twitter) user
2020 Pres
Vote
Voted for Biden
Voted for Trump
Preferred
Candidate
Trump primary supporter
Not Trump primary supporter
1%
7%
0%
1%
0%
2%
3%
3%
2%
5%
0%
6%
1%
1%
1%
4%
0%
4%
3%
0%
4%
5%
5%
1%
1%
0%
5%
2%
4%
4%
4%
0%
4%
5%
3%
5%
0%
4%
0%
0%
1%
4%
6%
1%
1%
4%
3%
4%
2%
5%
0%
3%
5%
1%
0%
1%
2%
4%
4%
3%
0%
0%
13%
4%
3%
2%
4%
7%
8%
3%
2%
2%
11%
3%
4%
1%
2%
7%
2%
2%
2%
5%
2%
6%
0%
4%
10%
6%
2%
3%
3%
0%
2%
0%
3%
2%
0%
5%
1%
5%
1%
3%
2%
4%
5%
6%
1%
3%
2%
0%
0%
12%
3%
5%
0%
2%
3%
4%
1%
0%
4%
2%
5%
1%
8%
1%
4%
2%
2%
0%
0%
5%
8%
11%
6%
2%
7%
9%
6%
10%
3%
3%
1%
2%
3%
3%
4%
1%
2%
4%
4%
4%
7%
3%
3%
7%
1%
2%
5%
7%
6%
8%
5%
5%
5%
6%
3%
7%
0%
5%
2%
1%
1%
4%
0%
4%
1%
0%
6%
1%
1%
1%
4%
2%
4%
3%
0%
284
371
483
173
65
298
222
166
272
123
95
278
376
91
158
176
229
405
249
120
67
160
114
47
142
126
138
116
125
59
139
146
82
435
71
239
71
154
133
480
160
402
242
With which of the following 2024 presidential candidates have you done each of these things in the past year? (Please select all that apply) - Nikki
Haley
Polical Acvies Engaged in with Nikki Haley Over Past Year - Likely GOP Primary Voters

Attended an event Donated to Met
STATEWIDE November 2023
1%
0%
1%
N
629
Voting
Registration
Registered Republican
Registered Undeclared/Not Reg.
Party ID
Independent/Democrat
Republican
Political
Ideology
Moderate
Conservative
Libertarian
Age of
Respondent
18 to 34
35 to 49
50 to 64
65 and older
Gender of
Respondent
Men
Women
Level of
Education
High school or less
Tech school/Some college
College graduate
Postgraduate work
College
Degree
College graduate
Not college graduate
Region of
State
Central/Lakes
Connecticut Valley
Manchester Area
Mass Border
North Country
Seacoast
Household
Income
Less than $45,000
$45,000 - $74,999
$75,000 - $99,999
$100,000 - $149,999
$150,000 or more
Media Usage
CNN viewer
Conservative radio listener
Epoch Times reader
Fox News viewer
Joe Rogan listener
Local NH news viewer
Newsmax viewer
NHPR listener
X (formerly Twitter) user
2020 Pres
Vote
Voted for Biden
Voted for Trump
Preferred
Candidate
Trump primary supporter
Not Trump primary supporter
0%
1%
0%
1%
1%
0%
0%
1%
3%
0%
1%
0%
3%
1%
0%
0%
0%
2%
0%
0%
1%
2%
0%
0%
0%
0%
0%
0%
2%
0%
0%
0%
2%
1%
1%
0%
1%
2%
0%
0%
1%
0%
0%
0%
2%
0%
1%
1%
0%
1%
0%
1%
1%
1%
0%
1%
0%
1%
0%
0%
0%
0%
0%
0%
0%
0%
1%
1%
0%
3%
0%
0%
0%
2%
1%
1%
0%
1%
0%
1%
0%
0%
1%
0%
279
348
458
169
64
282
211
159
257
121
91
270
356
79
152
170
226
395
231
116
60
151
112
46
137
112
134
112
124
58
132
135
72
409
70
221
66
144
120
456
158
378
238
With which of the following 2024 presidential candidates have you done each of these things in the past year? (Please select all that apply) - Asa
Hutchinson
Polical Acvies Engaged in with Asa Hutchinson Over Past Year - Likely GOP Primary Voters

Attended an
event
Displayed
bumper
sticker
Displayed
sign
Donated to Met
Volunteered
for
STATEWIDE November 2023
10%
0%
0%
3%
7%
0%
N
701
Voting
Registration
Registered Republican
Registered Undeclared/Not Reg.
Party ID
Independent/Democrat
Republican
Political
Ideology
Moderate
Conservative
Libertarian
Age of
Respondent
18 to 34
35 to 49
50 to 64
65 and older
Gender of
Respondent
Men
Women
Level of
Education
High school or less
Tech school/Some college
College graduate
Postgraduate work
College
Degree
College graduate
Not college graduate
Region of
State
Central/Lakes
Connecticut Valley
Manchester Area
Mass Border
North Country
Seacoast
Household
Income
Less than $45,000
$45,000 - $74,999
$75,000 - $99,999
$100,000 - $149,999
$150,000 or more
Media Usage
CNN viewer
Conservative radio listener
Epoch Times reader
Fox News viewer
Joe Rogan listener
Local NH news viewer
Newsmax viewer
NHPR listener
X (formerly Twitter) user
2020 Pres
Vote
Voted for Biden
Voted for Trump
Preferred
Candidate
Trump primary supporter
Not Trump primary supporter
8%
12%
0%
0%
4%
1%
8%
7%
0%
10%
11%
0%
0%
3%
0%
5%
12%
0%
32%
6%
3%
0%
1%
10%
3%
1%
28%
7%
1%
0%
4%
4%
16%
25%
0%
1%
0%
4%
1%
6%
3%
4%
2%
22%
0%
0%
11%
10%
0%
0%
0%
1%
4%
11%
4%
0%
0%
18%
3%
6%
15%
0%
0%
0%
0%
4%
3%
3%
2%
12%
4%
15%
1%
11%
9%
0%
0%
0%
2%
4%
7%
7%
0%
7%
3%
7%
7%
47%
4%
0%
0%
1%
4%
2%
2%
4%
1%
2%
6%
2%
4%
5%
31%
4%
1%
0%
14%
1%
2%
15%
0%
1%
0%
0%
1%
5%
0%
5%
2%
3%
9%
1%
17%
0%
0%
1%
0%
22%
4%
27%
5%
40%
7%
29%
6%
7%
0%
1%
0%
2%
0%
1%
1%
6%
0%
4%
1%
6%
3%
4%
2%
0%
12%
5%
10%
5%
26%
8%
12%
6%
7%
0%
1%
0%
14%
1%
0%
0%
3%
9%
1%
0%
9%
13%
0%
0%
0%
2%
3%
8%
5%
0%
303
395
507
192
92
301
217
165
270
142
121
303
395
95
157
181
264
445
253
123
62
161
120
86
142
130
136
114
146
58
168
141
98
429
116
239
91
155
129
526
159
412
275
With which of the following 2024 presidential candidates have you done each of these things in the past year? (Please select all that apply) - Vivek
Ramaswamy
Polical Acvies Engaged in with Vivek Ramaswamy Over Past Year - Likely GOP Primary Voters

Attended an
event
Displayed
bumper
sticker
Displayed
sign
Donated to Met
Volunteered
for
STATEWIDE November 2023
11%
4%
9%
9%
4%
1%
N
715
Voting
Registration
Registered Republican
Registered Undeclared/Not Reg.
Party ID
Independent/Democrat
Republican
Political
Ideology
Moderate
Conservative
Libertarian
Age of
Respondent
18 to 34
35 to 49
50 to 64
65 and older
Gender of
Respondent
Men
Women
Level of
Education
High school or less
Tech school/Some college
College graduate
Postgraduate work
College
Degree
College graduate
Not college graduate
Region of
State
Central/Lakes
Connecticut Valley
Manchester Area
Mass Border
North Country
Seacoast
Household
Income
Less than $45,000
$45,000 - $74,999
$75,000 - $99,999
$100,000 - $149,999
$150,000 or more
Media Usage
CNN viewer
Conservative radio listener
Epoch Times reader
Fox News viewer
Joe Rogan listener
Local NH news viewer
Newsmax viewer
NHPR listener
X (formerly Twitter) user
2020 Pres
Vote
Voted for Biden
Voted for Trump
Preferred
Candidate
Trump primary supporter
Not Trump primary supporter
8%
12%
0%
6%
3%
13%
4%
13%
1%
6%
0%
1%
11%
10%
5%
11%
0%
12%
0%
5%
1%
1%
6%
13%
5%
0%
7%
1%
1%
14%
1%
3%
16%
2%
5%
7%
1%
1%
1%
1%
12%
6%
8%
22%
4%
6%
1%
9%
13%
3%
18%
9%
3%
10%
1%
1%
4%
0%
2%
12%
10%
4%
4%
14%
4%
12%
7%
5%
3%
1%
0%
12%
3%
13%
14%
1%
2%
4%
5%
5%
3%
8%
14%
7%
5%
8%
14%
6%
2%
4%
5%
2%
1%
13%
6%
5%
2%
11%
4%
11%
6%
5%
3%
1%
1%
8%
12%
4%
8%
33%
12%
4%
5%
8%
1%
1%
2%
6%
9%
14%
17%
7%
16%
13%
3%
7%
3%
11%
5%
1%
4%
1%
4%
9%
1%
1%
2%
1%
0%
11%
2%
7%
15%
6%
6%
4%
3%
3%
10%
6%
13%
3%
16%
6%
2%
11%
9%
16%
4%
1%
1%
1%
4%
2%
0%
0%
1%
26%
1%
27%
8%
27%
8%
26%
9%
2%
5%
24%
1%
4%
6%
13%
12%
7%
8%
7%
24%
7%
12%
9%
21%
13%
0%
12%
7%
27%
5%
9%
8%
20%
10%
1%
6%
2%
17%
4%
2%
2%
5%
6%
1%
3%
3%
0%
4%
1%
2%
3%
0%
14%
5%
12%
12%
5%
1%
1%
7%
16%
1%
8%
0%
20%
2%
19%
1%
8%
2%
305
408
523
190
66
333
226
183
282
131
116
316
397
89
157
198
270
469
246
125
71
155
122
69
166
126
138
131
146
62
176
144
101
454
95
245
97
159
124
543
157
408
292
With which of the following 2024 presidential candidates have you done each of these things in the past year? (Please select all that apply) - Donald
Trump
Polical Acvies Engaged in with Donald Trump Over Past Year - Likely GOP Primary Voters

Strongly
support
Somewhat
support
Neutral/
Doesn't
matter to me
Somewhat
oppose
Strongly
oppose
Don't
know/Not
sure
STATEWIDE November 2023
65%
10%
19%
2%
1%
3%
N
949
Voting
Registration
Registered Republican
Registered Undeclared/Not Reg.
Party ID
Independent/Democrat
Republican
Political
Ideology
Moderate
Conservative
Libertarian
Age of
Respondent
18 to 34
35 to 49
50 to 64
65 and older
Gender of
Respondent
Men
Women
Level of
Education
High school or less
Tech school/Some college
College graduate
Postgraduate work
College
Degree
College graduate
Not college graduate
Region of
State
Central/Lakes
Connecticut Valley
Manchester Area
Mass Border
North Country
Seacoast
Household
Income
Less than $45,000
$45,000 - $74,999
$75,000 - $99,999
$100,000 - $149,999
$150,000 or more
Media Usage
CNN viewer
Conservative radio listener
Epoch Times reader
Fox News viewer
Joe Rogan listener
Local NH news viewer
Newsmax viewer
NHPR listener
X (formerly Twitter) user
2020 Pres
Vote
Voted for Biden
Voted for Trump
Preferred
Candidate
Trump primary supporter
Not Trump primary supporter
62%
68%
10%
10%
22%
16%
4%
1%
1%
0%
1%
5%
68%
57%
10%
11%
16%
26%
2%
3%
0%
2%
4%
1%
74%
72%
54%
3%
10%
15%
8%
18%
24%
0%
6%
0%
1%
15%
0%
1%
72%
58%
59%
80%
13%
13%
8%
10%
25%
20%
17%
1%
4%
2%
1%
0%
0%
2%
3%
0%
11%
1%
55%
73%
12%
8%
22%
16%
3%
1%
1%
0%
7%
0%
71%
70%
76%
53%
11%
10%
7%
12%
12%
17%
15%
25%
1%
2%
1%
3%
3%
1%
1%
0%
1%
7%
63%
70%
10%
10%
21%
15%
2%
2%
2%
4%
1%
61%
62%
62%
83%
67%
59%
22%
17%
6%
2%
5%
11%
14%
19%
26%
13%
11%
24%
2%
1%
6%
2%
0%
1%
0%
1%
0%
0%
1%
1%
0%
16%
4%
59%
68%
59%
70%
79%
9%
4%
16%
12%
6%
30%
23%
18%
13%
14%
1%
2%
7%
1%
1%
1%
3%
1%
0%
0%
4%
0%
84%
62%
70%
70%
58%
81%
91%
71%
59%
3%
11%
6%
9%
6%
7%
4%
4%
15%
12%
21%
13%
16%
22%
11%
5%
25%
23%
3%
3%
0%
1%
0%
3%
0%
1%
0%
0%
1%
0%
0%
11%
1%
13%
0%
1%
71%
42%
9%
14%
16%
30%
0%
9%
0%
3%
4%
1%
62%
70%
13%
6%
19%
18%
4%
1%
0%
1%
7%
409
537
705
239
139
435
259
251
357
182
153
430
516
124
195
272
355
627
319
158
91
218
150
134
191
180
160
182
174
84
225
200
174
568
160
319
126
223
161
733
186
534
397
New Hampshire state law requires the state's presidential primary to be held seven days or more prior to any similar election in another state.
Would you say you support or oppose New Hampshire's presidential primary being required to be held before any similar election in another state?
Support or Oppose NH Presidenal Primary Being Required to Go First - Likely GOP Primary Voters

Support
Neutral/Doesn't
matter to me
Oppose Don't know/Not sure
STATEWIDE November 2023
75%
19%
3%
3%
N
949
Voting
Registration
Registered Republican
Registered Undeclared/Not Reg.
Party ID
Independent/Democrat
Republican
Political
Ideology
Moderate
Conservative
Libertarian
Age of
Respondent
18 to 34
35 to 49
50 to 64
65 and older
Gender of
Respondent
Men
Women
Level of
Education
High school or less
Tech school/Some college
College graduate
Postgraduate work
College
Degree
College graduate
Not college graduate
Region of
State
Central/Lakes
Connecticut Valley
Manchester Area
Mass Border
North Country
Seacoast
Household
Income
Less than $45,000
$45,000 - $74,999
$75,000 - $99,999
$100,000 - $149,999
$150,000 or more
Media Usage
CNN viewer
Conservative radio listener
Epoch Times reader
Fox News viewer
Joe Rogan listener
Local NH news viewer
Newsmax viewer
NHPR listener
X (formerly Twitter) user
2020 Pres
Vote
Voted for Biden
Voted for Trump
Preferred
Candidate
Trump primary supporter
Not Trump primary supporter
72%
78%
22%
16%
5%
1%
1%
5%
78%
68%
16%
26%
2%
6%
4%
1%
77%
81%
69%
8%
18%
24%
0%
6%
15%
0%
1%
86%
71%
67%
80%
10%
25%
20%
17%
2%
4%
2%
2%
3%
0%
11%
1%
68%
82%
22%
16%
4%
2%
7%
0%
82%
80%
83%
65%
12%
17%
15%
25%
5%
3%
1%
3%
1%
0%
1%
7%
73%
81%
21%
15%
2%
4%
4%
1%
83%
79%
67%
85%
72%
71%
14%
19%
26%
13%
11%
24%
3%
1%
6%
2%
0%
2%
1%
0%
16%
4%
68%
72%
74%
82%
86%
30%
23%
18%
13%
14%
2%
4%
7%
1%
1%
0%
0%
4%
0%
87%
73%
76%
80%
64%
88%
95%
75%
75%
12%
21%
13%
16%
22%
11%
5%
25%
23%
0%
6%
0%
4%
0%
0%
0%
1%
0%
0%
11%
1%
13%
0%
1%
81%
56%
16%
30%
0%
13%
4%
1%
76%
75%
19%
18%
5%
0%
1%
7%
409
537
705
239
139
435
259
251
357
182
153
430
516
124
195
272
355
627
319
158
91
218
150
134
191
180
160
182
174
84
225
200
174
568
160
319
126
223
161
733
186
534
397
New Hampshire state law requires the state's presidential primary to be held seven days or more prior to any similar election in another state.
Would you say you support or oppose New Hampshire's presidential primary being required to be held before any similar election in another state?
Support or Oppose NH Presidenal Primary Being Required to Go First - Likely GOP Primary Voters

Very
favorable
Somewhat
favorable
Neutral
Somewhat
unfavorable
Very
unfavorable
Don't
know/Not
sure
STATEWIDE November 2023
16%
34%
9%
22%
18%
1%
N
952
Voting
Registration
Registered Republican
Registered Undeclared/Not Reg.
Party ID
Independent/Democrat
Republican
Political
Ideology
Moderate
Conservative
Libertarian
Age of
Respondent
18 to 34
35 to 49
50 to 64
65 and older
Gender of
Respondent
Men
Women
Level of
Education
High school or less
Tech school/Some college
College graduate
Postgraduate work
College
Degree
College graduate
Not college graduate
Region of
State
Central/Lakes
Connecticut Valley
Manchester Area
Mass Border
North Country
Seacoast
Household
Income
Less than $45,000
$45,000 - $74,999
$75,000 - $99,999
$100,000 - $149,999
$150,000 or more
Media Usage
CNN viewer
Conservative radio listener
Epoch Times reader
Fox News viewer
Joe Rogan listener
Local NH news viewer
Newsmax viewer
NHPR listener
X (formerly Twitter) user
2020 Pres
Vote
Voted for Biden
Voted for Trump
Preferred
Candidate
Trump primary supporter
Not Trump primary supporter
9%
21%
25%
41%
5%
12%
24%
20%
36%
4%
0%
1%
21%
0%
44%
5%
11%
4%
21%
26%
2%
66%
1%
7%
26%
8%
28%
51%
23%
9%
9%
12%
52%
13%
24%
5%
1%
33%
0%
14%
18%
11%
20%
38%
38%
36%
15%
13%
9%
9%
5%
17%
18%
32%
27%
14%
17%
13%
33%
3%
17%
15%
26%
40%
11%
8%
26%
18%
18%
18%
2%
0%
8%
9%
17%
22%
27%
27%
37%
39%
8%
12%
6%
11%
29%
24%
27%
14%
29%
28%
12%
13%
0%
2%
20%
8%
38%
27%
9%
10%
20%
26%
13%
28%
1%
18%
16%
19%
34%
4%
5%
36%
44%
27%
26%
28%
48%
13%
18%
10%
5%
1%
10%
16%
10%
25%
14%
42%
20%
17%
12%
18%
21%
26%
13%
4%
18%
19%
8%
14%
22%
28%
30%
43%
40%
23%
9%
9%
10%
9%
14%
28%
16%
23%
17%
12%
17%
25%
15%
16%
29%
4%
1%
20%
6%
6%
18%
3%
25%
20%
9%
3%
32%
29%
47%
34%
32%
48%
30%
58%
22%
8%
7%
9%
11%
4%
8%
13%
8%
8%
18%
20%
34%
17%
44%
16%
16%
20%
29%
23%
38%
5%
18%
17%
3%
20%
5%
38%
0%
1%
0%
0%
0%
21%
0%
42%
2%
11%
5%
20%
29%
6%
64%
1%
12%
22%
25%
45%
10%
8%
24%
20%
29%
4%
2%
410
539
706
241
139
436
260
251
359
182
153
431
517
124
197
273
355
628
321
160
91
219
151
134
191
180
160
184
174
85
225
202
174
571
161
320
126
223
162
734
187
535
398
Would you say you have a favorable or unfavorable opinion of the Republican Party?
Favorability - Republican Party - Likely GOP Primary Voters

Very or somewhat
favorable
Neutral
Very or somewhat
unfavorable
Don't know/Not sure
STATEWIDE November 2023
50%
9%
40%
1%
N
952
Voting
Registration
Registered Republican
Registered Undeclared/Not Reg.
Party ID
Independent/Democrat
Republican
Political
Ideology
Moderate
Conservative
Libertarian
Age of
Respondent
18 to 34
35 to 49
50 to 64
65 and older
Gender of
Respondent
Men
Women
Level of
Education
High school or less
Tech school/Some college
College graduate
Postgraduate work
College
Degree
College graduate
Not college graduate
Region of
State
Central/Lakes
Connecticut Valley
Manchester Area
Mass Border
North Country
Seacoast
Household
Income
Less than $45,000
$45,000 - $74,999
$75,000 - $99,999
$100,000 - $149,999
$150,000 or more
Media Usage
CNN viewer
Conservative radio listener
Epoch Times reader
Fox News viewer
Joe Rogan listener
Local NH news viewer
Newsmax viewer
NHPR listener
X (formerly Twitter) user
2020 Pres
Vote
Voted for Biden
Voted for Trump
Preferred
Candidate
Trump primary supporter
Not Trump primary supporter
34%
62%
5%
12%
60%
24%
0%
1%
65%
5%
11%
4%
22%
91%
1%
35%
76%
31%
9%
9%
12%
57%
14%
56%
0%
52%
56%
47%
34%
13%
9%
9%
5%
32%
35%
45%
61%
3%
43%
56%
11%
8%
44%
36%
2%
0%
35%
36%
54%
60%
8%
12%
6%
11%
58%
53%
40%
27%
0%
2%
58%
35%
9%
10%
32%
55%
1%
54%
60%
47%
60%
31%
53%
13%
18%
10%
5%
1%
10%
33%
22%
43%
35%
67%
33%
4%
46%
50%
52%
54%
45%
9%
9%
10%
9%
14%
45%
41%
38%
33%
40%
4%
1%
51%
34%
52%
52%
35%
73%
50%
67%
26%
8%
7%
9%
11%
4%
8%
13%
8%
8%
41%
59%
38%
36%
60%
19%
37%
25%
67%
0%
1%
0%
0%
0%
62%
3%
11%
5%
26%
93%
1%
37%
67%
10%
8%
52%
23%
2%
410
539
706
241
139
436
260
251
359
182
153
431
517
124
197
273
355
628
321
160
91
219
151
134
191
180
160
184
174
85
225
202
174
571
161
320
126
223
162
734
187
535
398
Would you say you have a favorable or unfavorable opinion of the Republican Party?
Favorability - Republican Party - Likely GOP Primary Voters
