Barometer of mobile
Internet connections in
Ireland.
01/01/2023 - 31/12/2023
February 28, 2024
Agenda
Mobile Internet - Jan/Dec 2023 - Ireland
Introducing
nPerf
Executive
summary
Methodology
nPerf Network
assesment
1. Introducing nPerf
3
Mobile Internet - Jan/Dec 2023 - Ireland
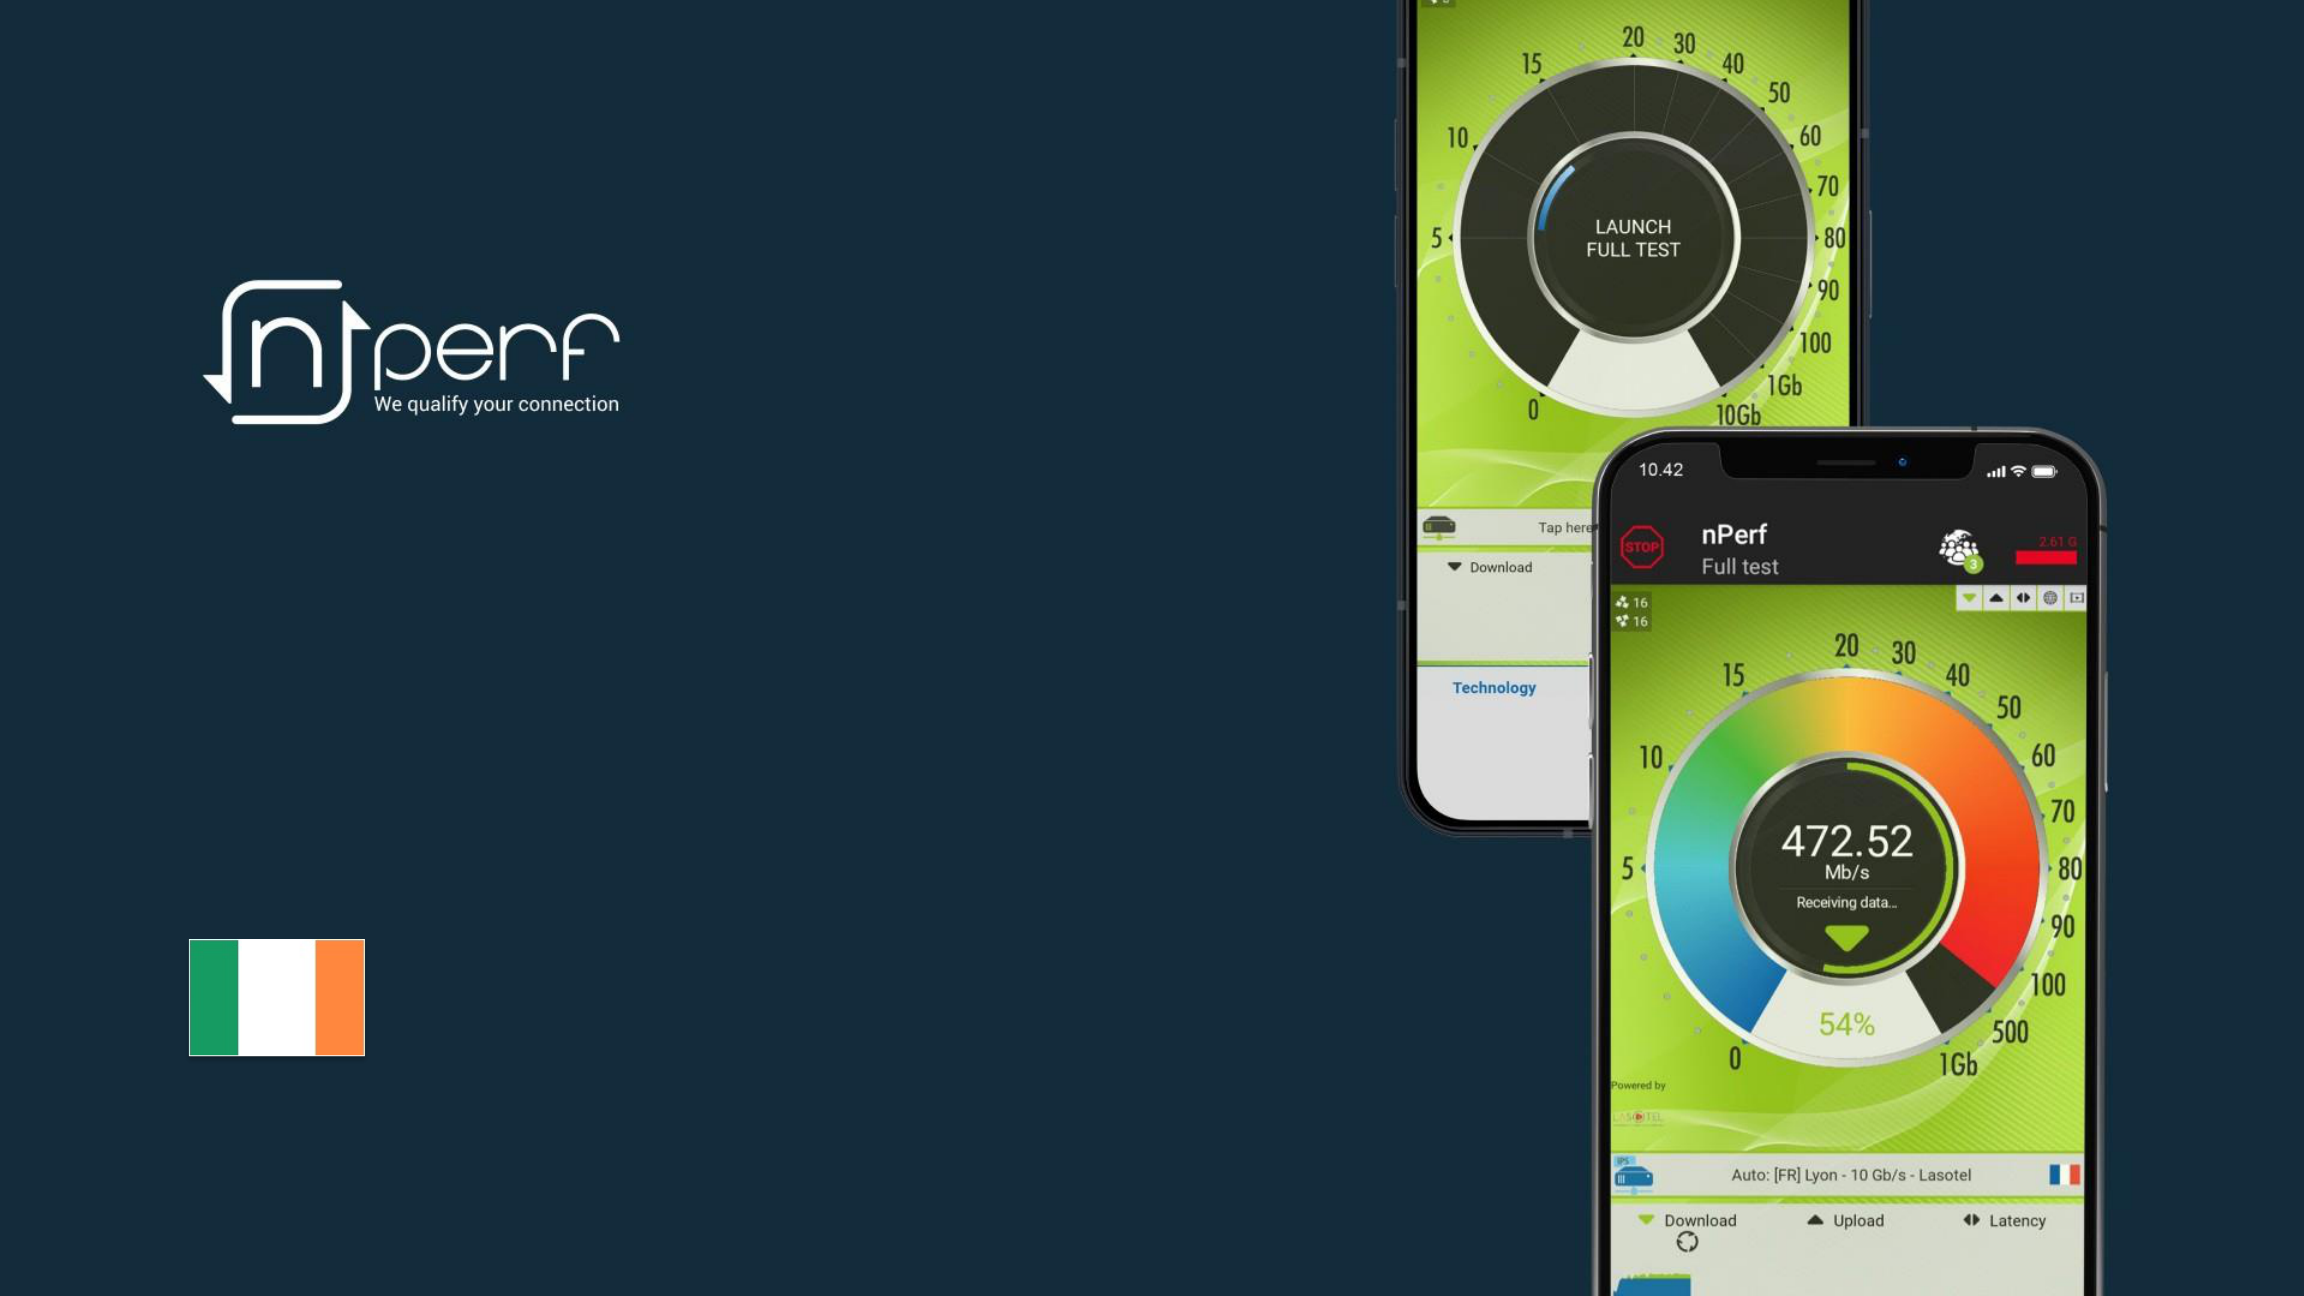
Expert in the telecom network optimization
nPerf is an independent French company based in Lyon (France). For over a decade, nPerf has been a trusted partner for both fixed and mobile
operators, providing comprehensive network testing solutions and analysis. Our mission is to accurately measure, evaluate, and enhance the
understanding of Internet connectivity around the world.
Test your Internet connection with nPerf!
nPerf allows you to test the quality of your fixed, mobile, or Wi-Fi Internet connections up to 10
Gb/s! Dowload our app or visit our website!
Test your connection
on nPerf.com
300k+ tests daily
worldwide.
26Md+ coverage
scans in total.
3k+ servers all
around the world.
Source : nperf.com
Best mobile Internet performance
in 2023
Cellular Internet connections in Ireland
Source : nperf.com
4
Mobile Internet - Jan/Dec 2023 - Ireland
Source : nperf.com
Vodafone
Three Eir
nPerf
Score (nPoints)
111 946 98 632 88 591
Download
bitrates (Mb/s)
100.40 105.55 56.23
Upload
bitrates (Mb/s)
41.05 18.88 12.45
Latency
(ms)
26.77 30.13 28.67
Web
browsing (%)
83.81 76.91 77.14
Youtube
streaming (%)
88.10 83.95 83.33
The subscribers of Vodafone enjoyed the best mobile Internet performances in Ireland during 2023.
2. Executive Summary
Source : nperf.com
5
5G Executive Summary
The subscribers of Vodafone enjoyed the best 5G mobile connections in Ireland during 2023.
Vodafone Three Eir
nPerf Score (nPoints)
134
715
122 119
101 474
Download bitrates (Mb/s)
205.13 228.70 92.50
Upload bitrates (Mb/s)
78.46 34.56 15.87
Latency (ms)
21.19 24.84 27.25
Web browsing (%)
87.21 84.10 82.15
Youtube streaming (%)
91.21 86.36 85.38
5G mobile connections in Ireland
Mobile Internet - Jan/Dec 2023 - Ireland
3. Methodology
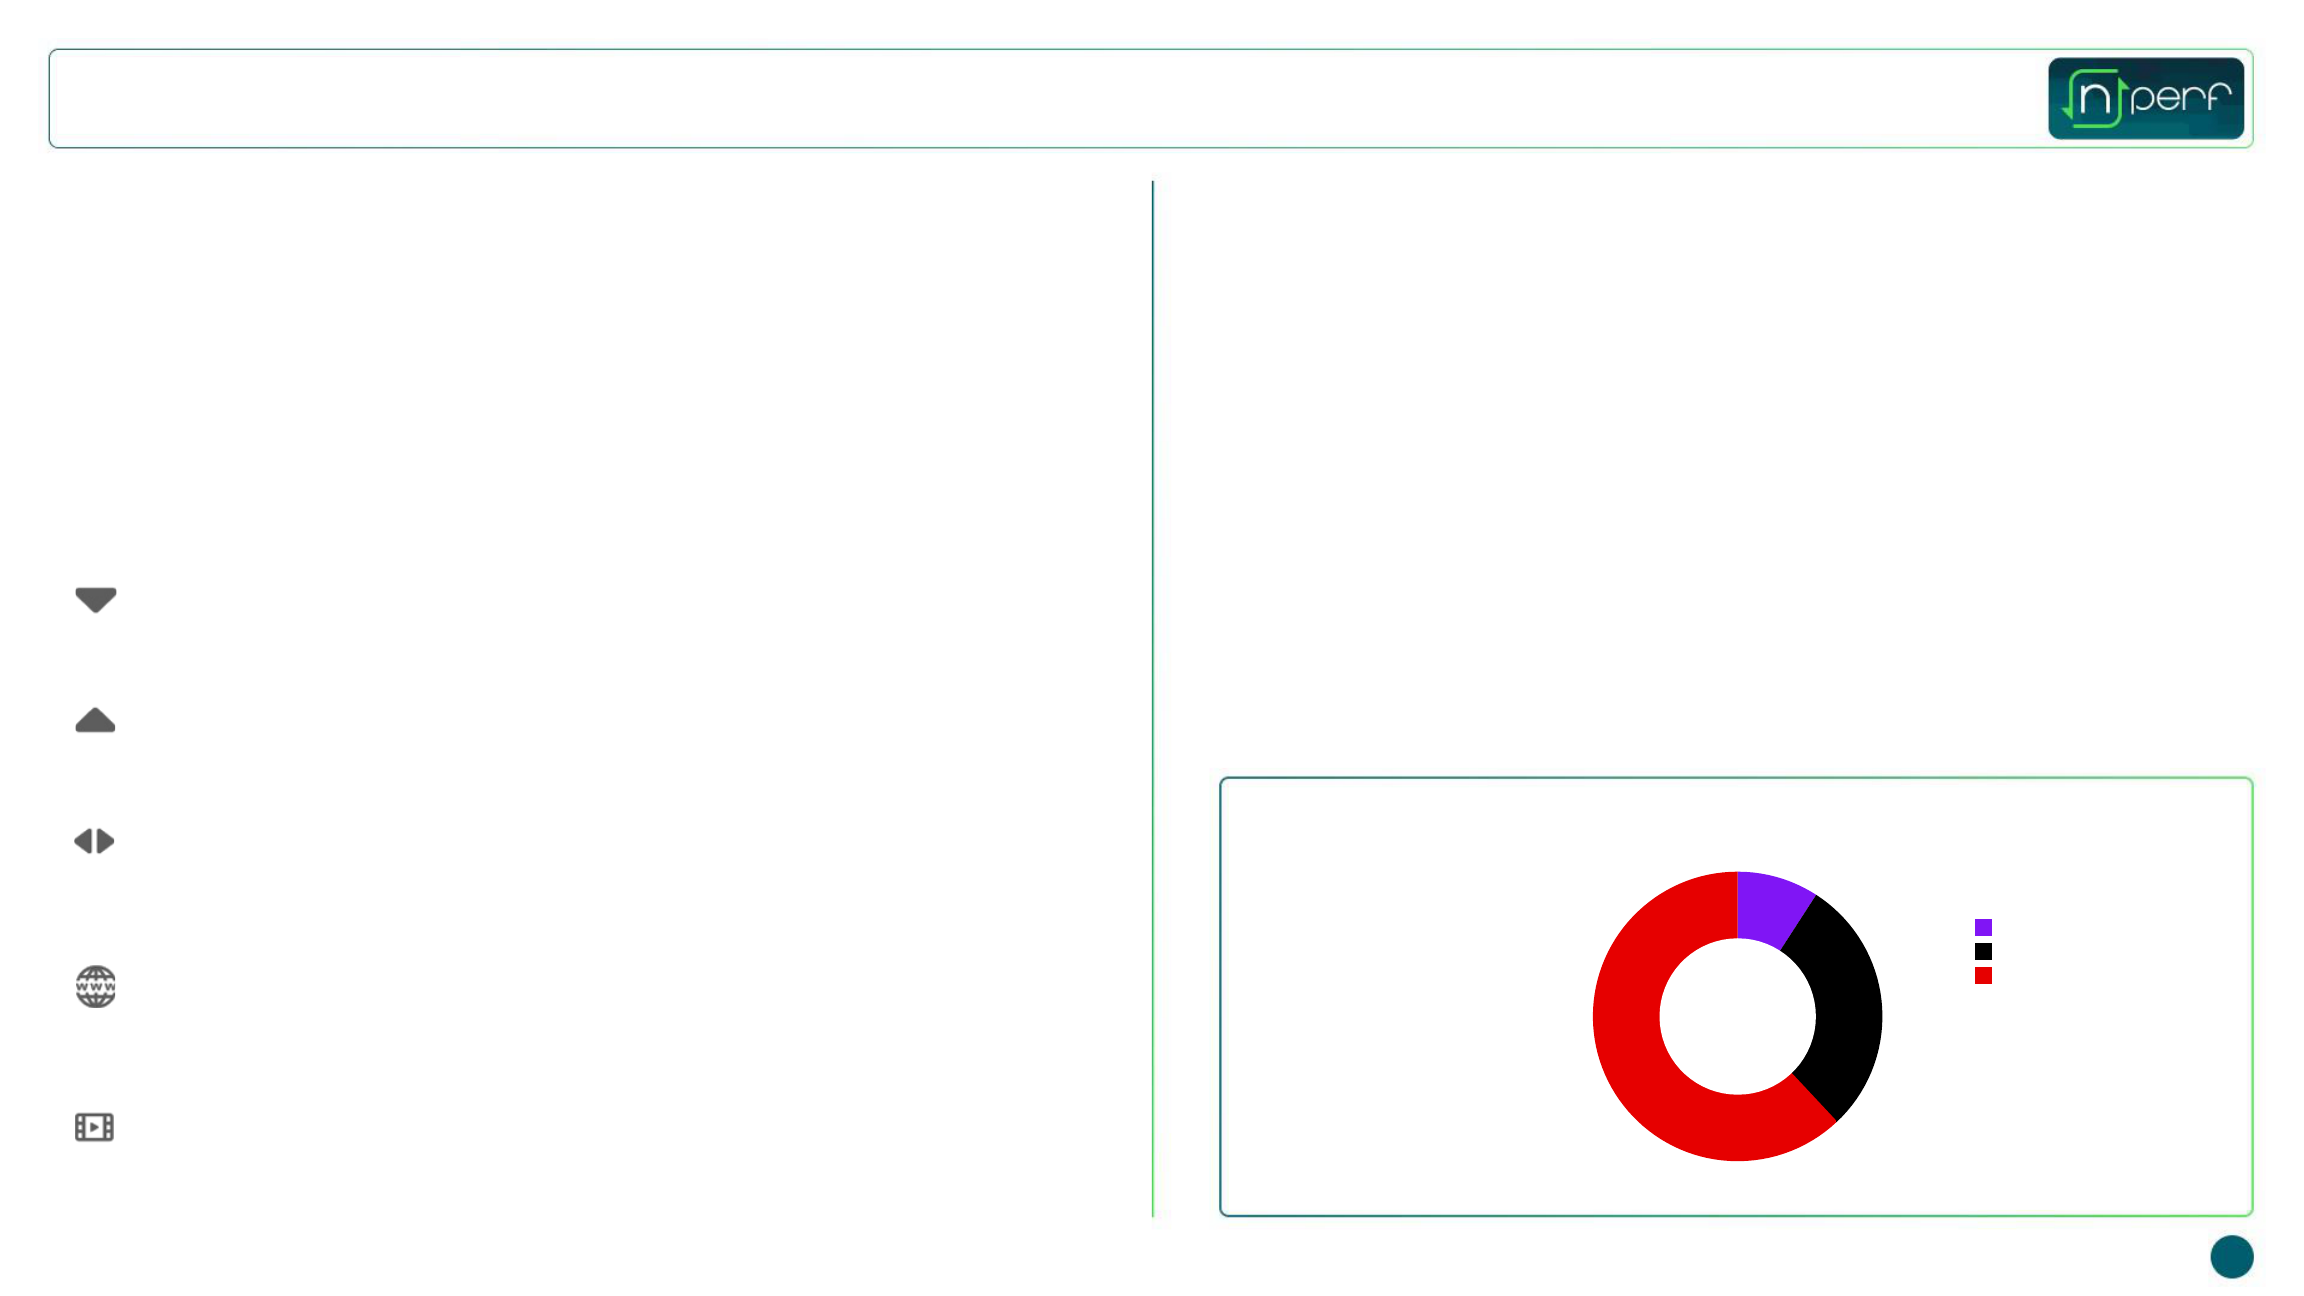
28.92%
61.95%
Eir
Three
Vodafone
Overall distribution of the tests per provider (ISPs Share)
9.12%
Source : nperf.com
Statistical precision is crucial in accurately determining winners. At
nPerf, we prioritize test quality, precise reporting, and transparency.
Analyzing a large volume of tests in this study, we've achieved 3 %
precision for absolute values and 1 point for percentage-based
results, highlighting the reliability and accuracy of our data.
For a more comprehensive understanding of the user experience,
our report features test results during both Busy hours (6 PM to 11
PM) and Idle hours (the rest of the day). Busy hours, marked by
network strain, can impact user experience through congestion.
This approach helps in understanding how network performance
fluctuates throughout the day.
We only include national Internet service providers with test share
above 5% share. The chart below shows the overall test distribution
for each service provider.
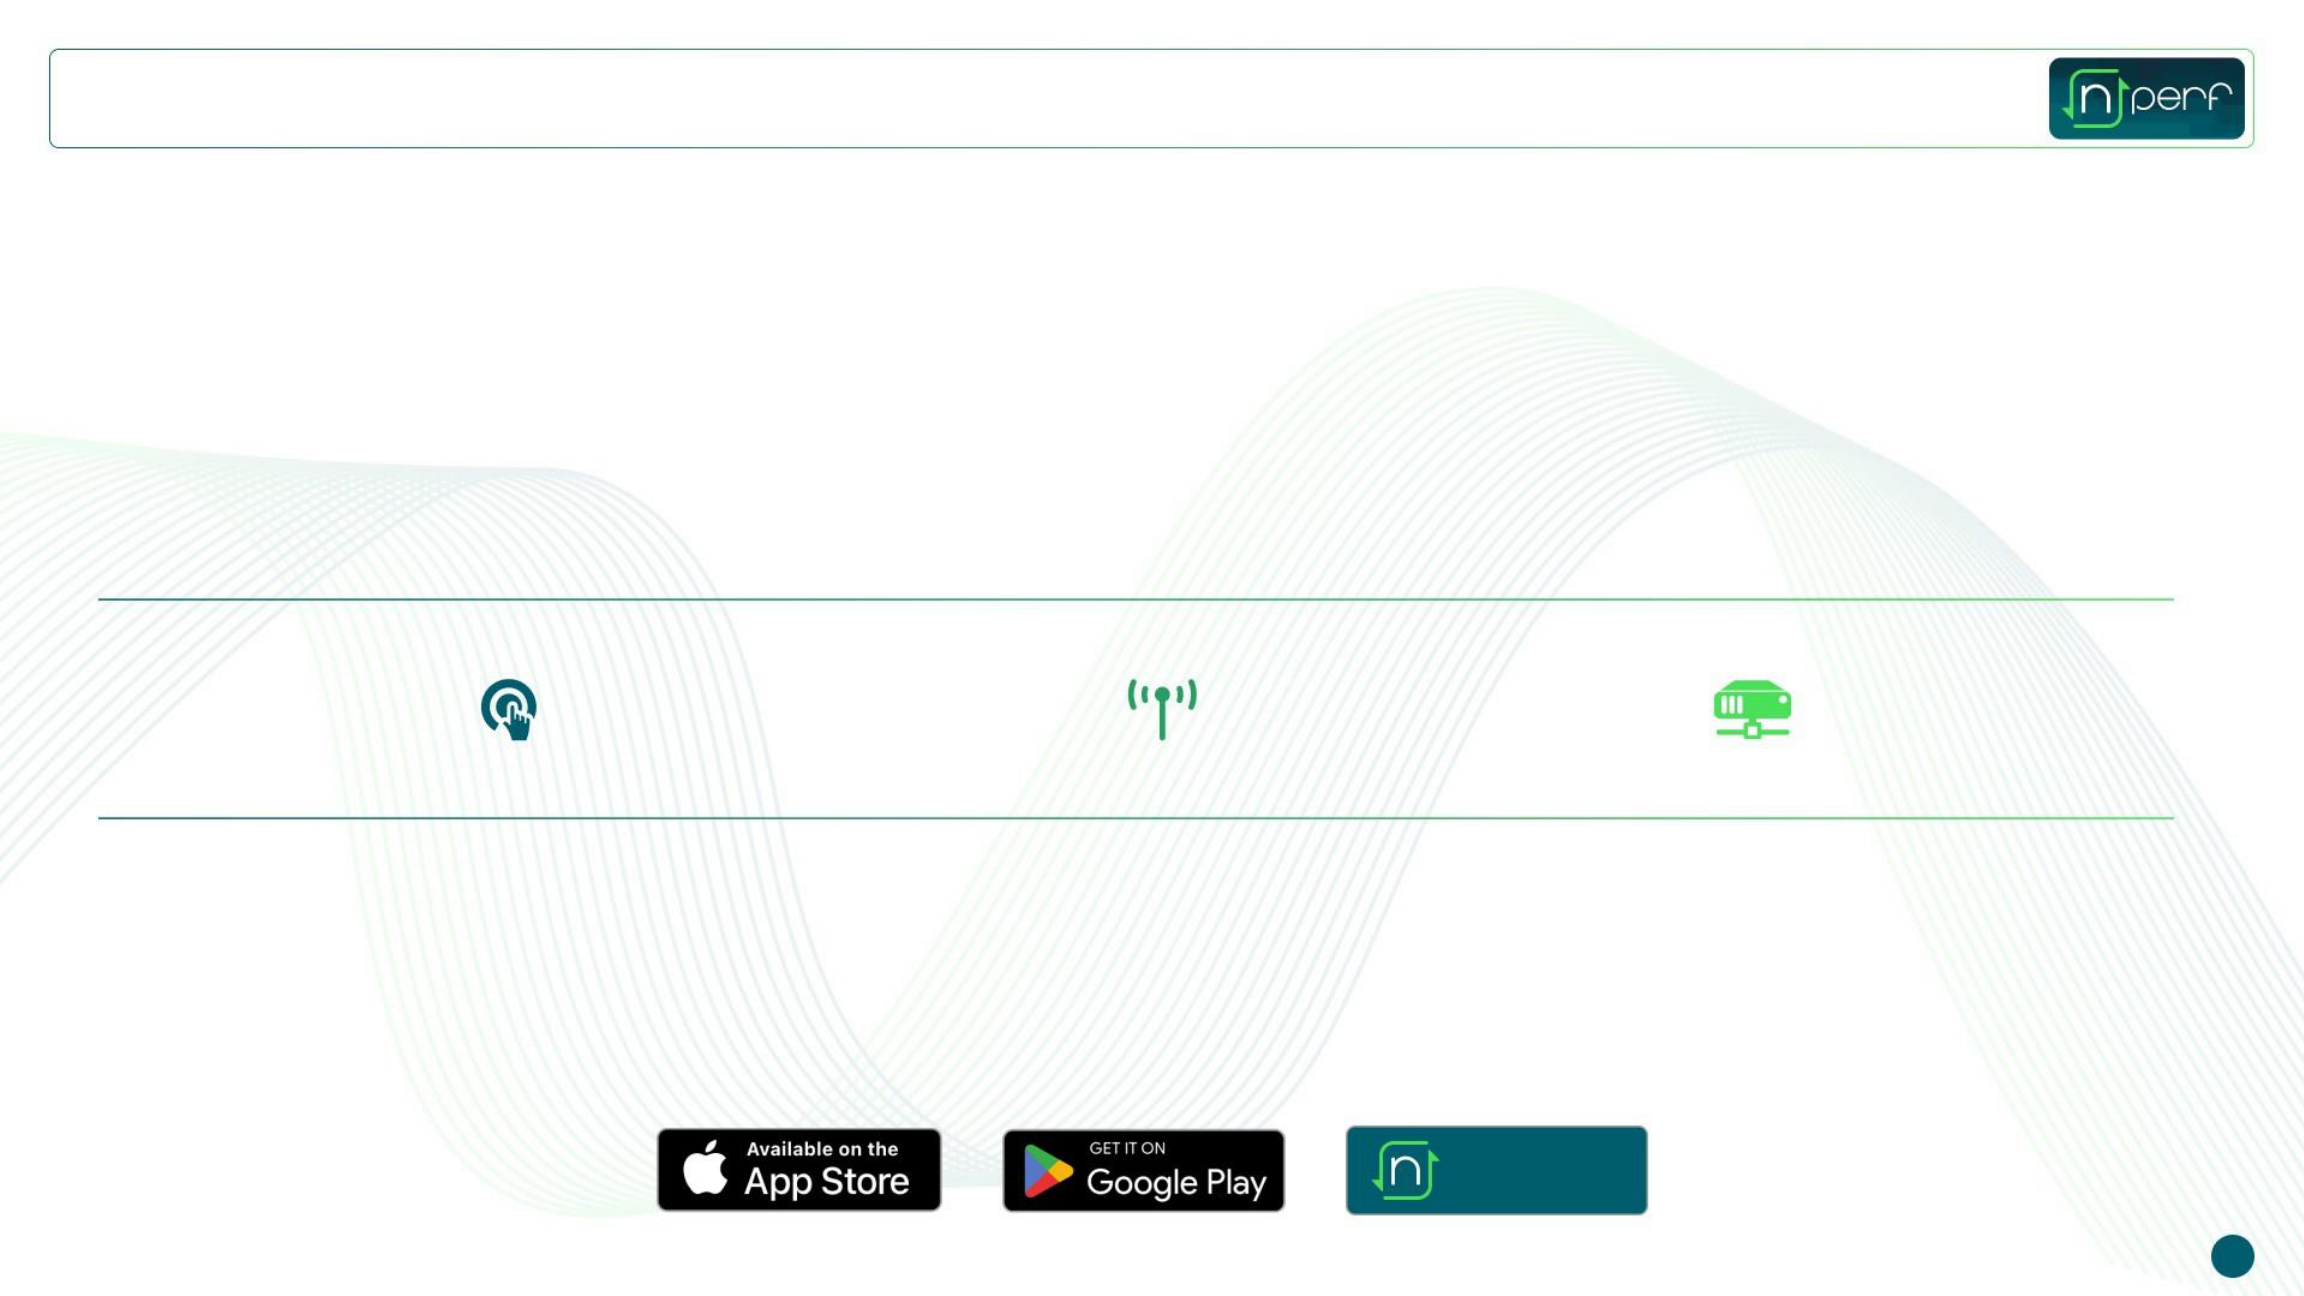
nPerf provides a free tool to assess Internet connection quality via its
website and mobile apps (Android, iOS). Daily, thousands of people rely on
nPerf for speed tests in their country, contributing to a comprehensive
crowdsourced database covering all operators.
The study employs a strong filtering method to reflect real customer
experiences on a specific network (mobile or fixed line). Measures are
taken to prevent probes and measurement robots from affecting the
results. After filtering, this study is based on 20 783 tests!
For mobile connections, we assess:
Download bitrate :
Indicates the amount of data your connection can receive in one second from the nPerf
server. The highest the measured value, the best is the bitrate of your connection.
Upload bitrate :
Indicates the amount of data your connection can send in one second from the nPerf
server. The highest the measured value, the best is the bitrate of your connection.
Latency (ping) :
It indicated the delay a small packet of data requires to make a round-trip from your
computer to the nPerf server. The shorter the delay, the most reactive your connection is.
The main is the minimum value.
Browsing performance :
The browsing test assesses the load time of the fully loaded pages, including images,
JavaScript, CSS, and fonts, for the five most popular sites. This indicator reflects the user's
perceived quality of the Internet network.
Streaming performance :
The video streaming test gauges the load time of a fully loaded video in three resolutions
on YouTube, considering stalls during playback. This indicator reflects the user's perceived
quality of the Internet network.
6
Mobile Internet - Jan/Dec 2023 - Ireland
Mobile Internet performance in Ireland
The nperf score takes into account the measured bitrates, the latency and the
Qoe tests. The value of the points for the rates and the latency is calculated on
a logarithmic scale, to better represent the perception of the user.
Thus, this score reflects the overall quality of the connection experienced by
the user.
nPerf Score (nPoints)
Source : nperf.com
Vodafone
Three
Eir
111 946
98 632
88 591
Best mobile Internet performance
in 2023
Source : nperf.com
7
The subscribers of Vodafone enjoyed the best mobile Internet performances in Ireland
during 2023.
Mobile Internet - Jan/Dec 2023 - Ireland
Internet service performance
5G nPerf score (average)
Source : nperf.com
Source : nperf.com
Vodafone
Three
Eir
1
34 715
122 119
101 474
8
Mobile Internet - Jan/Dec 2023 - Ireland
· Best 5G Mobile Performance : Vodafone (134 715 nPoints)
· Best 5G Mobile Download speed : Three (228.70 Mb/s)
· Best 5G Mobile Upload speed : Vodafone (78.46 Mb/s)
· Best 5G Mobile Latency speed : Vodafone (21.19 ms)
· Best 5G Mobile Browsing experience : Vodafone (87.21 %)
· Best 5G Mobile Video experience : Vodafone (91.21 %)
5G
The subscribers of Vodafone enjoyed the best 5G mobile connections in Ireland during
2023.
Speed : Download
Download Speed (average)
Source : nperf.com
Source : nperf.com
Download Speed results ventilation (average)
Vodafone
Three
Eir
100.40 Mb/s
105.55 Mb/s
56.23 Mb/s
9
Mobile Internet - Jan/Dec 2023 - Ireland
The subscribers of Three enjoyed the best average mobile Internet download speed
in 2023.
16%
28%
39%
17%
14%
16%
67%
57%
45%
Eir
Three
Vodafone
Correct (10-25)
Excellent (25+)
Slow (0-10)
Speed : Upload
Upload Speed (average)
Source : nperf.com Source : nperf.com
Upload Speed results ventilation (average)
Vodafone
Three
Eir
41.05 Mb/s
18.88 Mb/s
12.45 Mb/s
10
Mobile Internet - Jan/Dec 2023 - Ireland
The subscribers of Vodafone enjoyed the best average mobile Internet
upload speed in 2023.
16%
38%
36%
7%
19%
19%
77%
43%
46%
Correct (5-10)
Excellent (0-5)
Slow (10+)
Eir
Three
Vodafone
Latency Speed (average)
Source : nperf.com Source : nperf.com
Latency Speed results ventilation (average)
Vodafone
Three
Eir
26.77 ms
30.13 ms
28.67 ms
11
Mobile Internet - Jan/Dec 2023 - Ireland
The subscribers of Vodafone enjoyed the best average mobile Internet latency
speed in 2023.
Correct (10-100s)
Excellent (0-30s)
Slow (100s+)
4%
7%
7%
15%
31%
25%
81%
62%
68%
Eir
Three
Vodafone
Speed : Latency
Quality of Experience : Browsing
Browsing Performance rate (average)
Source : nperf.com
Source : nperf.com
Vodafone
Three
Eir
83.81%
76.91%
77.14%
12
Mobile Internet - Jan/Dec 2023 - Ireland
Browsing Performance results ventilation (average)
The subscribers of Vodafone enjoyed the best mobile Internet browsing performance
in 2023.
Correct (2-5s)
Excellent (0-2s)
Slow (5-10s)
3%
6%
5%
3%
8%
8%
94%
86%
87%
Eir
Three
Vodafone
Quality of Experience : Streaming
Streaming Performance rate (average)
Source : nperf.com
Source : nperf.com
Streaming Performance results ventilation (average)
Vodafone
Three
Eir
88.10%
83.95%
83.33%
13
Mobile Internet - Jan/Dec 2023 - Ireland
The subscribers of Vodafone enjoyed the best mobile Internet streaming performance
in 2023.
Correct (2-5s)Excellent (0-2s)
Slow (5-10s)
7%
6%
1% 4%
2%
2%
96%
91%
91%
Eir
Three
Vodafone