
1
Paid Leave and Employment Stability of First-Time
Mothers
Issue Brief—Worker Leave Analysis and Simulation Series
1
January 2017
In this Issue Brief, we use data from the
2008 Survey of Income and Program
Participation’s (SIPP) Fertility History
Module to examine the association
between paid leave use and the
employment stability of first-time
mothers.
We find that first-time mothers who
utilized paid leave are significantly less
likely to quit their jobs before or after
the birth, and are significantly more
likely to work for the same employer
upon returning to work.
For more findings in the Worker Leave
Analysis and Simulation Issue Brief
Series, please visit
https://www.dol.gov/asp/evaluation/W
Welcoming a new child commonly requires working parents to face challenging
decisions related to balancing their career obligations with the extensive caregiving
responsibilities of a new child. Within this Issue Brief, we explore the association
between paid leave use and the employment stability of a specific group of parents,
first-time mothers, using data from the U.S. Census Bureau’s 2008 Survey of Income
and Program Participation’s (SIPP) Fertility History Module. Our analysis finds that
expecting mothers who utilize paid leave during and after their pregnancy have a
greater ability to balance their career and caregiving responsibilities, and are
subsequently more likely to experience employment stability. In contrast, mothers
who do not utilize paid leave face a greater likelihood of separating from their jobs in
order to care for a newborn child.
Our analysis, employing a propensity-score matching technique, finds that mothers
who utilized paid leave were significantly less likely to quit their jobs before or after
the birth, and were significantly more likely to work for the same employer upon
returning to work. Controlling for observed differences, first-time mothers who
utilized paid leave had only a 2.6% probability of quitting their jobs and a 92.3%
probability of returning to the same employer post-birth of their children. In
contrast, first-time mothers who did not utilize paid leave experienced a 34.3%
probability of quitting their job and had a 73.3% probability of working for the
same employer after birth.
orkerLeaveStudy/
PAID LEAVE USE AMONG FIRST-TIME MOTHERS
An analysis of the SIPP data demonstrates notable differences in the types of paid leave utilized by working mothers who gave birth
to their first child between 2000 and 2008. A small majority of first-time mothers (52%) utilized paid leave before and after the birth
of their first child. First-time mothers most commonly utilized paid maternity leave (38% of all first-time mothers), followed by paid
vacation (8.4%), paid sick leave (7.9%), paid disability leave (7.0%), or another type of paid leave (1.1%).
Among fir
st-time mothers who utilized paid leave, the majority took a single type of paid leave while a small percentage utilized
multiple types of paid leave during their pregnancy (see Figure 1 on the following page).
1
This project was funded, either wholly or in part, with Federal funds from the U.S. Department of Labor’s Chief Evaluation Office under Contract # DOL-OPS-14-
U-00040. The contents of this publication do not represent the views or policies of the Department.
2
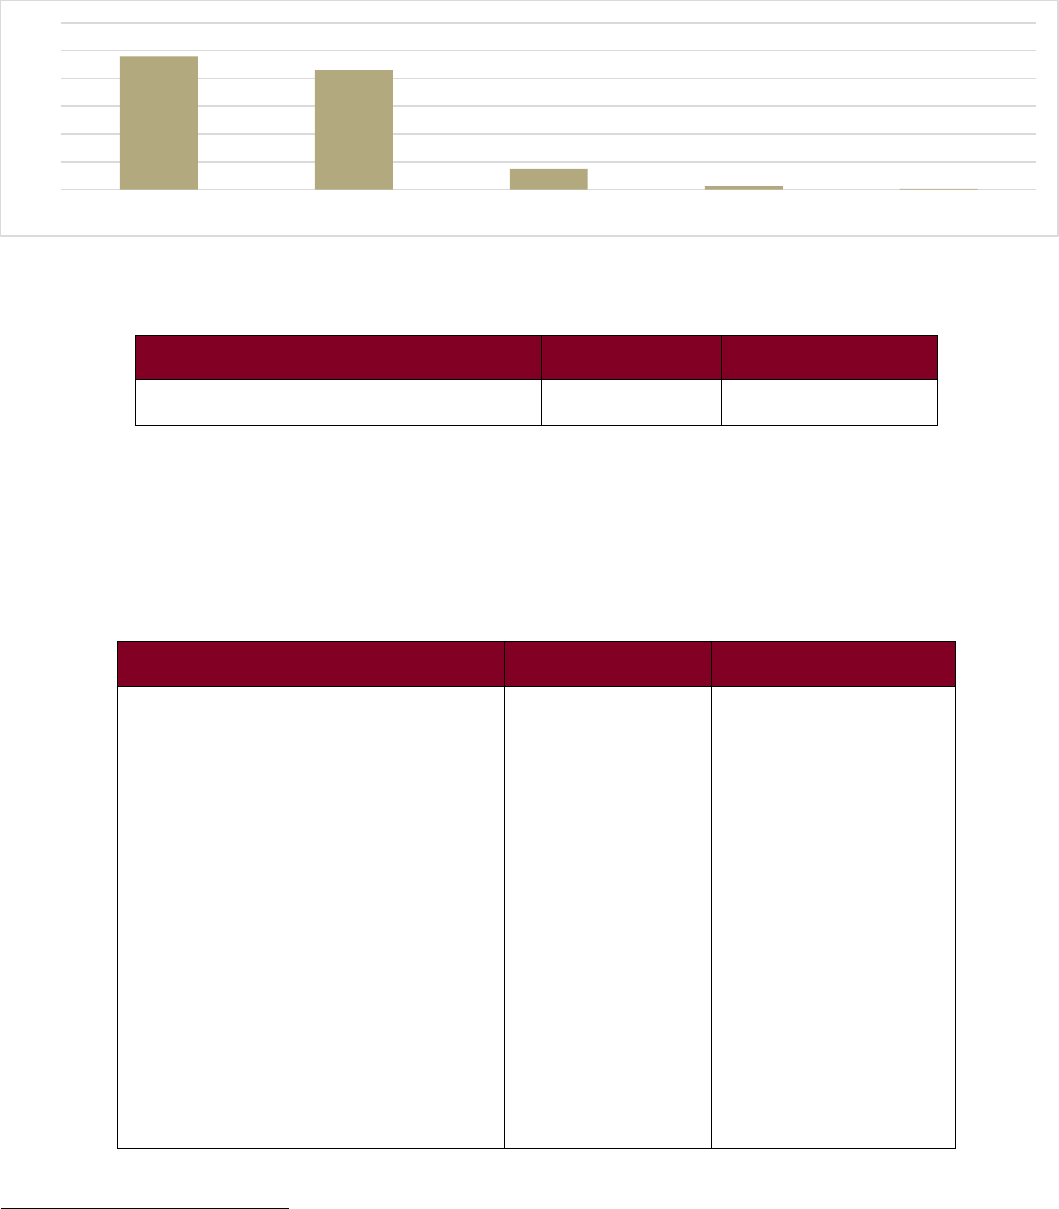
Figure 1. Number of Types of Paid Leave Used by First-Time Mothers (by %)
In addition, first-time mothers who utilized paid leave
2
were significantly more likely to experience employment stability
3
than
mothers who did not utilize paid leave, as detailed in Table 1.
Table 1. Paid Leave Use and Employment Outcomes of First-Time Mothers
Statistical significance at the following levels: *p<0.10; **p<0.05; ***p<0.01
However, these differences can be attributed, in part, to systematic differences in a wide variety of characteristics of first-time
mothers who utilized paid leave and who didn’t. As shown in Table 2, mothers who utilized paid leave during their first
pregnancy are more likely to be older, less likely to be a racial or ethnic minority, and more likely to be married at birth,
have a higher education, and work full-time before the birth. By controlling for these differences, our analysis provides a
more accurate description of the association between paid leave utilization and employment stability of first-time mothers.
Table 2. Differences between First-Time Mothers Who Used Paid Leave and Who Did Not
Utilized Paid Leave During
Pregnancy
Did Not Utilize Paid Leave
During Pregnancy
Mother Quit Job Before or After Birth***
Mother Worked for Same Employer After
Birth***
Age at Birth***
3.7%
90.5%
28.9
31.1%
65.4%
25.9
Ethnicity
Hispanic Ethnicity
Non-Hispanic Ethnicity
9.5%
90.5%
10.5%
89.5%
Race***
Racial Minority
17.0%
21.3%
Caucasian/White
83.0%
78.7%
Marital Status***
Married at Birth
Unmarried at Birth
76.1%
23.9%
42.3%
57.7%
Highest Education***
High School or Less
Some College
Vocational/Associates Degree
College Graduate
Graduate Degree
15.0%
14.1%
19.0%
33.4%
18.5%
28.4%
17.0%
23.3%
20.1%
11.2%
Worked Full-Time before the Birth***
95.7%
79.7%
Number of Observations
1,415
1,303
Statistical significance at the following levels: *p<0.10; **p<0.05; ***p<0.01
2
Paid leave within this issue brief is defined as utilizing one or more or the following types of leave before or after the birth: Paid Maternity Leave, Paid Vacation,
Paid Sick Leave, Disability Leave, and Other Paid Leave.
3
The employment stability outcomes of ‘quit job’ and ‘returned to work at the same employer’ were asked via separate questions within the SIPP survey’s Fertility
History Module. Accordingly, the percentages reported in table 2 for quitting and returning to work are independent of one another. Mothers who did not return to
work at the same employer may not have returned due to reasons other than quitting, such as being let go from their job, an employer going out of business, or some
other circumstance.
47.9%
43.0%
7.5%
1.3%
0.3%
0%
10%
20%
30%
40%
50%
60%
0 1 2 3 4
Utilized Paid Leave
During Pregnancy
Did Not Utilize Paid Leave
During Pregnancy
Quit Job Before or After the Birth***
3.7%
31.1%
Returned to Work at Same Employer After Birth***
90.5%
65.4%

3
METHODOLOGY
To examine the effects of paid leave use on the employment stability for first-time mothers, we adopted propensity score matching to
control for the observable differences between first-time mothers who utilized or did not utilize paid leave. To implement the
propensity score matching process, we estimated the conditional probabilities of whether a first-time mother utilized paid leave with
the collection of 40 variables identified in Appendix A to match members of the treatment group (first-time mothers who utilized
paid leave) to members of the comparison group (first-time mothers who did not utilize paid leave). A detailed discussion of the
methodological approach can be found in Appendix B.
FINDINGS
Mothers who utilized paid leave were significantly less likely to quit their job before or after the birth (p<0.01). The findings for the
matched comparison group demonstrates a consistent, significant effect between the use of paid leave and a decreased likelihood of
quitting among first-time mothers. Among first-time mothers who did and did not utilize paid leave, the predicted probabilities
4
of
quitting a job before or after birth are as follows:
Mothers who did not utilize paid leave had a 34.3% probability of quitting their job before or after the birth (p<0.01).
In contrast, mothers who utilized paid leave had a 2.6% probability of quitting their job before or after the birth (p<0.01).
The marginal effect of quitting among mothers utilizing paid leave was -26.3% (p<0.01), with a 95% confidence interval of
-25.3% to -27.3%.
First-time mothers who utilized paid leave were also more likely to work for the same employer after birth (p<0.01). Once again, the
findings for the matched comparison group demonstrates a consistent, significant effect between the use of paid leave and an
increased likelihood of working for the same employer post-birth among first-time mothers. Among first-time mothers who did and
did not utilize paid leave, the predicted probabilities of returning to work at the same employer after birth are as follows:
Mothers who did not utilize paid leave had a 73.3% probability of working for the same employer after the birth (p<0.01).
In contrast, mothers who utilized paid leave had a 92.3% probability of working for the same employer after the birth
(p<0.01).
The marginal effect of working for the same employer after birth among mothers utilizing paid leave increased by 18.2%
(p<0.01), with a 95% confidence interval of 14.2% to 22.1%.
IMPLICATIONS
In this brief, we find a significant relationship between the use of paid leave and greater employment stability among first-time
mothers. First-time mothers who utilized paid leave were 26.3 percentage points less likely to quit their jobs than mothers who
did not utilize paid leave (p<0.01). In addition, mothers who utilized paid leave were 18.2 percentage points more likely to
work for the same employer after the birth of their first child (p<0.01). These findings suggest that mothers that utilize paid
leave benefits provided by their employer may experience a greater ability to balance their career and caregiving
responsibilities. In addition, these findings suggest that employers that offer paid leave benefits may be more likely to
experience increased levels of employee retention, as first-time mothers who utilize paid leave are more likely to return to
their job.
T
hese findings are subject to two notable limitations. First, this analysis limits its focus to first-time mothers. Additional research is
needed to examine whether the use of paid leave benefits produces greater employment stability among other key populations of U.S.
workforce. Second, while propensity score matching controls for the observable differences between first-time mothers who utilized
or did not utilize paid leave, the methodology does not control for unobserved differences. Due to this inability to control for
unobservable differences, the possibility exists that mothers who utilized paid leave could have differed from mothers who did not, in
important ways. Despite these limitations, this analysis takes a rigorous approach to identifying a statistically significant relationship
between the use of paid leave and employment stability among first-time mothers in a nationally representative sample. Given the
promising findings, future research is recommended to determine if paid leave produces greater employment stability for first-time
mothers.
4
The predicted probabilities and marginal effects for the paid leave treatment variable were calculated by setting all other explanatory variables to their mean values.

4
APPENDIX A: MATCHING VARIABLES
1. Hispanic Ethnicity
2. How Mother became a Naturalized Citizen
3. Immigration Status upon Entry to the U.S.
4. Married at Birth
5. Mother became Separated from Her Partner before the Birth
6. Mother became Unable to Work before the Birth, Due to a Health Limitation
7. Mother Did not Have Health Insurance before the Birth
8. Mother had Multiple Separations from Partners before the Birth
9. Mother had a Birth in California after the Passage of the California Paid Family Leave Program
10. Mother had a Gap in Health Insurance before the Birth
11. Mother had a Second Marriage before the Birth
12. Mother had a Work Limitation Before the Birth
13. Mother had Other Circumstances that Led to a Stop in Work after Birth
14. Mother had Other Circumstances that Led to a Stop in Work before Birth
15. Mother Moved in the Year Before, During, or After the Pregnancy
16. Mother Moved to the U.S.
17. Mother Never Stopped Working after Birth
18. Mother Never Stopped Working before Birth
19. Mother Was a Permanent U.S. Resident before the Birth
20. Mother Was Let Go from Job after Birth
21. Mother Was on Medicaid before the Birth
22. Mother Was on Other Unpaid Leave before Birth
23. Mother Was on Unpaid Maternity Leave before Birth
24. Mother Was on Unpaid Sick Leave before Birth
25. Mother Was on Unpaid Vacation Leave before Birth
26. Mother Was Self-Employed after Birth
27. Mother Was Self-Employed before Birth
28. Mother Worked Full-Time Before Birth
29. Mother’s Age at Birth
30. Mother's Employer went Out-of-Business after Birth
31. Mother's Employer went Out-of-Business before Birth
32. Mother’s First Marriage was Terminated before the Birth
33. Mother had Multiple Marriages Terminated before the Birth
34. Mother’s Highest Level of Education
5
35. Mother’s Year of Birth
36. Racial Minority
37. SIPP Person Weight
38. US Citizenship Status
39. Year First Child was Born
40. Year that the Mother Stopped Working Before the Birth
5
Mother’s highest level of education was measured at the time the survey was conducted.

5
APPENDIX B: METHODOLOGY
Data for the analysis consisted of survey data from the 2008 Survey of Income and Program Participation’s (SIPP) Fertility History
Module. The Fertility History Module, administered in January through April of 2009, asked mothers a variety of questions
pertaining to the birth of their first child. This analysis restricted its focus to working mothers who gave birth to their first child
between 2000 and 2008 (n=2,718). This unmatched sample consisted of an unmatched treatment group of 1,415 mothers who utilized
paid leave during their first pregnancy and an unmatched comparison group of 1,303 mothers who did not utilize paid.
In order to control for the observable differences between first-time mothers who utilized or did not utilize paid leave, propensity
score matching and a collection of 40 variables
6
were used to construct propensity scores that were used to estimate the probability
that a first-time mother would utilize paid leave. The estimated propensity scores were utilized to match members of the treatment
group (first-time mothers who utilized paid leave) to members of the comparison group (first-time mothers who did not utilize paid
leave), with the goal of developing matched groups that are statistically identical on the matching variables. Propensity score
matching assumes that there is considerable overlap in the propensity score distribution of the treatment and comparison groups.
Following common practice, individuals on the extreme ends of the propensity score who were outside of the common support were
removed from the matching process, which consisted of 59 individuals in the comparison group and 34 individuals in the treatment
group.
A variety of matching methods were evaluated
7
, with Full-Matching selected as the optimal method. Full matching offers a more
flexible approach than greedy matching methods, such as exact or nearest neighbor matching, by making use of all individuals in the
common support region of propensity scores. The method constructs a series of matched sets comprised of either one treated
individual and multiple comparison individuals or one comparison individual and multiple treated individuals
8
. The final model
matched 1,381 mothers using paid leave to 1,244 mothers who did not utilize paid leave.
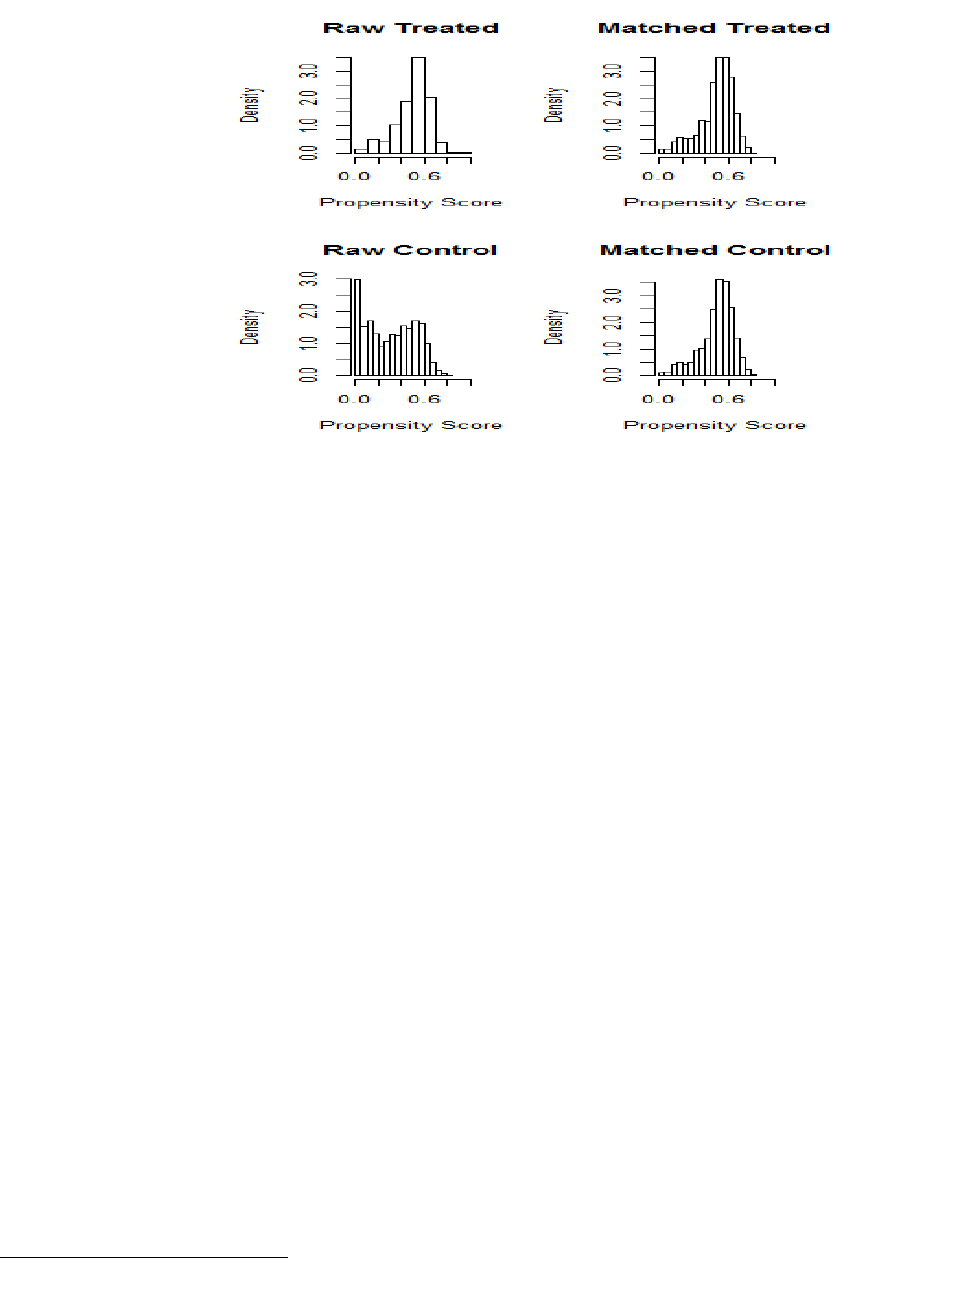
A combination of numerical and graphical diagnostics demonstrated a high-level of covariate balance between the two groups. Figure
2 on the following page shows the distribution of the propensity score before and after matching.
6
Stuart, E. A. (2010). Matching methods for causal inference: A review and a look forward. Statistical Science: A Review Journal of the Institute of Mathematical
Statistics, 25(1), 1-21.
7
Including coarsened exact matching, exact matching, full matching, genetic matching, nearest neighbor matching, Optimal matching, and Sub-classification.
8
Probability weights were calculated for all members of the matched sample and the post-matching analysis was conducted using weighted logistic regression models.
6
Figure 2. Distribution of Propensity Scores Before and After Matching
(By Treatment and Comparison Groups)
Prior to matching, the mean propensity scores were 0.6615 for the treatment group and 0.3675 for the comparison group, with a
standardized mean difference of 1.6145. Standardized mean differences above 0.25 are considered evidence of considerable bias.
9
After matching, the propensity score for both the treatment and comparison groups were 0.6550 and 0.6549, respectively, with a
mean standardized difference of 0.0003. All 40 matching covariates were below the common standard of 0.25 absolute standardized
difference of means. Overall, the matching process produced considerable improvement in the balance of the propensity scores for
the treatment and matched groups. Table 3 provides an overview of the differences in the unmatched and matched samples.
9
Rubin, D. B. (2001). Using propensity scores to help design observational studies: application to the tobacco litigation. Health Services and Outcomes
Research Methodology, 2(3-4), 169-188.

7
Table 3. Differences in Paid Leave Use within the Unmatched and Matched Samples
(For Variables Included in the Multivariate Models)
Unmatched Sample
Matched Sample
Utilized Paid
Leave
Did Not Utilize Paid
Leave
Utilized Paid
Leave
Did Not Utilize Paid
Leave
Age at Birth***
28.9
25.9
28.8
28.9
Ethnicity
Hispanic Ethnicity
Non-Hispanic Ethnicity
9.5%
90.5%
10.5%
89.5%
9.1%
91.0%
9.8%
90.3%
Race***
Racial Minority
17.0%
21.3%
16.9%
18.8%
Caucasian/White
83.0%
78.7%
83.1%
81.2%
Marital Status***
Married at Birth
Unmarried at Birth
76.1%
23.9%
42.3%
57.7%
75.8%
24.2%
75.2%
24.8%
Highest Education***
High School or Less
Some College
Vocational/Associates Degree
College Graduate
Graduate Degree
15.0%
14.1%
19.0%
33.4%
18.5%
28.4%
17.0%
23.3%
20.1%
11.2%
15.1%
14.2%
19.3%
32.8%
18.6%
13.9%
15.8%
19.3%
35.2%
15.9%
Worked Full-Time before the Birth***
95.7%
79.7%
95.6%
95.1%
Number of Observations
1,415
1,303
1,381
1,244
Statistically significant differences in the unmatched sample at the following levels: *p<0.10; **p<0.05; ***p<0.01
A series of weighted
10
and logistic regression models with probability weights were utilized to examine the association between paid
leave use and employment stability in the matched sample and to examine the robustness of the findings across models. These
models consisted of:
Model 1: Bivariate logistic regression model with robust standard errors
Model 2: Multivariate logistic regression model with covariates and robust standard errors
Model 3: Multivariate logistic regression model with covariates, year fixed effects
11
, and robust errors clustered on the year that
the birth occurred
Model 4: Multivariate logistic regression model with covariates, year fixed effects, state fixed effects, and robust, state clustered
errors
12
Tables 4 and 5 provide the model results for the ‘Quit Job’ and ‘Returned to Work at Same Employer’ outcome variables. Model
coefficients consist of log-odds, with the associated standard errors included in parentheses. For ease of interpretation, the findings
provided on page 3 consisted of the marginal effects for the treatment variables included in Model 4. The marginal effects for the
paid leave treatment variable were calculated by setting all of the covariates to their mean values.
10
The weights utilized in the logistic regression models consisted of the probability weights for all individuals in the matched sample that were calculated via the
matching process.
11
Year fixed effects and clustered errors were included to account for differences in the year that the birth occurred.
12
State fixed effects and clustered errors were included to account for differences across state economies and workforces.

8
Table 4. Logit Models with Log-Odds Coefficients
(See Endnotes for Coefficient Interpretation
13,14
)
Outcome: Mother Quit Job Before
or After the Birth
Model 1:
Bivariate
Model 2:
Covariates
Model 3: Covariates
with Year Fixed Effects
Model 4: Covariates, Year Fixed
Effects, and State Fixed Effects
Treatment: Paid Leave
-2.745***
(0.187)
-2.778***
(0.187)
-2.822***
(0.217)
-2.986***
(0.2398)
Worked Full-Time Before
-0.191
(0.225)
-0.298
(0.255)
-0.396
(0.274)
Minority
-0.214
(0.311)
-0.182
(0.231)
-0.390*
(0.228)
Hispanic Origin
-0.207
(0.361)
-0.202
(0.320)
-0.308
(0.384)
Age at Birth
-0.019
(0.020)
-0.020
(0.017)
-0.008
(0.027)
Married at Birth
0.412*
(0.241)
0.382**
(0.225)
0.358
(0.269)
Highest Education
(Reference: College Graduate)
HS or Less
0.145
(0.308)
0.204
(0.314)
0.481
(0.302)
Some College
-0.296
(0.338)
-0.117
(0.378)
-0.106
(0.320)
Vocational/Associates Degree
-0.268
(0.298)
-0.284
(0.231)
0.064
(0.249)
Graduate Degree
-0.671*
(0.350)
-0.556
(0.394)
-0.468
(0.313)
Year Fixed Effects
Yes
Yes
State Fixed Effects
Yes
Constant
-0.496***
(0.122)
0.153
(0.625)
1.214**
(0.592)
-1.240*
(0.733)
Number of Observations
2,625
2,625
2,625
2,603
Statistically Significant at the Following Levels: *p<0.10; **p<0.05; ***p<0.01. Standard errors in parentheses.
13
Coefficients in Tables 4 and 5 consists of Log-Odds. For ease of interpretation, predicted probabilities and marginal effects were calculated for the treatment
variables.
14
Twenty-two observations were dropped in the year and state fixed effects model (model 4), due to a lack of variation in outcomes among mothers within each of the
following states: Mississippi, North Dakota, Vermont and the District of Columbia.

9
Table 5. Logit Models with Log-Odds Coefficients
(See Endnotes for Coefficient Interpretation)
15
Outcome: Worked for
Same Employer After Birth
Model 1:
Bivariate
Model 2:
Covariates
Model 3:
Covariates with
Year Fixed
Effects
Model 4: Covariates,
Year Fixed Effects,
and State Fixed
Effects
Treatment: Paid Leave
1.400***
(0.155)
1.425***
(0.154)
1.448***
(0.154)
1.479***
(0.208)
Worked Full-Time Before
0.304
(0.217)
0.297
(0.219)
0.278
(0.174)
Minority
0.217
(0.238)
0.199
(0.229)
0.198
(0.305)
Hispanic Origin
-0.112
(0.327)
-0.144
(0.337)
-0.144
(0.358)
Age at Birth
0.063***
(0.018)
0.065***
(0.017)
0.053***
(0.018)
Married at Birth
0.094
(0.204)
0.086
(0.203)
0.118
(0.261)
Highest Education
(Reference: College
Graduate)
HS or Less
0.276
(0.245)
0.235
(0.237)
0.087
(0.227)
Some College
0.215
(0.299)
0.066
(0.295)
0.116
(0.282)
Vocational/Associates
Degree
0.281
(0.275)
0.299
(0.260)
0.202
(0.241)
Graduate Degree
0.112
(0.290)
0.044
(0.292)
-0.035
(0.306)
Year Fixed Effects
Yes
Yes
State Fixed Effects
Yes
Constant
0.839***
(0.125)
-1.488**
(0.531)
-2.090***
(0.532)
-1.587**
(0.504)
Number of Observations
2,625
2,625
2,625
2,615
Statistically Significant at the Following Levels: *p<0.10; **p<0.05; ***p<0.01
15
Ten observations were dropped in the year and state fixed effects model (model 4), due to a lack of variation in outcomes among mothers within each of the
following states: North Dakota, Vermont, and the District of Columbia.
