`
State Employment
Relations Board
HEALTH
INSURANCE
THE COST OF HEALTH INSURANCE
IN OHIO’S PUBLIC SECTOR
30
th
Anniversar
y

i
2022HEALTHINSURANCEREPORT
Contents
WELCOME .................................................................................................................................... 1
REVISION NOTES .................................................................................................................... 1
SURVEY BACKGROUND ....................................................................................................... 2
SURVEY METHODS ................................................................................................................ 2
SURVEY RESPONSE RATE .................................................................................................... 3
MEDICAL INSURANCE – OVERVIEW ..................................................................................... 4
MEDICAL PLAN TYPES OFFERED ....................................................................................... 4
MEDICAL PREMIUM INCREASES COMPARED TO SALARY INCREASES................... 5
MEDICAL PREMIUM INCREASES COMPARED TO INFLATION RATES ...................... 6
MEDICAL INSURANCE – ALL PLAN TYPES .......................................................................... 7
MEDICAL PREMIUMS ............................................................................................................ 7
EMPLOYER & EMPLOYEE SHARE OF MEDICAL PREMIUM ....................................... 11
TOTAL MONTHLY MEDICAL PREMIUMS BY PLAN TYPE .......................................... 14
FULLY-INSURED VS SELF-INSURED MEDICAL PLANS ............................................... 15
NETWORK DEDUCTIBLES .................................................................................................. 17
NON-NETWORK DEDUCTIBLES ........................................................................................ 19
COPAY AND COINSURANCE .............................................................................................. 21
OUT-OF-POCKET MAXIMUMS ........................................................................................... 23
MEDICAL INSURANCE – PPO PLANS ................................................................................... 25
PPO PREMIUMS ..................................................................................................................... 25
EMPLOYER & EMPLOYEE SHARE OF MEDICAL PREMIUM ....................................... 27
NETWORK DEDUCTIBLES .................................................................................................. 29
NON-NETWORK DEDUCTIBLES ........................................................................................ 31
OUT-OF-POCKET MAXIMUMS ........................................................................................... 32
MEDICAL INSURANCE – HDHPs ............................................................................................ 34
HDHP PREMIUMS .................................................................................................................. 34
EMPLOYER & EMPLOYEE SHARE OF MEDICAL PREMIUM ....................................... 36
NETWORK DEDUCTIBLES .................................................................................................. 38
NON-NETWORK DEDUCTIBLES ........................................................................................ 40
OUT-OF-POCKET MAXIMUMS ........................................................................................... 41
HEALTH SAVINGS ACCOUNT ............................................................................................ 43
PRESCRIPTION INSURANCE ................................................................................................... 44
PRESCRIPTION CARVE-OUT PREMIUMS......................................................................... 44

ii
2022HEALTHINSURANCEREPORT
PRESCRIPTION COPAYS/COINSURANCE – ALL PLAN TYPES .................................... 45
DENTAL INSURANCE ............................................................................................................... 46
DENTAL CARVE-OUT PREMIUMS ..................................................................................... 46
DENTAL MAXIMUM BENEFIT – ALL PLAN TYPES ....................................................... 47
DENTAL COMPOSITE RATES ............................................................................................. 49
VISION INSURANCE ................................................................................................................. 50
VISION CARVE-OUT PREMIUMS ....................................................................................... 50
VISION COMPOSITE RATES ................................................................................................ 51
LIFE INSURANCE ...................................................................................................................... 52
COST SAVINGS .......................................................................................................................... 53
CONSORTIUMS ...................................................................................................................... 53
WORKSITE WELLNESS PROGRAMS ................................................................................. 55
OPT-OUT INCENTIVES ......................................................................................................... 57
SPOUSAL RESTRICTIONS.................................................................................................... 58
DEPENDENT ELIGIBILITY AUDIT ..................................................................................... 60
DEFINITIONS .............................................................................................................................. 61

1
2022HEALTHINSURANCEREPORT
WELCOME
WELCOME
The State Employment Relations Board (SERB) is pleased to present the Cost of Health Insurance in
Ohio’s Public Sector – 2022 Edition. This report provides a detailed look at trends in employer-sponsored
health coverage, including premiums, employee contributions, cost-sharing provisions, wellness
programs, and other aspects of health insurance for public entities in the State of Ohio. Thank you for
choosing SERB as your source of trusted information.
REVISION NOTES
This year’s report format mirrors the 2021 version with minor format adjustments. Three years ago, the
report was updated to improve usability and make room for many new tables and figures. The overall goal
of the expansion was to provide a more detailed insurance report that included an in-depth analysis of the
data at the medical plan level. The insurance report was also expanded to offer a clear view of the
employer and employee contribution amounts towards the medical premium.
This venture involved a significant update to the insurance survey tool, a complete redesign of the
insurance report, and a thorough review and verification of the medical plan data submitted.
The report contains the following sections:
Welcome
Medical Insurance Overview
Medical Insurance – All Plan Types
Medical Insurance – PPO Plans
Medical Insurance – HDHPs
Prescription Insurance
Dental Insurance
Vision Insurance
Life Insurance
Cost Savings
Definitions

2
2022HEALTHINSURANCEREPORT
WELCOME
SURVEY BACKGROUND
The State Employment Relations Board (SERB), as mandated by section 4117.02 of the Ohio Revised
Code, is pleased to present the Annual Report on the Cost of Health Insurance in Ohio’s Public Sector
(2022 Edition). In its 30
th
year, this survey aims to collect data on various aspects of health insurance,
plan design, and cost for government entities. Our goal is to provide statistics that may be useful for both
the employer and employee organizations and promote orderly and constructive labor relationships
between public employers and their employees. This report of survey findings provides a detailed look at
employer-offered health coverage for medical, prescription, dental, vision, and life insurance plans. The
survey collected information on various topics, including premiums, employer/employee contributions,
plan deductibles and out-of-pocket maximums, coinsurance, plan design, eligibility, wellness programs,
and other medical plan benefits.
SURVEY METHODS
The 2022 Health Insurance Survey was created and dispersed using Novi Survey, an online survey tool.
SERB emailed or mailed 1,316 links of the survey to public sector employers across the state during
January, requesting completion of the survey by March 2022. The target survey population included:
Government Schools Colleges/Universities Special Districts
State School Districts (City, Local, Exempted Village) Community Colleges Fire Districts
Counties Joint Vocational Schools & Career Centers State Colleges Metro Housing Authorities
Cities Educational Service Centers (ESCs) State Universities Port Authorities
Townships
Regional Transit Authorities
This year SERB received 1,249 completed surveys that captured data collected from 2,046 health
insurance plans available to public sector employees in Ohio. All benefit information throughout this
report includes single and family coverage types. Please remember that the data collected represents
public sector health insurance plans that were in effect on January 1, 2022.
The survey instrument collects data from up to three medical and prescription plans per employer and a
single dental, vision, and life insurance plan. If employers offer more insurance plans than the survey can
collect, the employer reported the three insurance plans with the highest number of employees
participating.
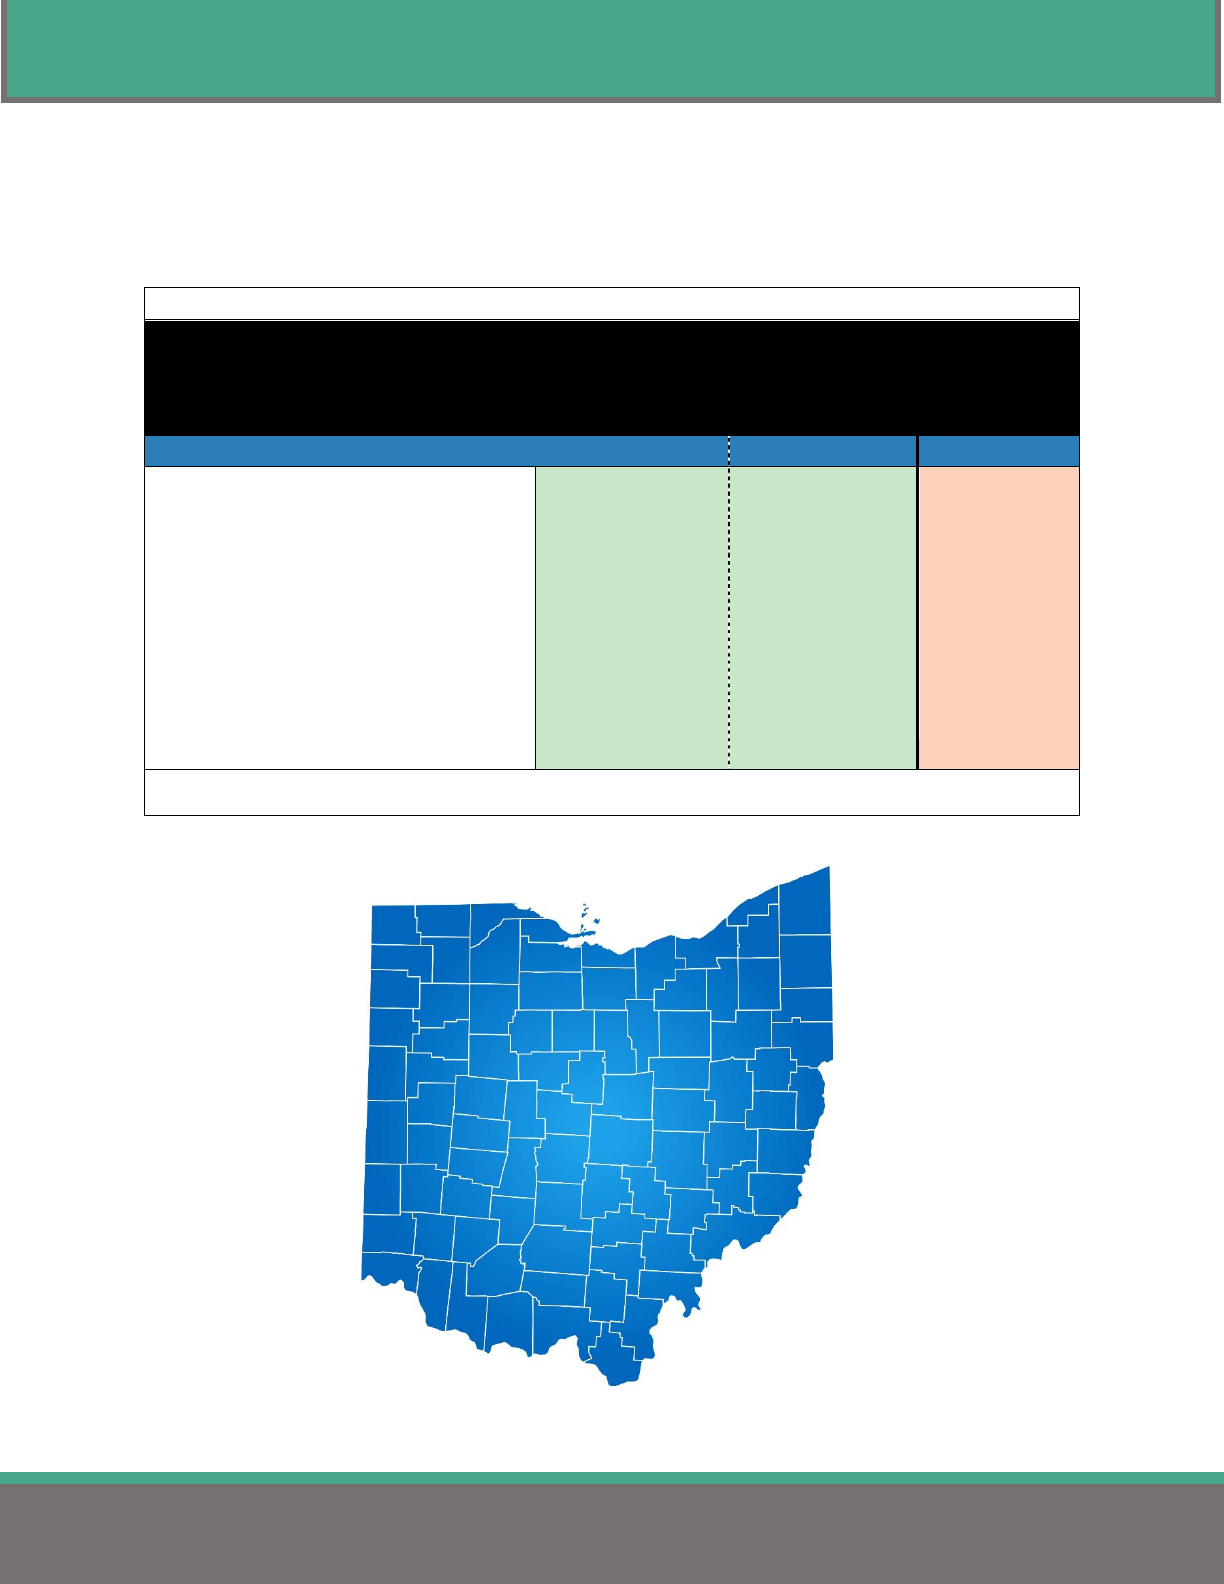
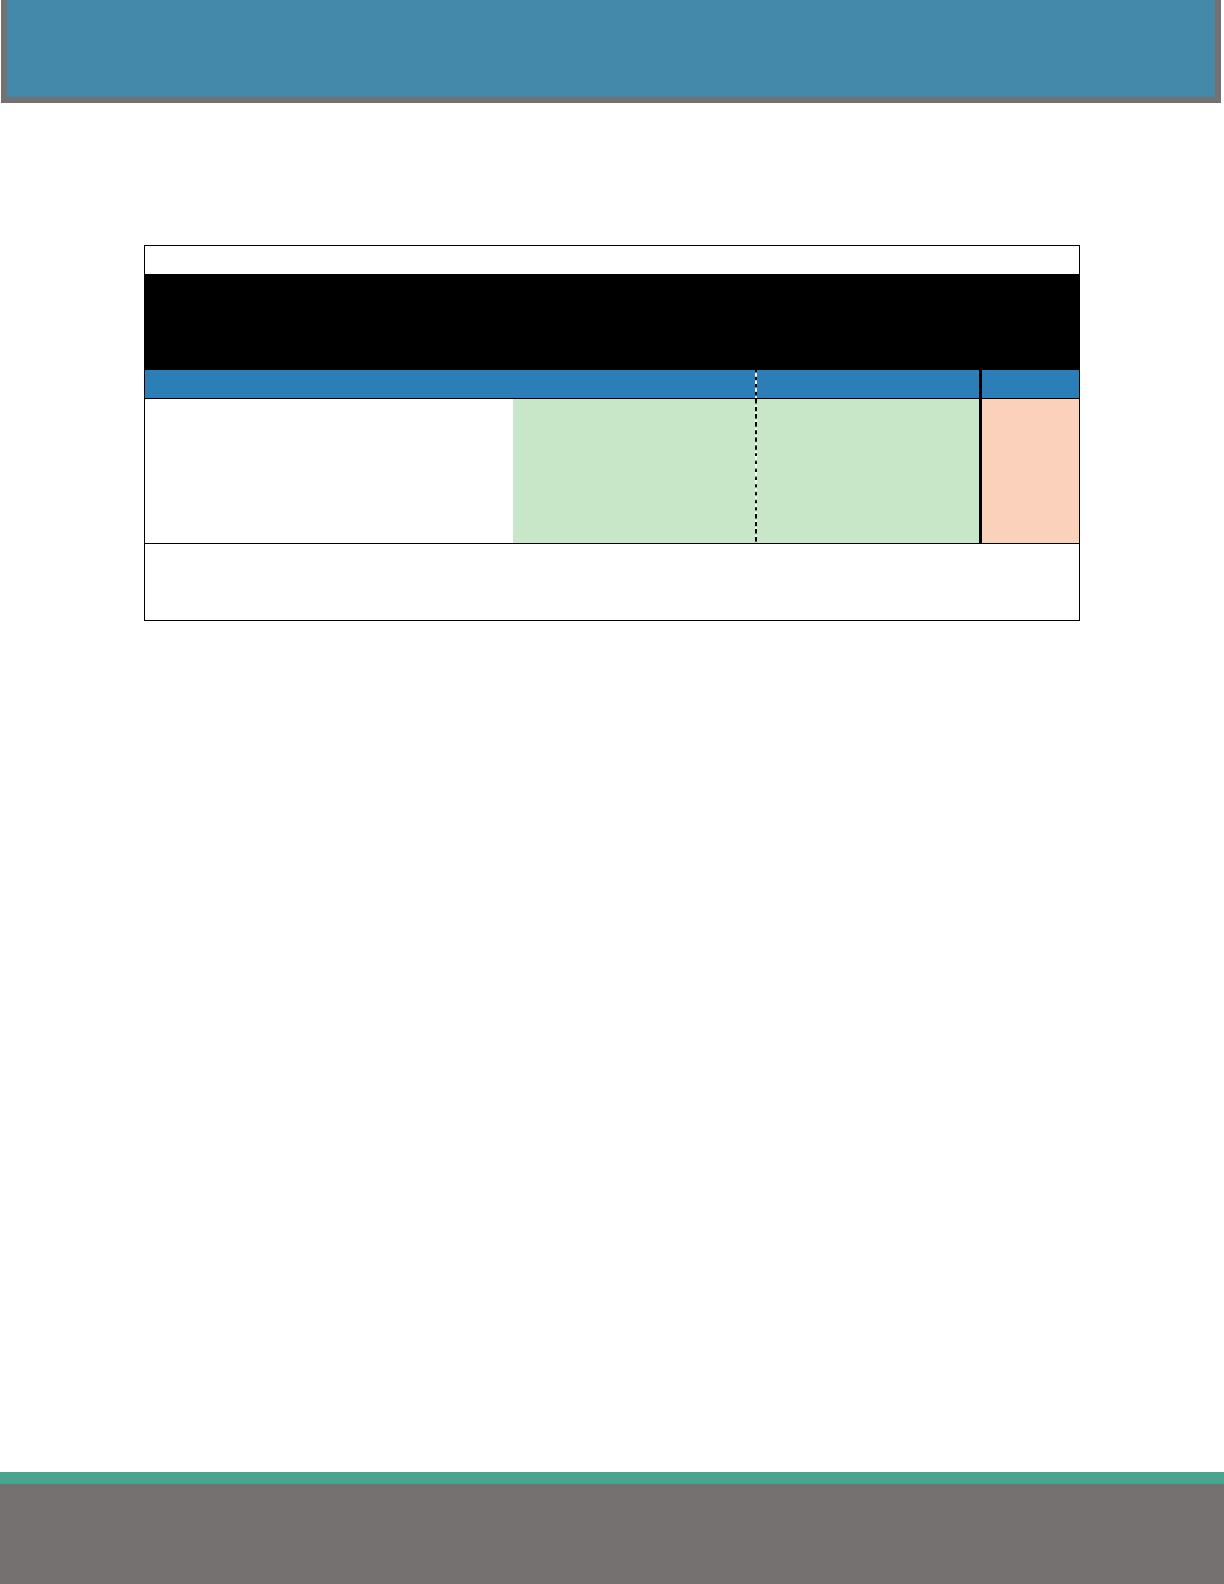
Table 1 displays the quantity of health insurance plans collected during the survey. The insurance plan
data appears in various formats throughout this report.
Table 1
Reported Number of Insurance Plans Offered Statewide
Medical Prescription Dental Vision Life
STATEWIDE 2,046 2,015 1,196 1,067 1,195
Note: Plans offered will vary depending on the response rate.
3
2022HEALTHINSURANCEREPORT
WELCOME
SURVEY RESPONSE RATE
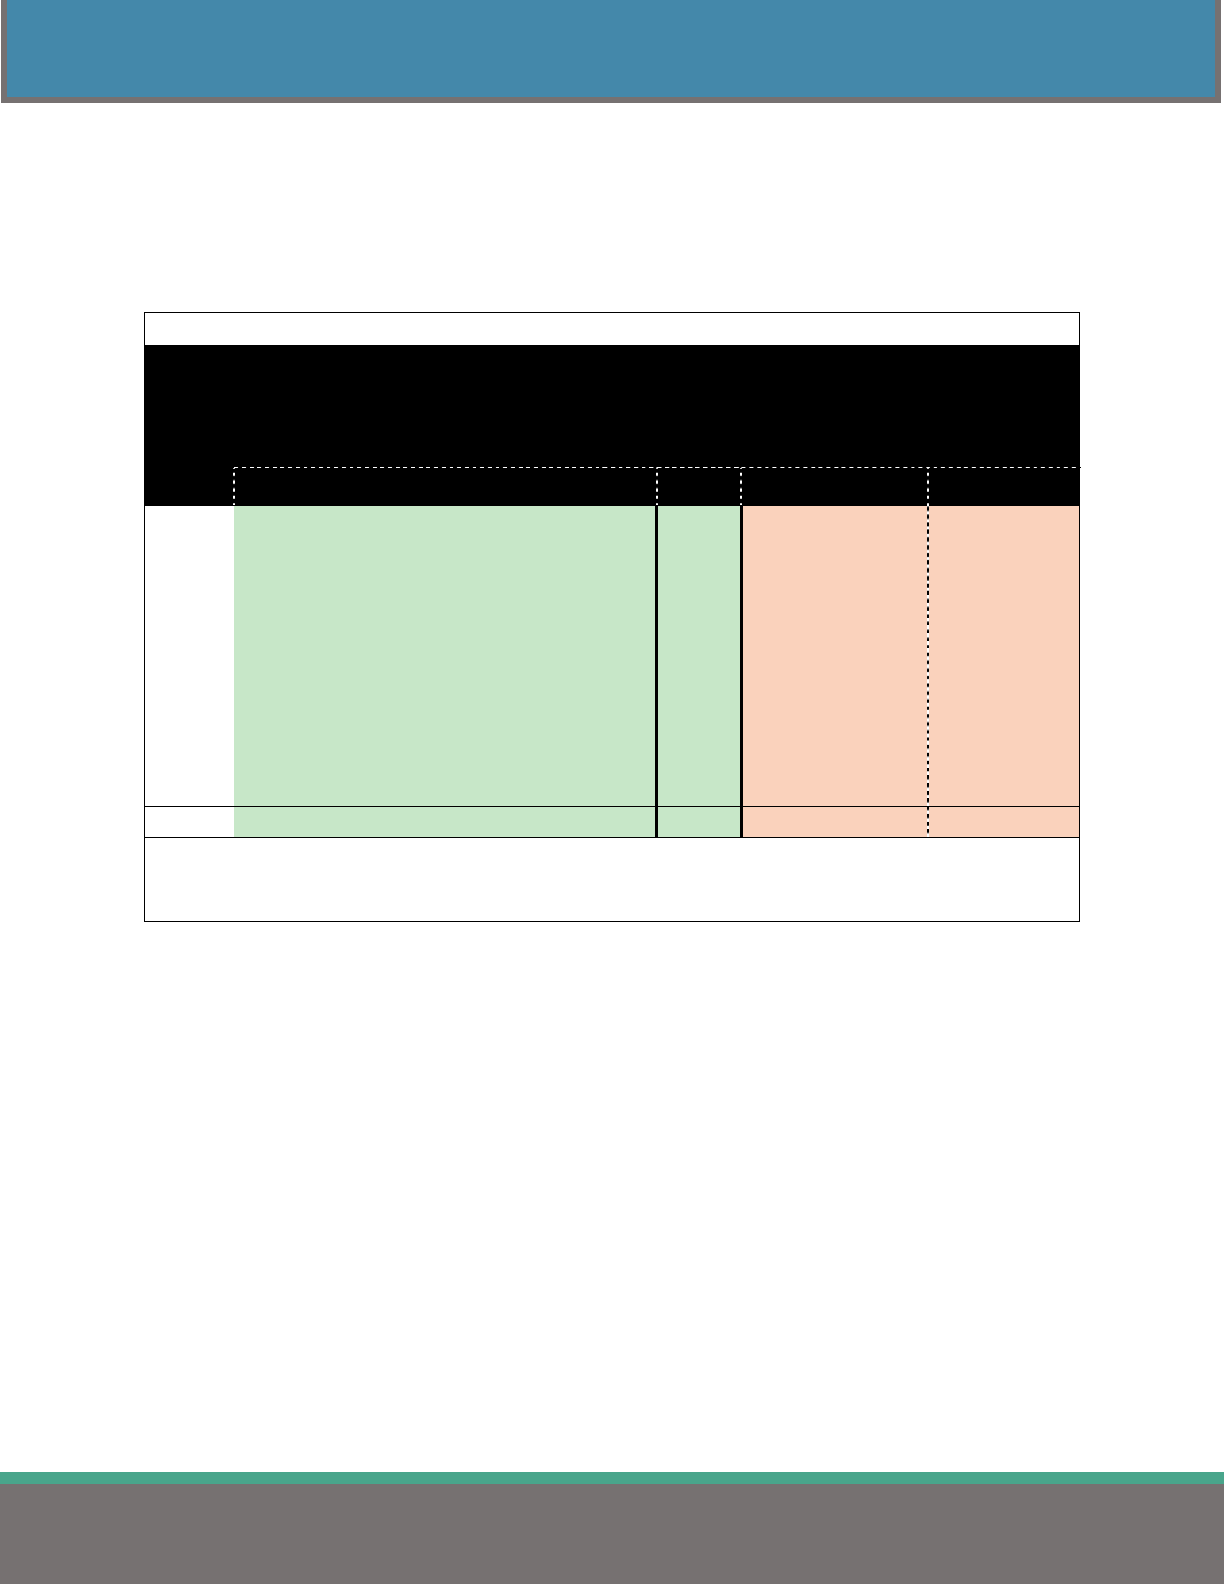
Table 2 displays the percent of public sector employers that completed and returned surveys for 2022 by
jurisdiction. This year’s response rate was 94.9%. Sixteen employers indicated that they do not offer
medical insurance. These employers have been omitted from all tables, except Table 2, in this report.
Table 2
Survey Response Rate
by Jurisdiction
Comparison Group Surveys Sent Surveys Completed Response Rate
STATEWIDE 1,316 1,249 94.9%
State of Ohio 1 1 100.0%
Counties 88 83 94.3%
Cities 250 232 92.8%
Townships 153 133 86.9%
School Districts & ESCs 708 694 98.0%
Colleges & Universities 37 36 97.3%
Fire Districts 20 18 90.0%
Metro Housing Authorities 40 35 87.5%
Port Authorities 5 4 80.0%
Regional Transit Authorities 14 13 92.9%
Note: The number of surveys completed includes submissions from employers that do not offer insurance.
Note: Sixteen employers stated they do not offer medical insurance.

4
2022HEALTHINSURANCEREPORT
MEDICAL INSURANCE – OVERVIEW
MEDICAL INSURANCE – OVERVIEW
MEDICAL PLAN TYPES OFFERED
Table 3 displays the percentage of plan types offered by jurisdiction. Many employers offer more than
one type of medical plan to their employees. Therefore, the number of plans (n = 2,046) reported exceeds
the number of surveyed employers. The survey collected information for the following medical plan
types: Exclusive Provider Organization (EPO), Preferred Provider Organization (PPO), Point of Service
(POS), Health Maintenance Organization (HMO), and High Deductible Health Plan (HDHP). PPOs and
HDHPs are the two most utilized medical plan types.
Table 3
Percentage of Plan Types Offered
by Jurisdiction
Comparison Group EPO PPO POS HMO HDHP n
STATEWIDE 0.7% 51.0% 1.1% 1.4% 45.8% 2,046
State of Ohio 0.0% 50.0% 0.0% 0.0% 50.0% 2
Counties 2.7% 51.7% 4.0% 2.0% 39.6% 149
Cities 0.8% 48.0% 0.8% 1.9% 48.5% 371
Townships 0.0% 32.2% 2.1% 0.7% 65.0% 146
School Districts & ESCs 0.2% 55.5% 0.7% 1.2% 42.4% 1,204
Colleges & Universities 3.8% 47.5% 0.0% 0.0% 48.7% 78
Fire Districts 0.0% 0.00% 0.0% 0.0% 100.0% 15
Metro Housing Authorities 1.9% 38.5% 1.9% 1.9% 55.8% 52
Port Authorities 0.0% 20.0% 0.0% 0.0% 80.0% 5
Regional Transit Authorities 4.2% 58.3% 0.0% 8.3% 29.2% 24
NUMBER OF PLANS (n) 15 1,043 22 28 938
Note: Plan Types - EPO: Exclusive Provider Organization; PPO: Preferred Provider Organization; POS: Point of Service;
HMO: Health Maintenance Organization; HDHP: High Deductible Health Plan.
Note: n: number of
p
lans.
Preferred Provider Organizations (PPOs) continue the status of the most utilized plan type. PPOs
represent 51.0% of all medical plans statewide.
The frequency of High Deductible Health Plans (HDHPs) has increased slightly since the 2021
survey. HDHPs make up 45.8% of plans statewide, compared to 44.8% in 2021.
Regional Transit Authorities have the lowest percentage of HDHPs, followed by Counties.
5
2022HEALTHINSURANCEREPORT
MEDICAL INSURANCE – OVERVIEW
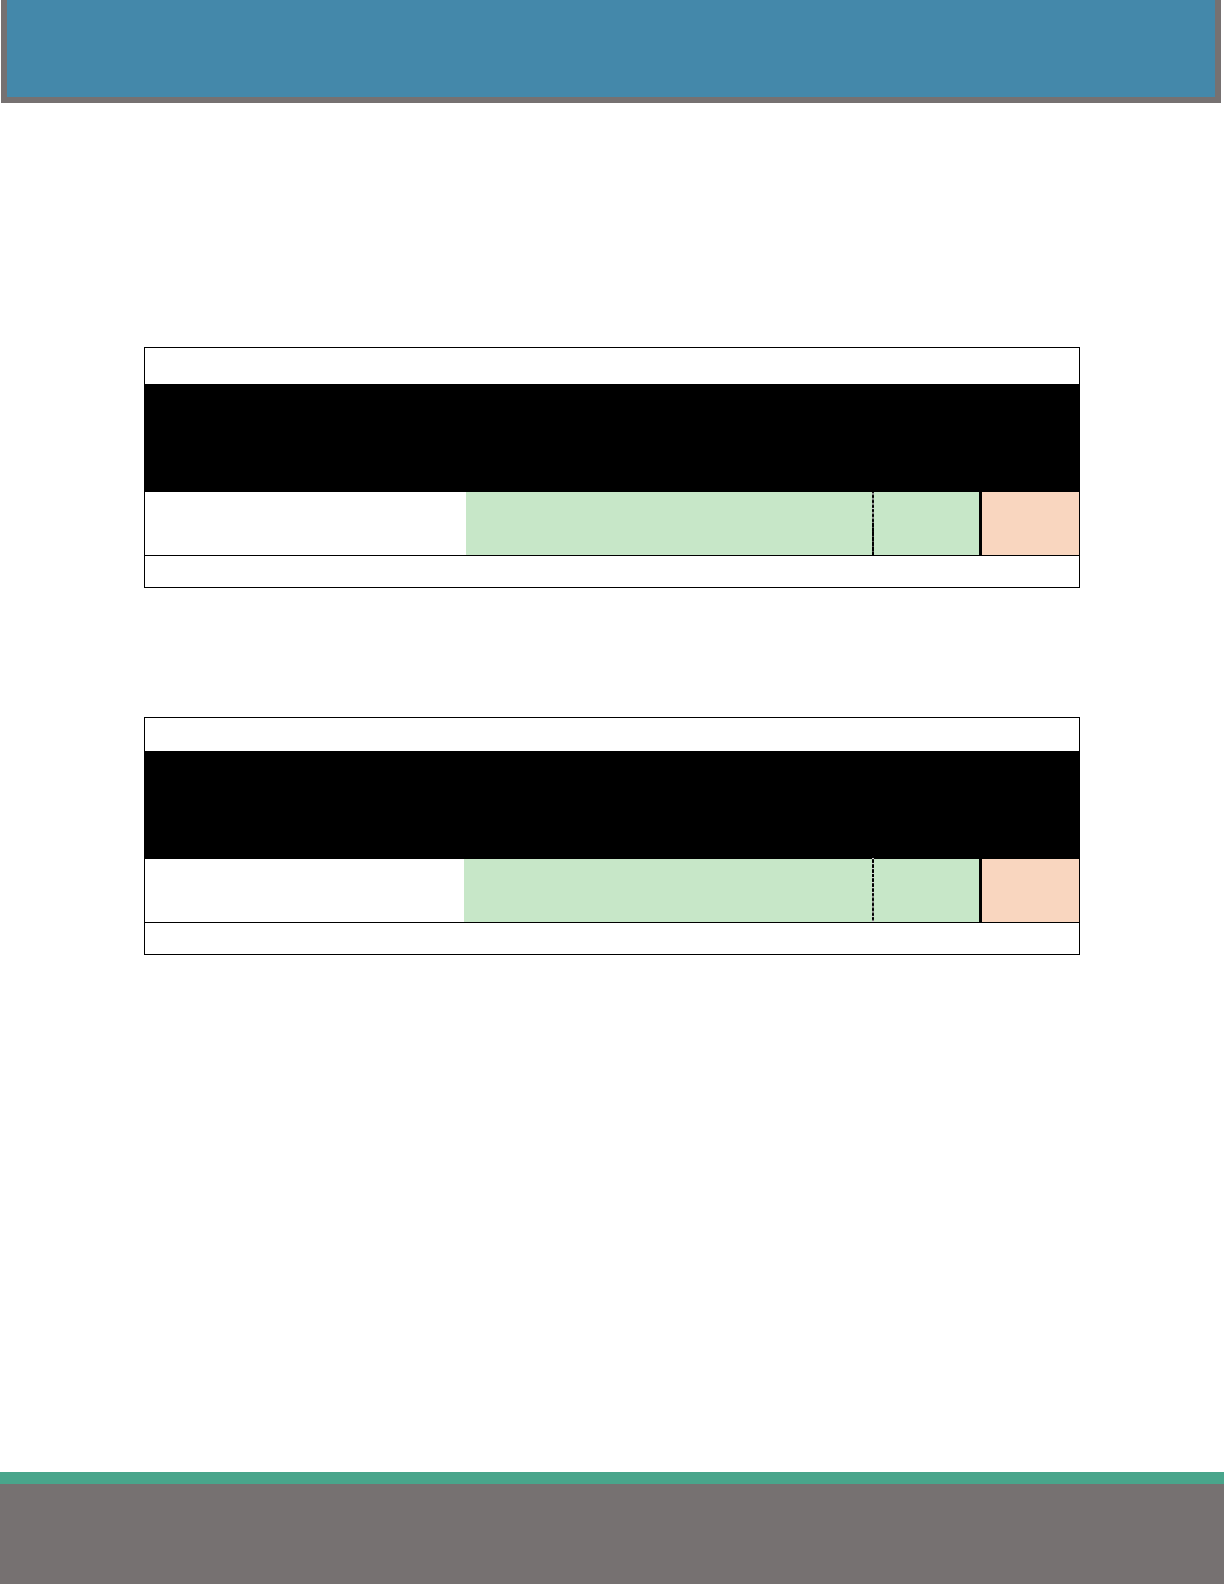
MEDICAL PREMIUM INCREASES COMPARED TO SALARY INCREASES
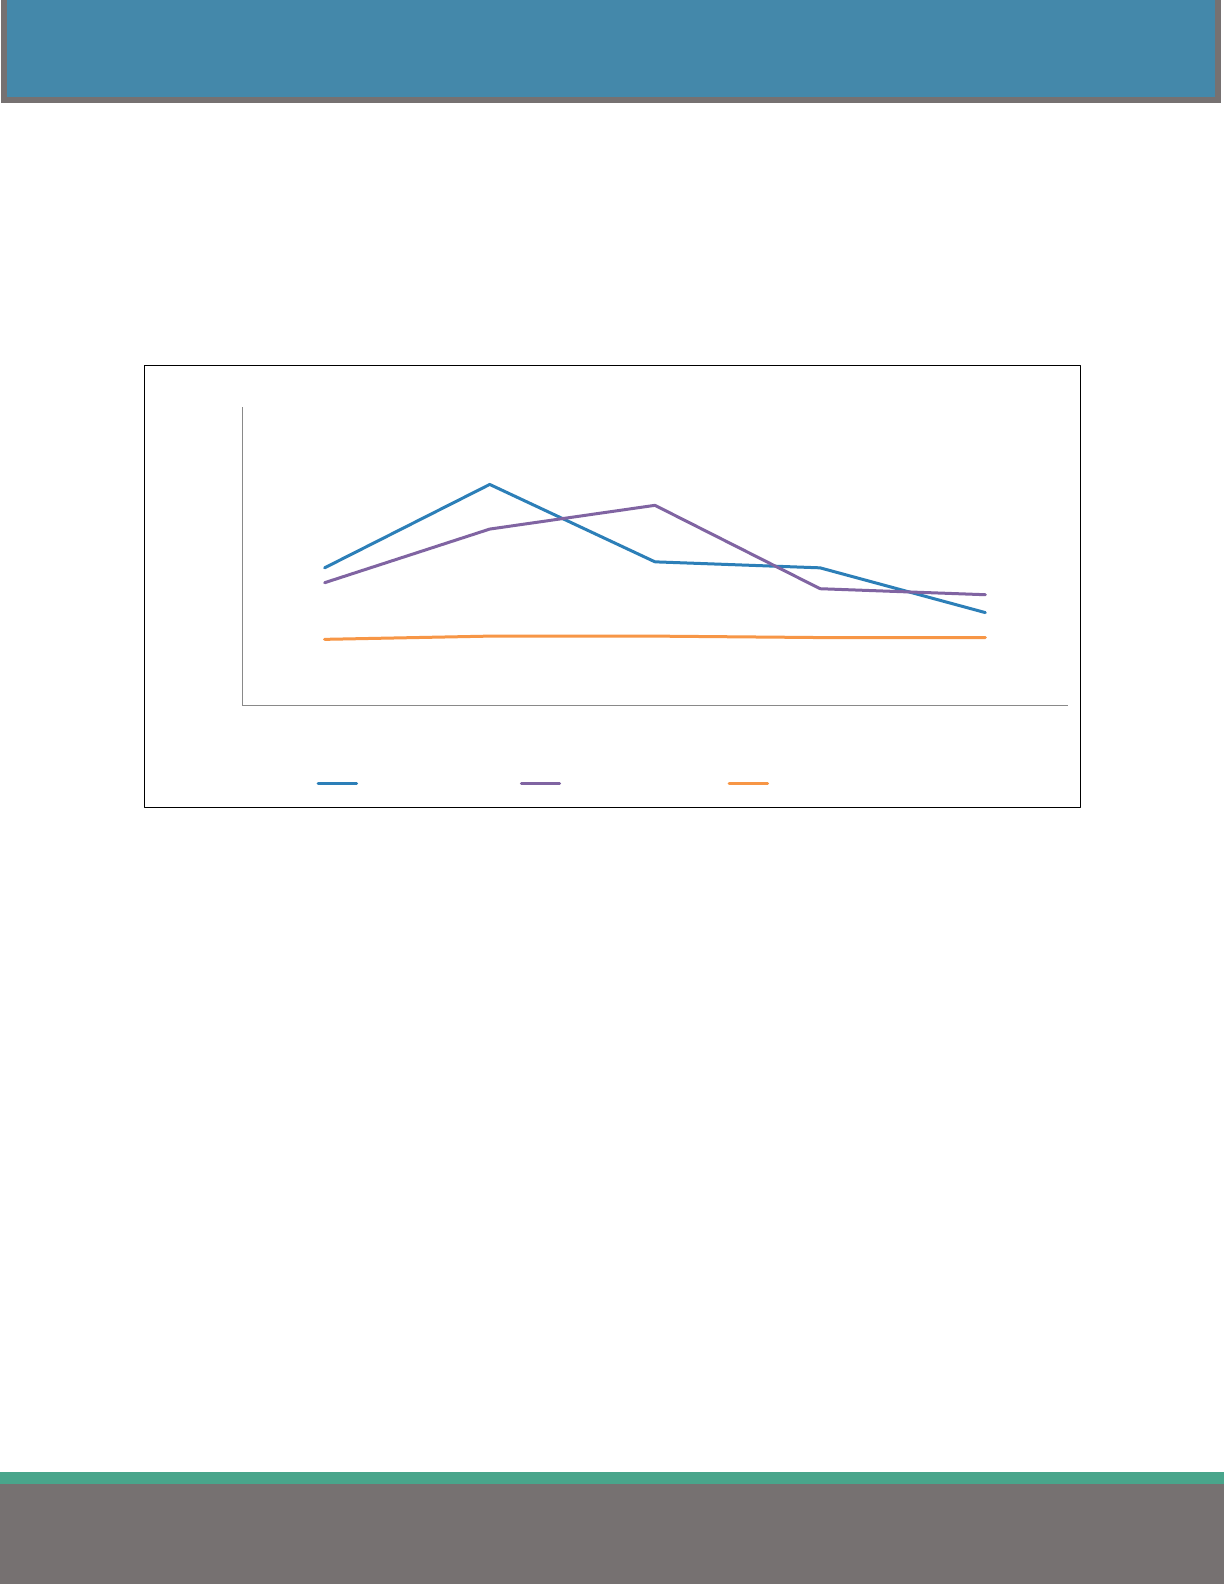
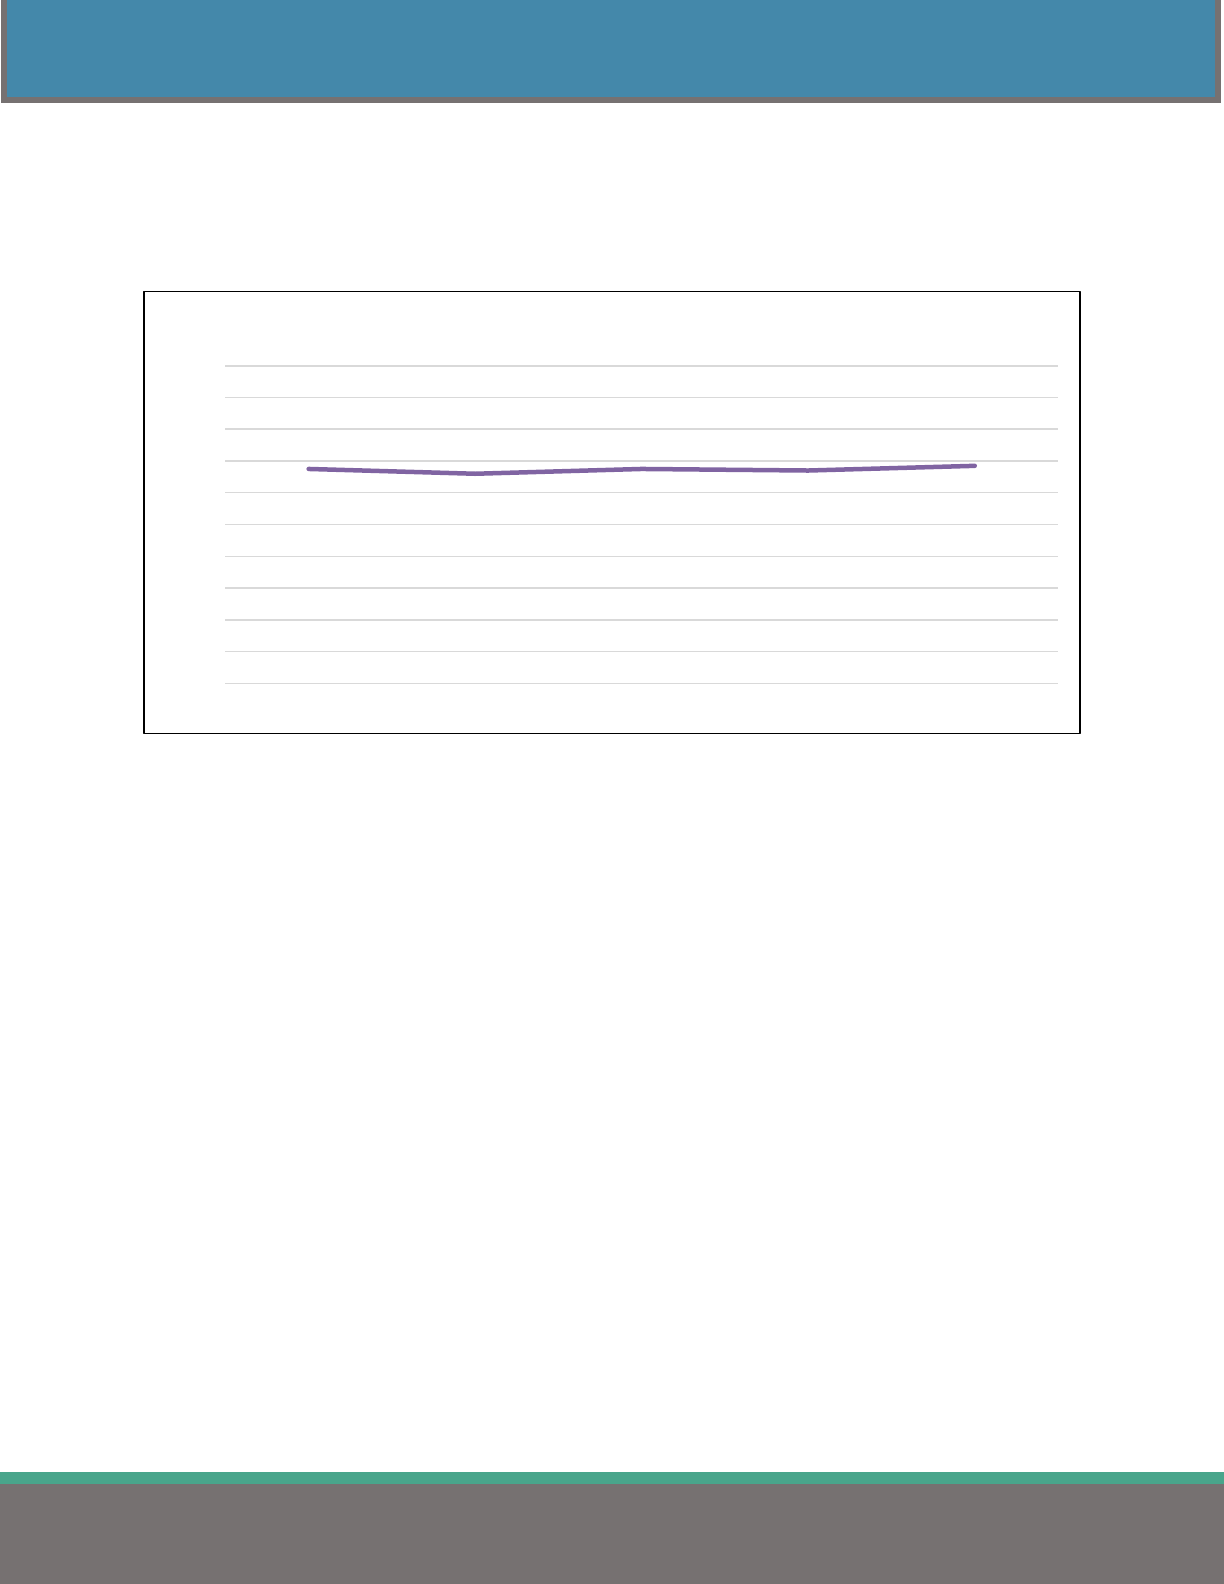
Figure 1 graphs the percent change in single and family medical premiums compared to the average
negotiated wage increase for public employees from SERB’s Annual Wage Settlement report. The
relatively flat line represents the average wage increases for public sector employees over the past five
years, ranging between 2.2% and 2.3%. Comparatively, medical insurance premiums have risen at a
higher rate.
Figure 1
4.6%
7.4%
4.8%
4.6%
3.1%
4.1%
5.9%
6.7%
3.9%
3.7%
2.2%
2.3%
2.3%
2.3%
2.3%
0%
2%
4%
6%
8%
10%
2018 2019 2020 2021 2022
PercentIncrease
StatewideAnnualPercentIncreasesinMedicalPremiums
vs.AverageWageIncreases
SinglePremium FamilyPremium AverageWageIncrease
6
2022HEALTHINSURANCEREPORT
MEDICAL INSURANCE – OVERVIEW
MEDICAL PREMIUM INCREASES COMPARED TO INFLATION RATES
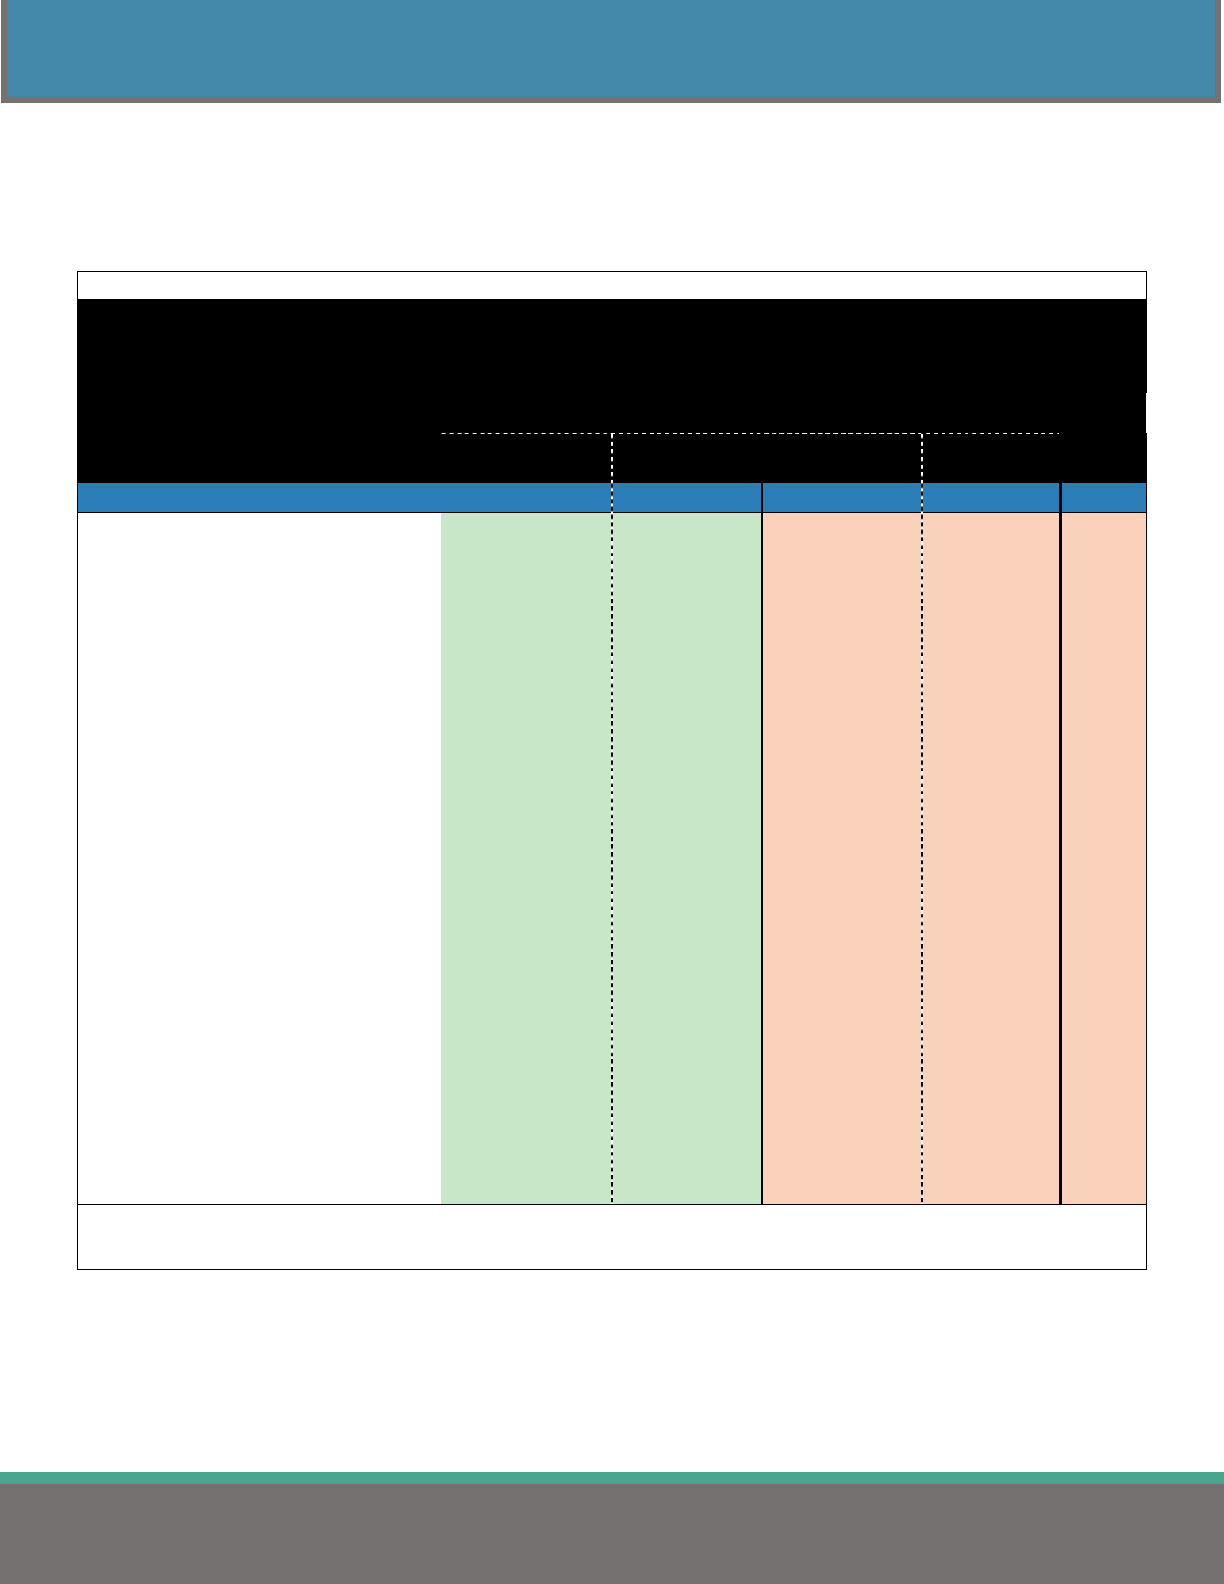
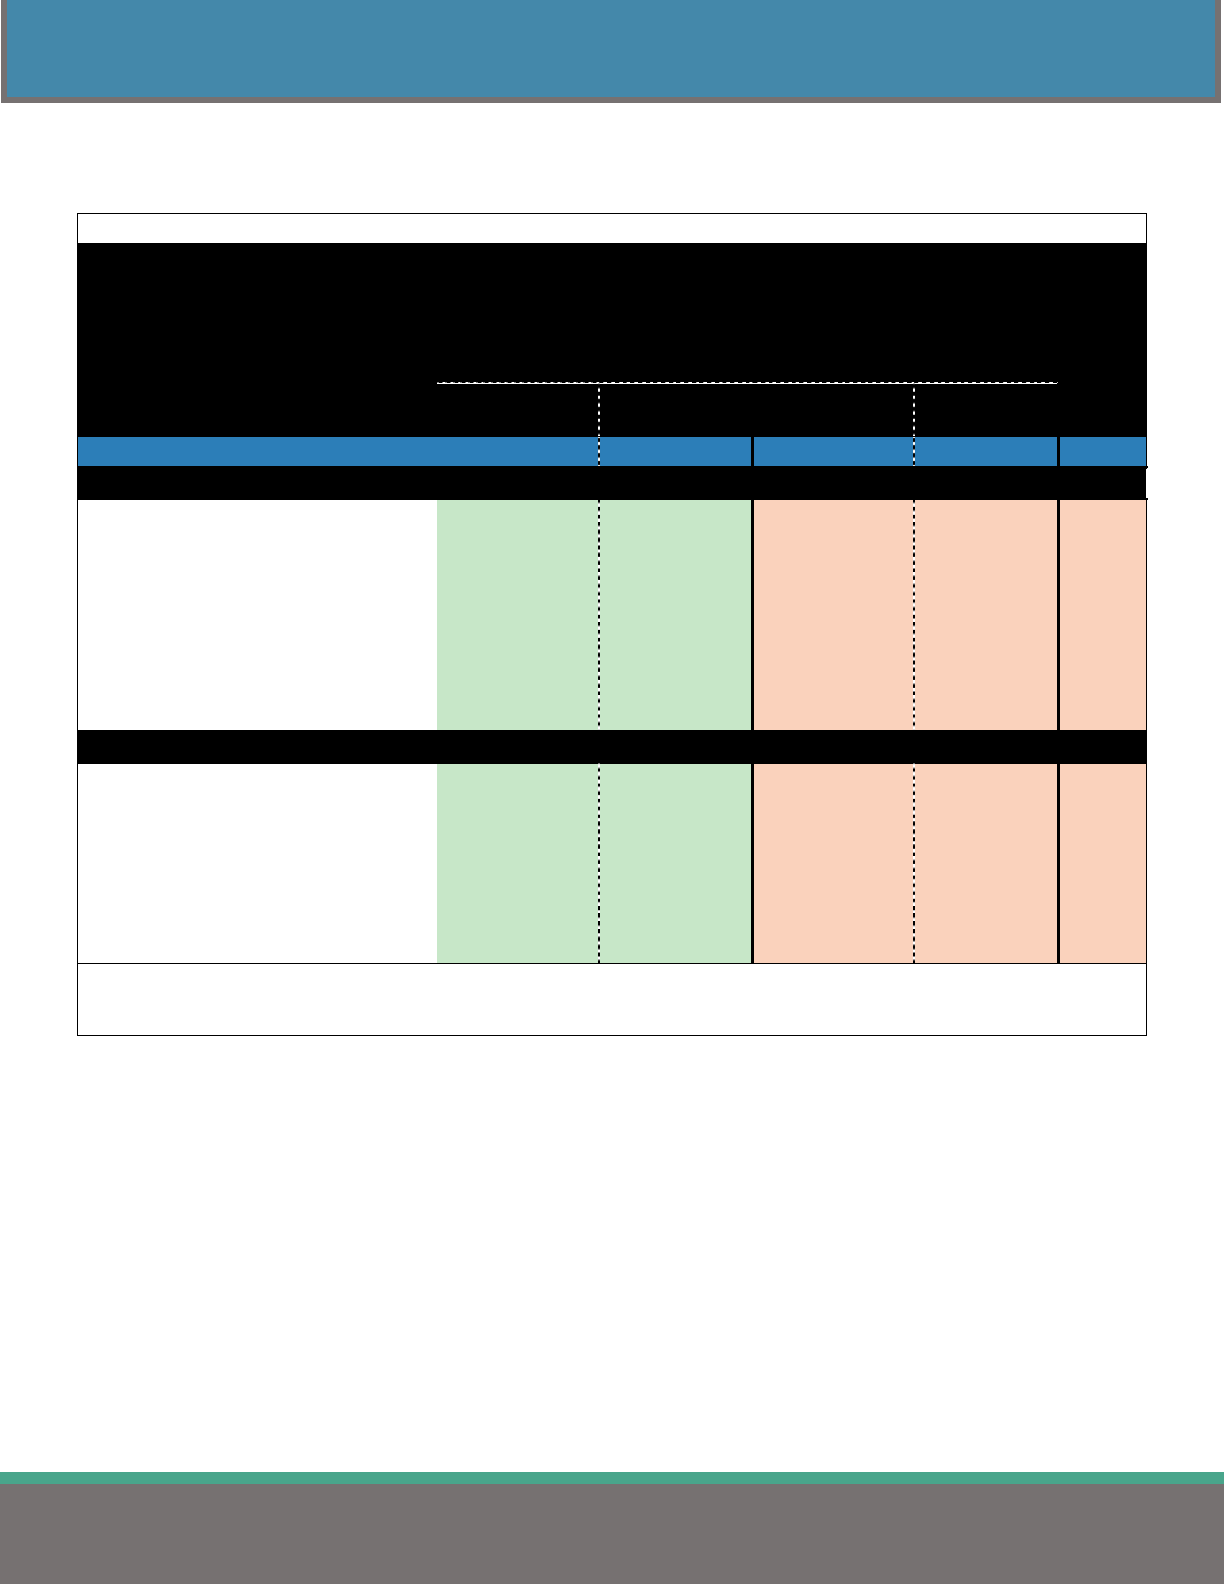
Table 4 compares the annual percent change in public sector medical premiums over the past ten years to
the overall national inflation and medical care inflation rates provided by the United States Bureau of
Labor Statistics. Premium rates for medical insurance in the State of Ohio increased at a higher
percentage rate than the overall national inflation and medical care inflation rates this past year.
Table 4
Annual Percent Change in Medical Care Costs,
Inflation, and Medical Care Inflation Rates
Statewide Public Sector National
Year Single Premium Family Premium n Inflation Rate Medical Care
2012 6.8% 7.0% 1,499 3.0% 3.5%
2013 2.8% 2.3% 1,552 1.7% 3.2%
2014 5.0% 4.5% 1,598 1.5% 2.0%
2015 4.4% 4.3% 1,694 0.8% 3.0%
2016 1.6% 2.3% 1,753 0.7% 2.6%
2017 4.7% 4.6% 1,809 2.1% 4.1%
2018 4.6% 4.2% 1,863 2.1% 1.8%
2019 7.4% 5.9% 2,009 1.9% 2.0%
2020 4.8% 6.7% 1,952 2.3% 4.6%
2021 4.6% 3.9% 2,067 1.4% 1.8%
2022 3.1% 3.7% 2,046 7.0% 2.2%
Note: National; includes both public and private sector employers nationwide.
Note: United States Bureau of Labor Statistics, Consumer Price Index, December 2021
https://www.bls.gov/news.release/archives/cpi_01122022.pdf
Note: n: number of
p
lans.
7
2022HEALTHINSURANCEREPORT
MEDICAL INSURANCE – ALL PLAN TYPES
MEDICAL INSURANCE – ALL PLAN TYPES
MEDICAL PREMIUMS
Table 5 breaks down the average medical premiums and the contribution amounts shared by the employer
and the employee. These averages include the costs of prescription, dental, and vision coverages when
included with the medical premiums. Averages presented in all tables in this report are not weighted,
meaning each reporting jurisdiction counts as one, regardless of size.
Table 5
Average Monthly Employer & Employee Contributions
Towards Medical Premium
(All Medical Plan Types)
Single Family
Comparison Group
Employer
Share
Employee
Share Total
Employer
Share
Employee
Share Total n
STATEWIDE $ 665.31 $ 97.44 $ 762.75 $ 1,733.73 $ 274.48 $ 2,008.21 2,046
State of Ohio $ 677.50 $ 97.00 $ 774.50 $ 1,944.50 $ 285.50 $ 2,230.00 2
Counties $ 653.88 $ 94.64 $ 748.52 $ 1,787.18 $ 280.93 $ 2,068.11 149
Less than 50,000 $ 687.47 $ 95.82 $ 783.29 $ 1,851.03 $ 296.57 $ 2,147.60 57
50,000 - 149,999 $ 636.71 $ 98.55 $ 735.26 $ 1,779.99 $ 286.34 $ 2,066.33 52
150,000 or more $ 628.34 $ 87.88 $ 716.22 $ 1,705.54 $ 251.61 $ 1,957.15 40
Cities $ 675.21 $ 86.33 $ 761.54 $ 1,862.04 $ 242.87 $ 2,104.91 371
Less than 25,000 $ 680.60 $ 83.93 $ 764.53 $ 1,902.20 $ 242.95 $ 2,145.15 264
25,000 - 99,999 $ 657.80 $ 92.75 $ 750.55 $ 1,788.64 $ 245.17 $ 2,033.81 98
100,000 or more $ 709.05 $ 85.86 $ 794.91 $ 1,505.39 $ 215.73 $ 1,721.12 9
Townships $ 698.63 $ 60.16 $ 758.79 $ 1,905.17 $ 178.00 $ 2,083.17 146
Less than 10,000 $ 733.66 $ 47.70 $ 781.36 $ 1,940.99 $ 143.26 $ 2,084.25 69
10,000 - 29,999 $ 704.83 $ 64.38 $ 769.21 $ 1,951.29 $ 179.80 $ 2,131.09 56
30,000 or more $ 578.17 $ 87.11 $ 665.28 $ 1,686.41 $ 272.72 $ 1,959.13 21
School Districts $ 655.72 $ 103.80 $ 759.52 $ 1,658.03 $ 287.53 $ 1,945.56 1,204
Less than 1,000 $ 663.76 $ 94.81 $ 758.57 $ 1,695.51 $ 261.11 $ 1,956.62 329
1,000 - 2,499 $ 667.19 $ 108.95 $ 776.14 $ 1,682.67 $ 291.84 $ 1,974.51 473
2,500 - 9,999 $ 619.73 $ 101.96 $ 721.69 $ 1,573.81 $ 283.14 $ 1,856.95 285
10,000 or more $ 675.67 $ 111.17 $ 786.84 $ 1,647.20 $ 417.19 $ 2,064.39 32
Educational Svc Centers $ 674.38 $ 113.44 $ 787.82 $ 1,663.43 $ 331.30 $ 1,994.73 85
Colleges & Universities $ 645.03 $ 114.70 $ 759.73 $ 1,795.60 $ 332.31 $ 2,127.91 78
Fire Districts $ 623.38 $ 93.29 $ 716.67 $ 1,800.65 $ 256.99 $ 2,057.64 15
Metro Housing Authorities $ 709.02 $ 112.88 $ 821.90 $ 1,874.70 $ 377.27 $ 2,251.97 52
Port Authorities $ 583.18 $ 88.86 $ 672.04 $ 1,749.87 $ 263.49 $ 2,013.36 5
Regional Transit Authorities $ 889.08 $ 96.84 $ 985.92 $ 1,720.21 $ 251.16 $ 1,971.37 24
Note: Includes plans where employees contribute $0 to the medical premium.
Note: Includes plans where the medical premium includes the cost of prescription and dental.
Note: n: number of plans
8
2022HEALTHINSURANCEREPORT
MEDICAL INSURANCE – ALL PLAN TYPES
In Table 5 (located on page 7), Port Authorities reported the lowest average single premiums at
$672.04, which is 11.9% below the statewide average of $762.75. School Districts reported the
lowest family premiums at $1,945.56. The School Districts average family premium is 3.1%
below the statewide average of $2,008.21.
In Table 5 (located on page 7), Regional Transit Authorities reported the highest average single
premiums at $985.92, which is 29.3% above the statewide average of $762.75. Metro Housing
Authorities reported the highest family premiums at $2,251.97. The Metro Housing Authority
family premium is 12.1% above the statewide average of $2,008.21
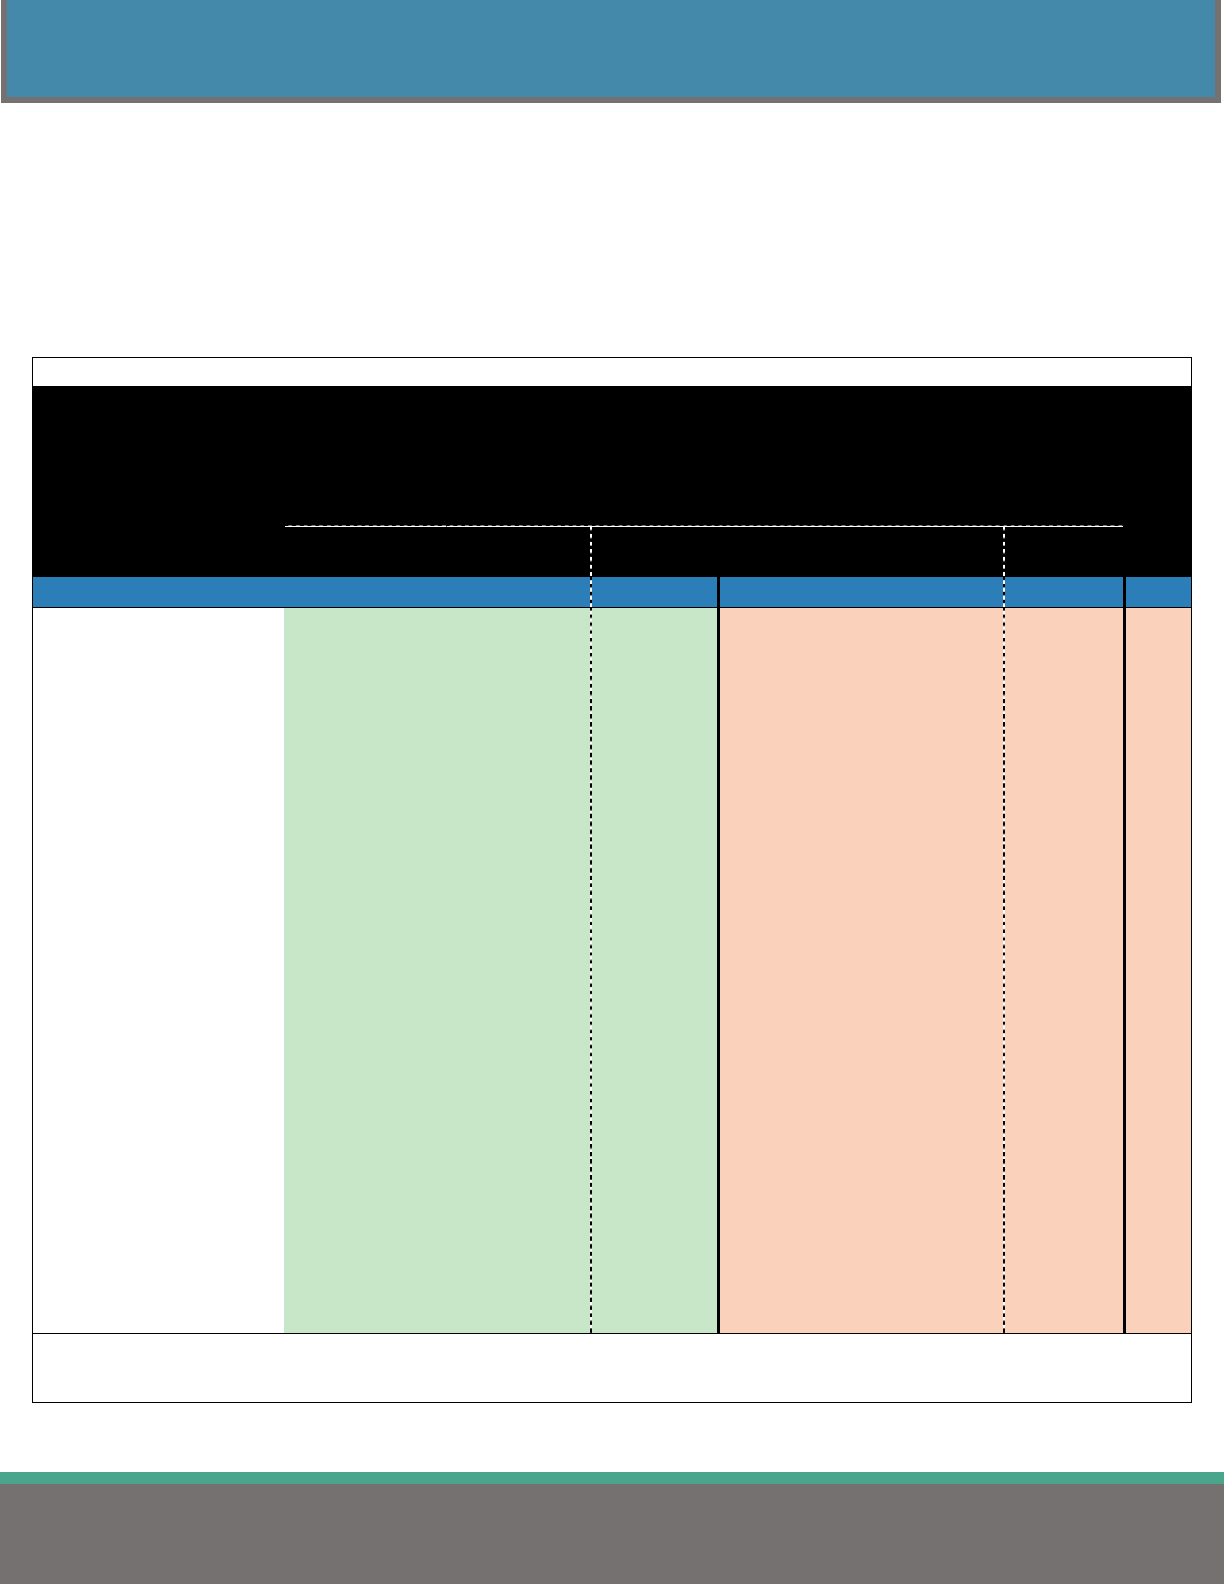
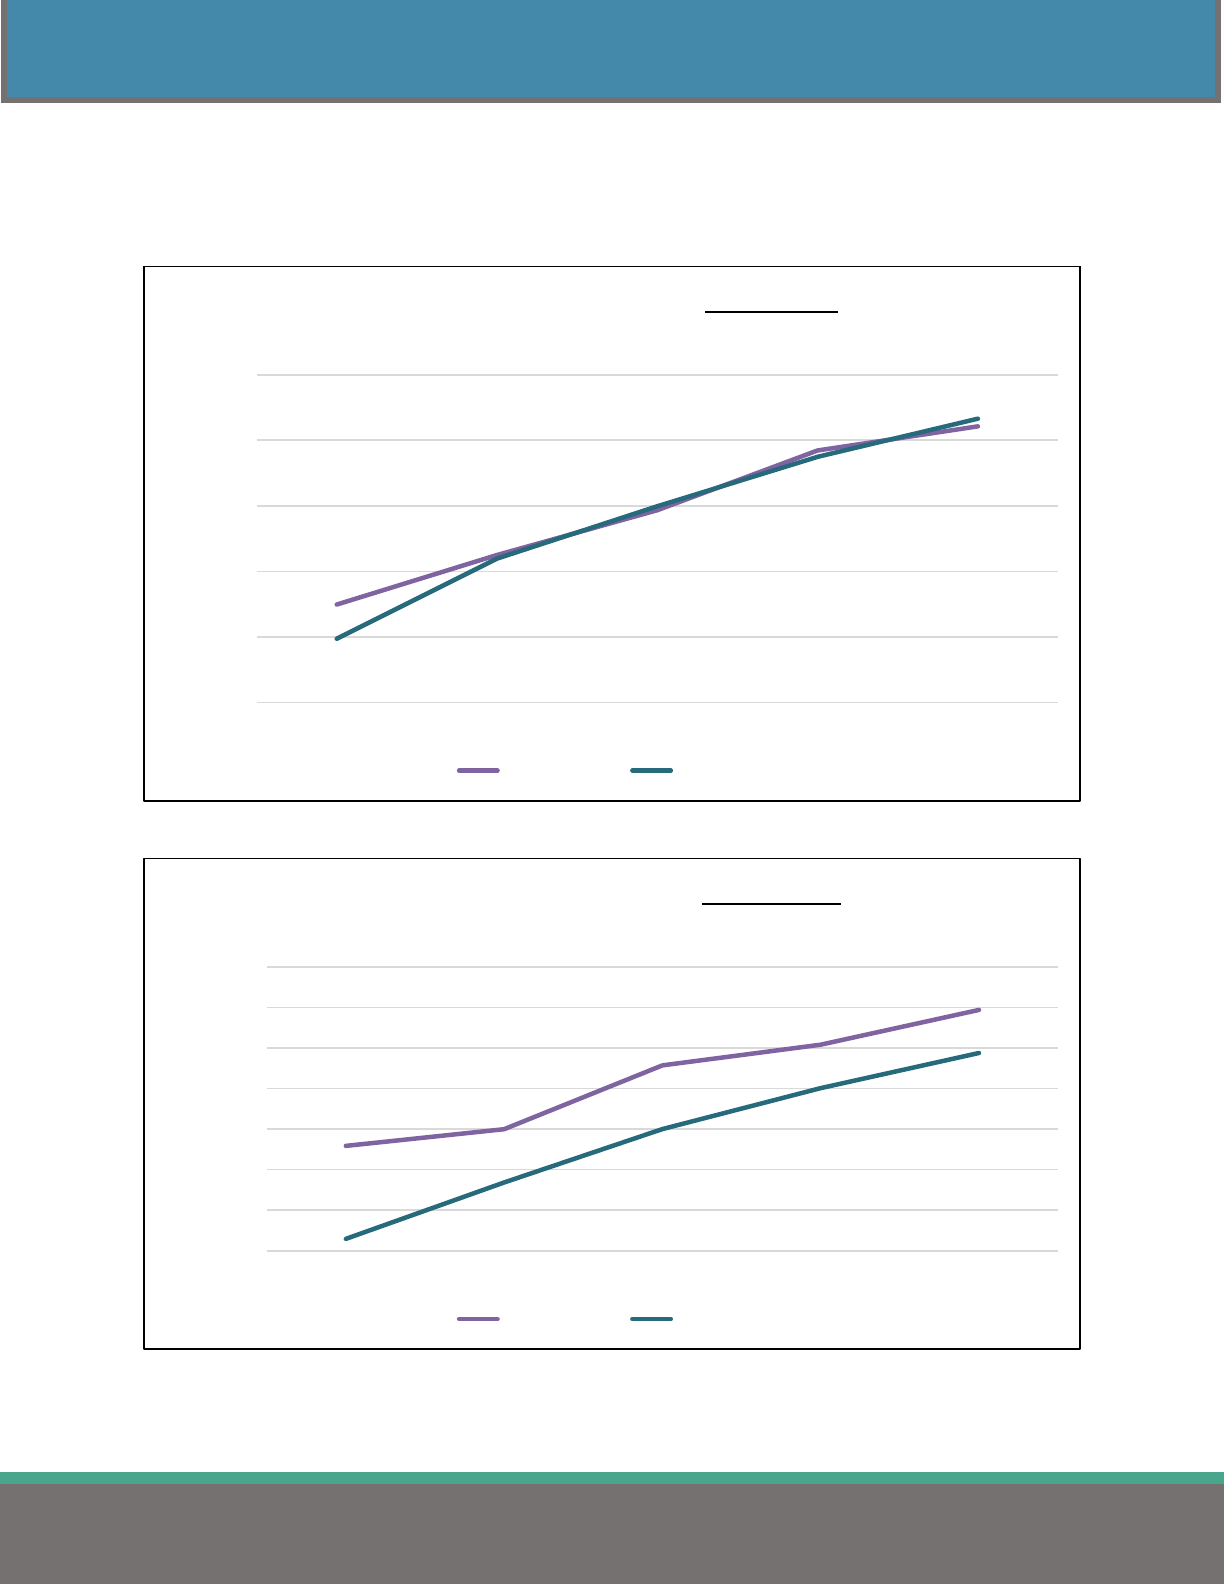
Figure 2 displays the average monthly employee contribution to family premiums in Table 5 over the past
five years. The chart illustrates that monthly family contributions have continued to increase over the last
few years while the employee percent contribution towards the premium remains almost unchanged, as
described in Figure 4 on page 12.
Figure 2
$50
$100
$150
$200
$250
$300
$350
2018 2019 2020 2021 2022
AverageMonthlyEmployeeContribution
TowardsFamilyMedicalPremium
(AllMedicalPlanTypes)
StatewideAverage StateofOhio Counties
Cities Townships SchoolDistricts&ESC
Colleges&Universities
9
2022HEALTHINSURANCEREPORT
MEDICAL INSURANCE – ALL PLAN TYPES
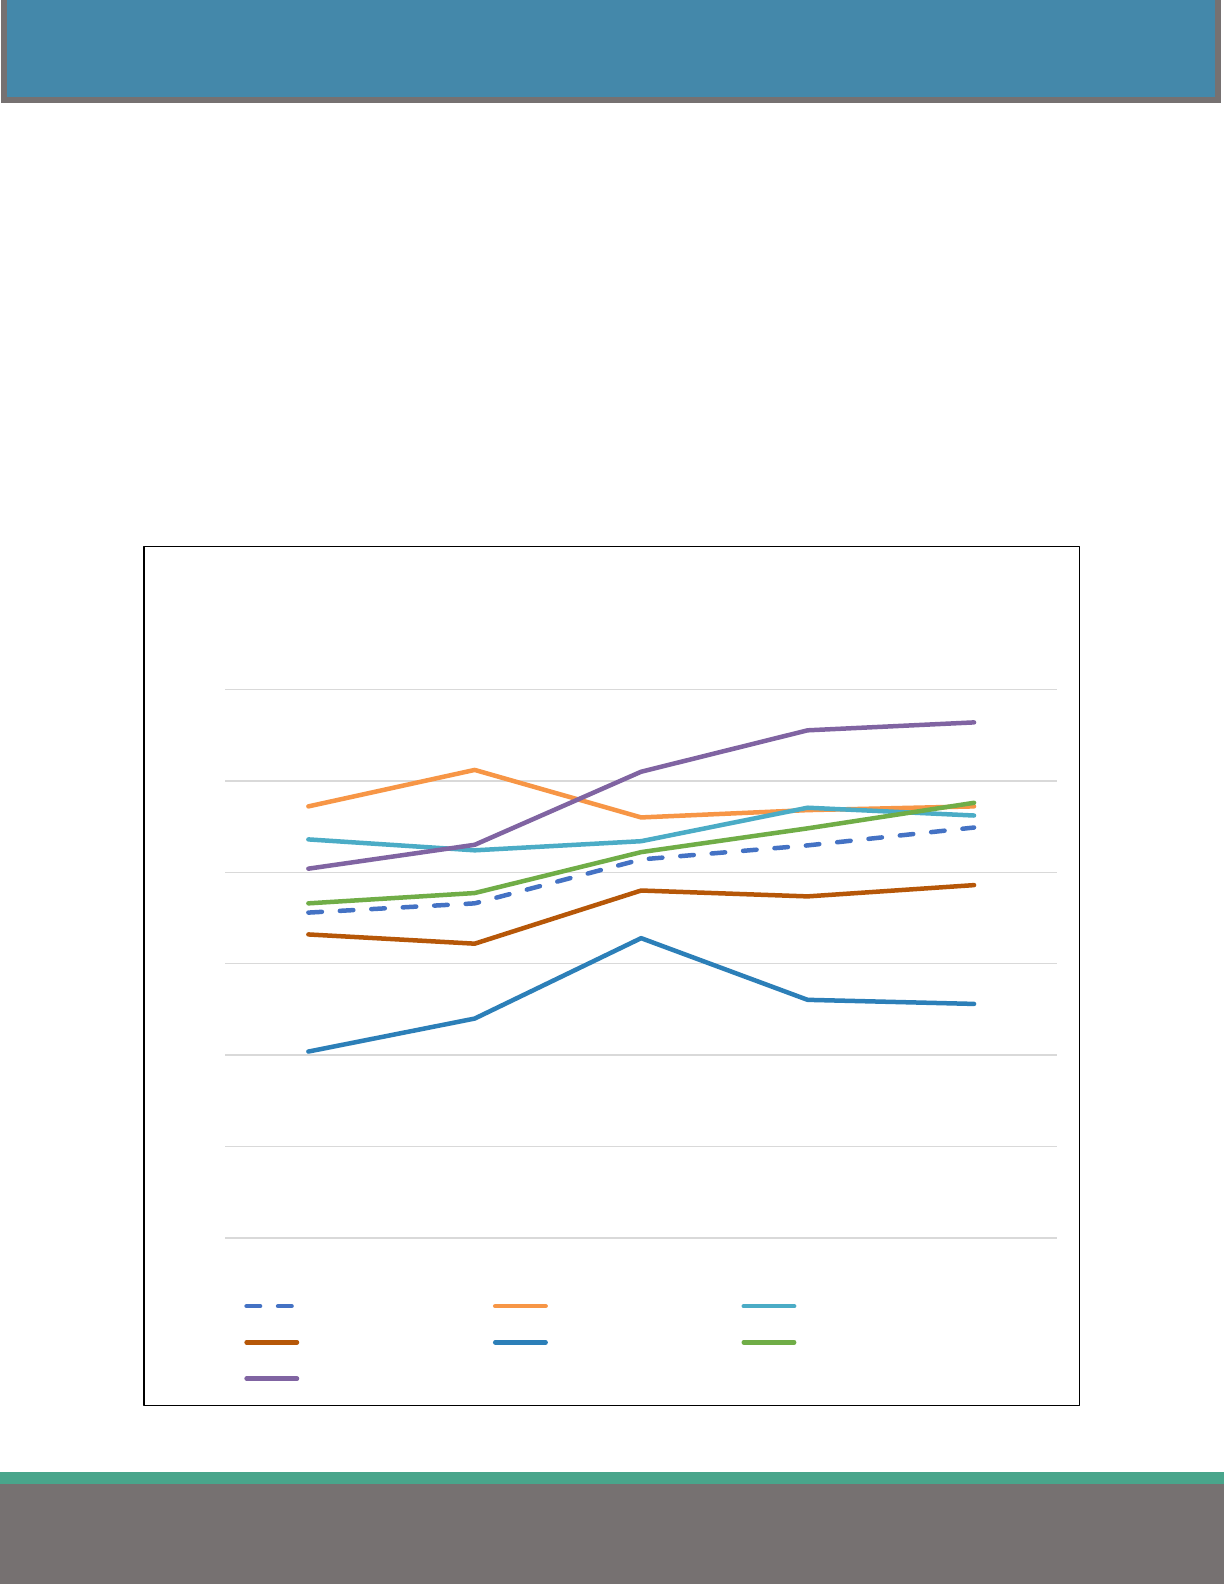
Figure 3 displays the statewide total monthly family premium in Table 5 over the past five years by
jurisdiction.
Figure 3
The statewide average, represented by the dotted line, shows that the family premium increased
by $365.07 or 22.2% over the last five years (2018-2022).
$1,400.00
$1,500.00
$1,600.00
$1,700.00
$1,800.00
$1,900.00
$2,000.00
$2,100.00
$2,200.00
$2,300.00
2018 2019 2020 2021 2022
AverageTotalMonthlyFamilyPremiumbyJurisdiction
(AllMedicalPlanTypes)
Statewide StateofOhio County
City Township SchoolDistricts
College/Universities
10
2022HEALTHINSURANCEREPORT
MEDICAL INSURANCE – ALL PLAN TYPES
Table 6 organizes the same data in Table 5 by region and by the number of employees covered. These
averages include the costs of prescription, dental, and vision coverages when included with the medical
premiums. A breakdown of the regions is on page 61.
Table 6
Average Monthly Employer & Employee Contributions
Towards Medical Premium by Region
(All Medical Plan Types)
Single Family
Comparison Group
Employer
Share
Employee
Share Total
Employer
Share
Employee
Share Total n
STATEWIDE $ 665.31 $ 97.44 $ 762.75 $ 1,733.73 $ 274.48 $ 2,008.21 2,046
REGION
1 - Akron/Canton $ 659.06 $ 90.11 $ 749.17 $ 1,681.06 $ 230.96 $ 1,912.02 245
2 - Cincinnati $ 587.13 $ 99.24 $ 686.37 $ 1,584.27 $ 293.11 $ 1,877.38 225
3 - Cleveland $ 650.51 $ 83.32 $ 733.83 $ 1,710.88 $ 211.65 $ 1,922.53 344
4 - Columbus $ 704.33 $ 113.22 $ 817.55 $ 1,795.20 $ 340.34 $ 2,135.54 361
5 - Dayton $ 669.12 $ 119.99 $ 789.11 $ 1,795.34 $ 353.06 $ 2,148.40 266
6 - Southeast Ohio $ 774.73 $ 101.67 $ 876.40 $ 1,936.10 $ 300.84 $ 2,236.94 167
7 - Toledo $ 631.90 $ 93.29 $ 725.19 $ 1,649.47 $ 255.06 $ 1,904.53 283
8 - Warren/Youngstown $ 669.83 $ 66.49 $ 736.32 $ 1,776.43 $ 177.45 $ 1,953.88 155
EMPLOYEES COVERED
1 - 49 $ 696.14 $ 81.45 $ 777.59 $ 1,874.15 $ 249.44 $ 2,123.59 327
50 - 99 $ 663.93 $ 90.56 $ 754.49 $ 1,768.10 $ 252.74 $ 2,020.84 340
100 - 149 $ 660.71 $ 100.70 $ 761.41 $ 1,709.75 $ 277.22 $ 1,986.97 409
150 - 249 $ 678.91 $ 107.04 $ 785.95 $ 1,732.84 $ 290.32 $ 2,023.16 438
250 - 499 $ 648.93 $ 97.28 $ 746.21 $ 1,669.88 $ 265.45 $ 1,935.33 312
500 - 999 $ 632.58 $ 109.77 $ 742.35 $ 1,619.24 $ 310.35 $ 1,929.59 126
1,000 or more $ 622.31 $ 101.43 $ 723.74 $ 1,621.84 $ 330.90 $ 1,952.74 94
Note: Includes plans where employees contribute $0 to the medical premium.
Note: Includes plans where the medical premium includes the cost of prescription and dental.
Note: n: number of plans.
Compared to the statewide averages, medical premiums in the Southeast Ohio region (Region 6)
average 14.9% higher for single coverage and 11.4% higher for family coverage.
Compared to the statewide averages, medical premiums in the Cincinnati region (Region 2) are
10.0% lower for single coverage and 6.5% lower for family coverage.
When grouped by the number of employees covered, employers with 1,000 or more employees
have the lowest average single premium at $723.74. Employers with 500-999 employees have the
lowest average family premium at $1,929.59.
11
2022HEALTHINSURANCEREPORT
MEDICAL INSURANCE – ALL PLAN TYPES
EMPLOYER & EMPLOYEE SHARE OF MEDICAL PREMIUM
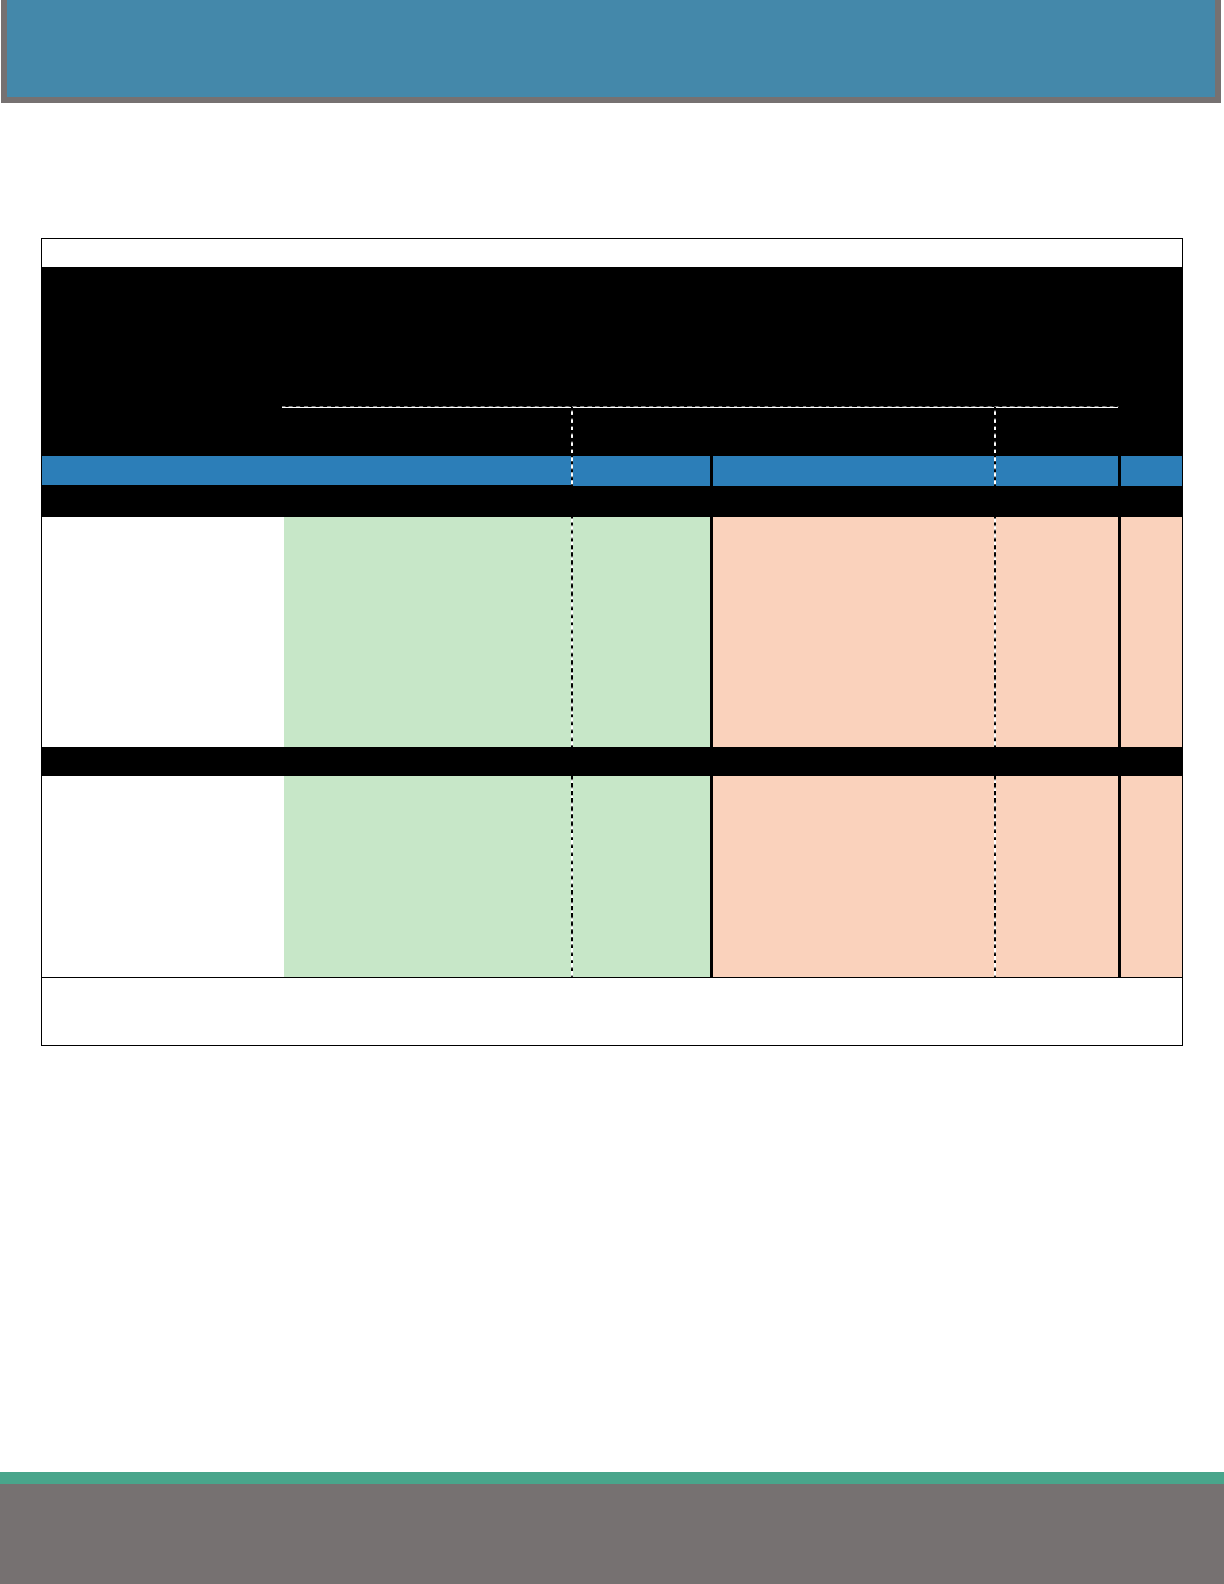
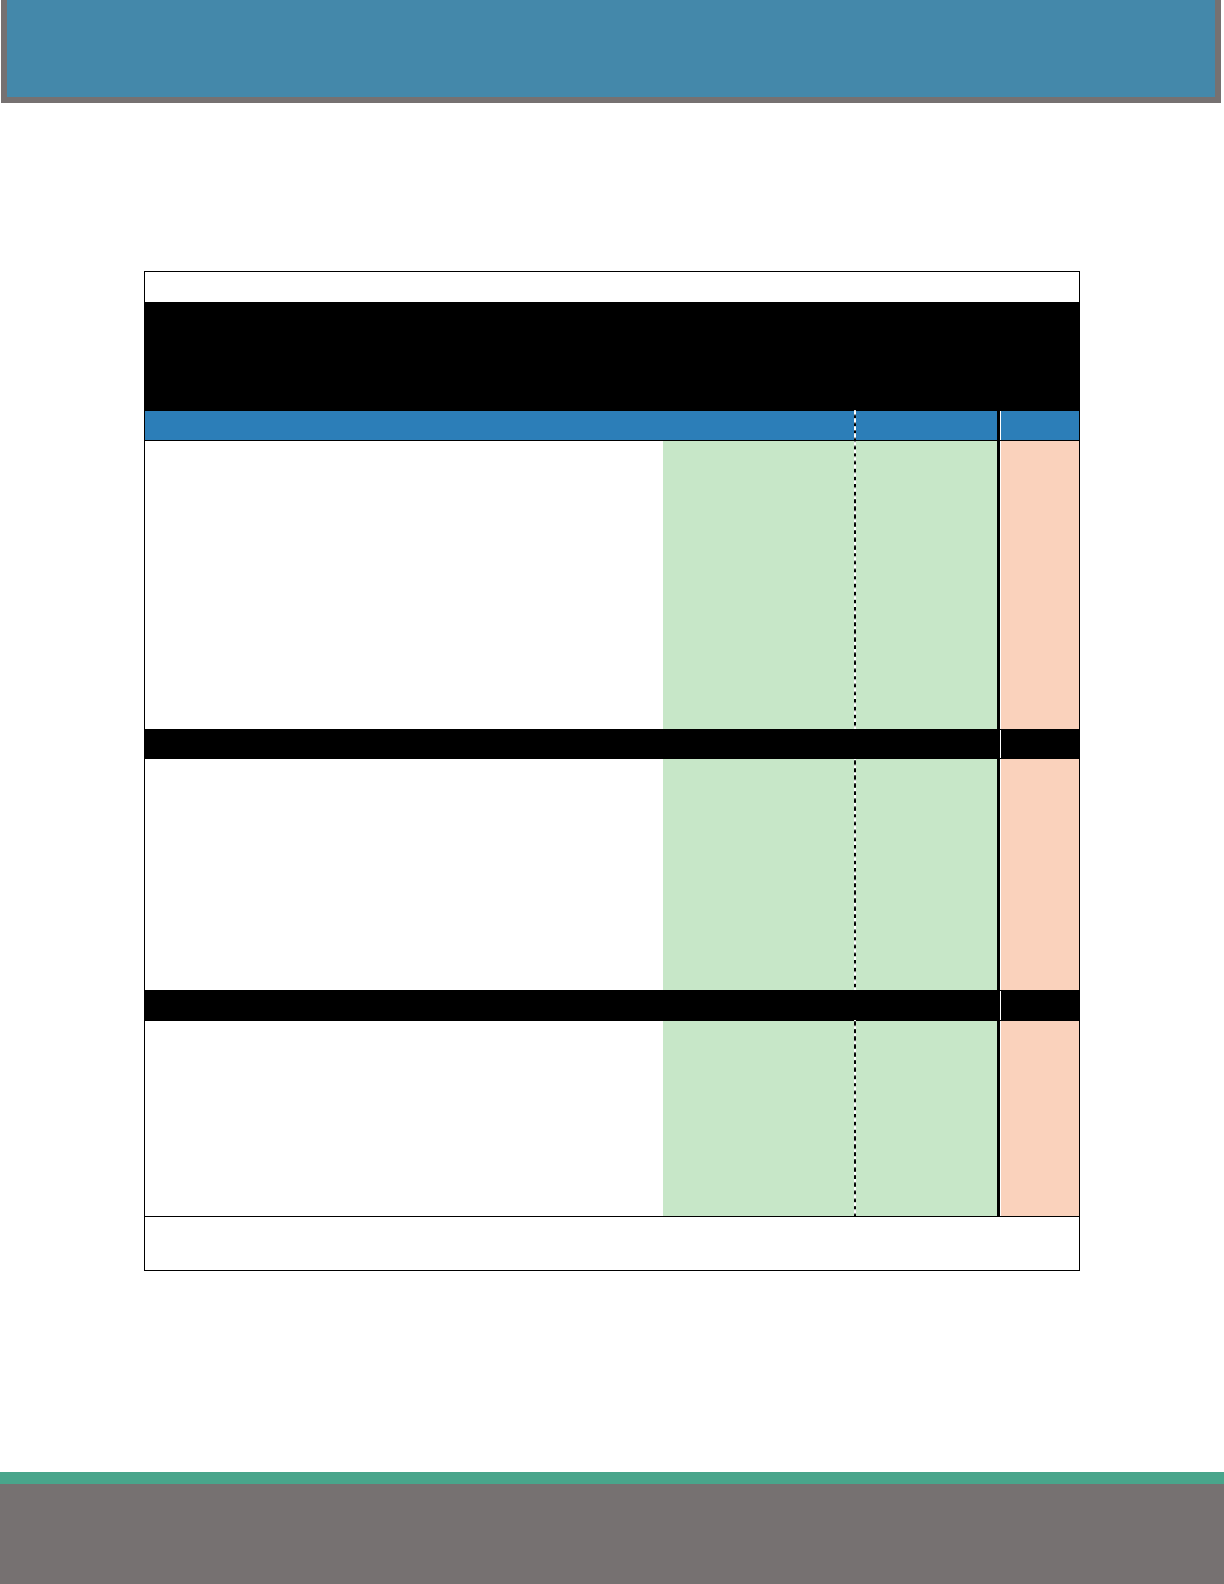
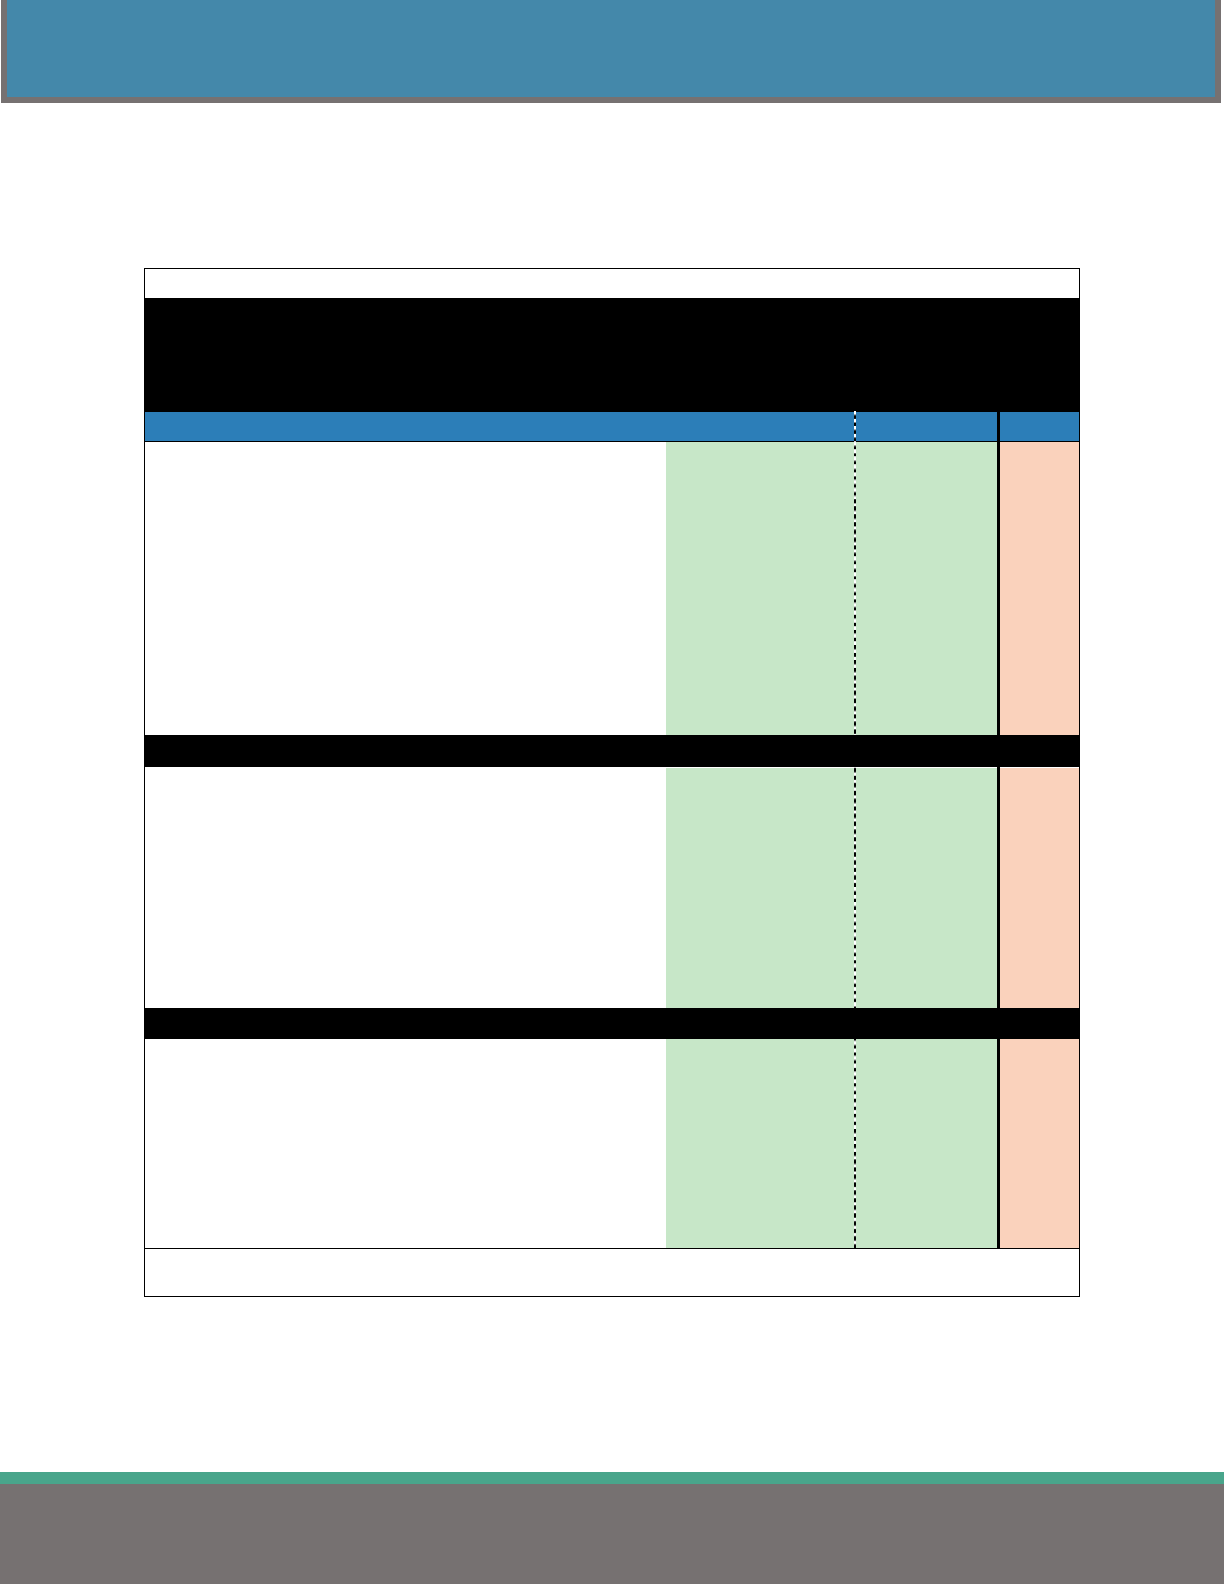
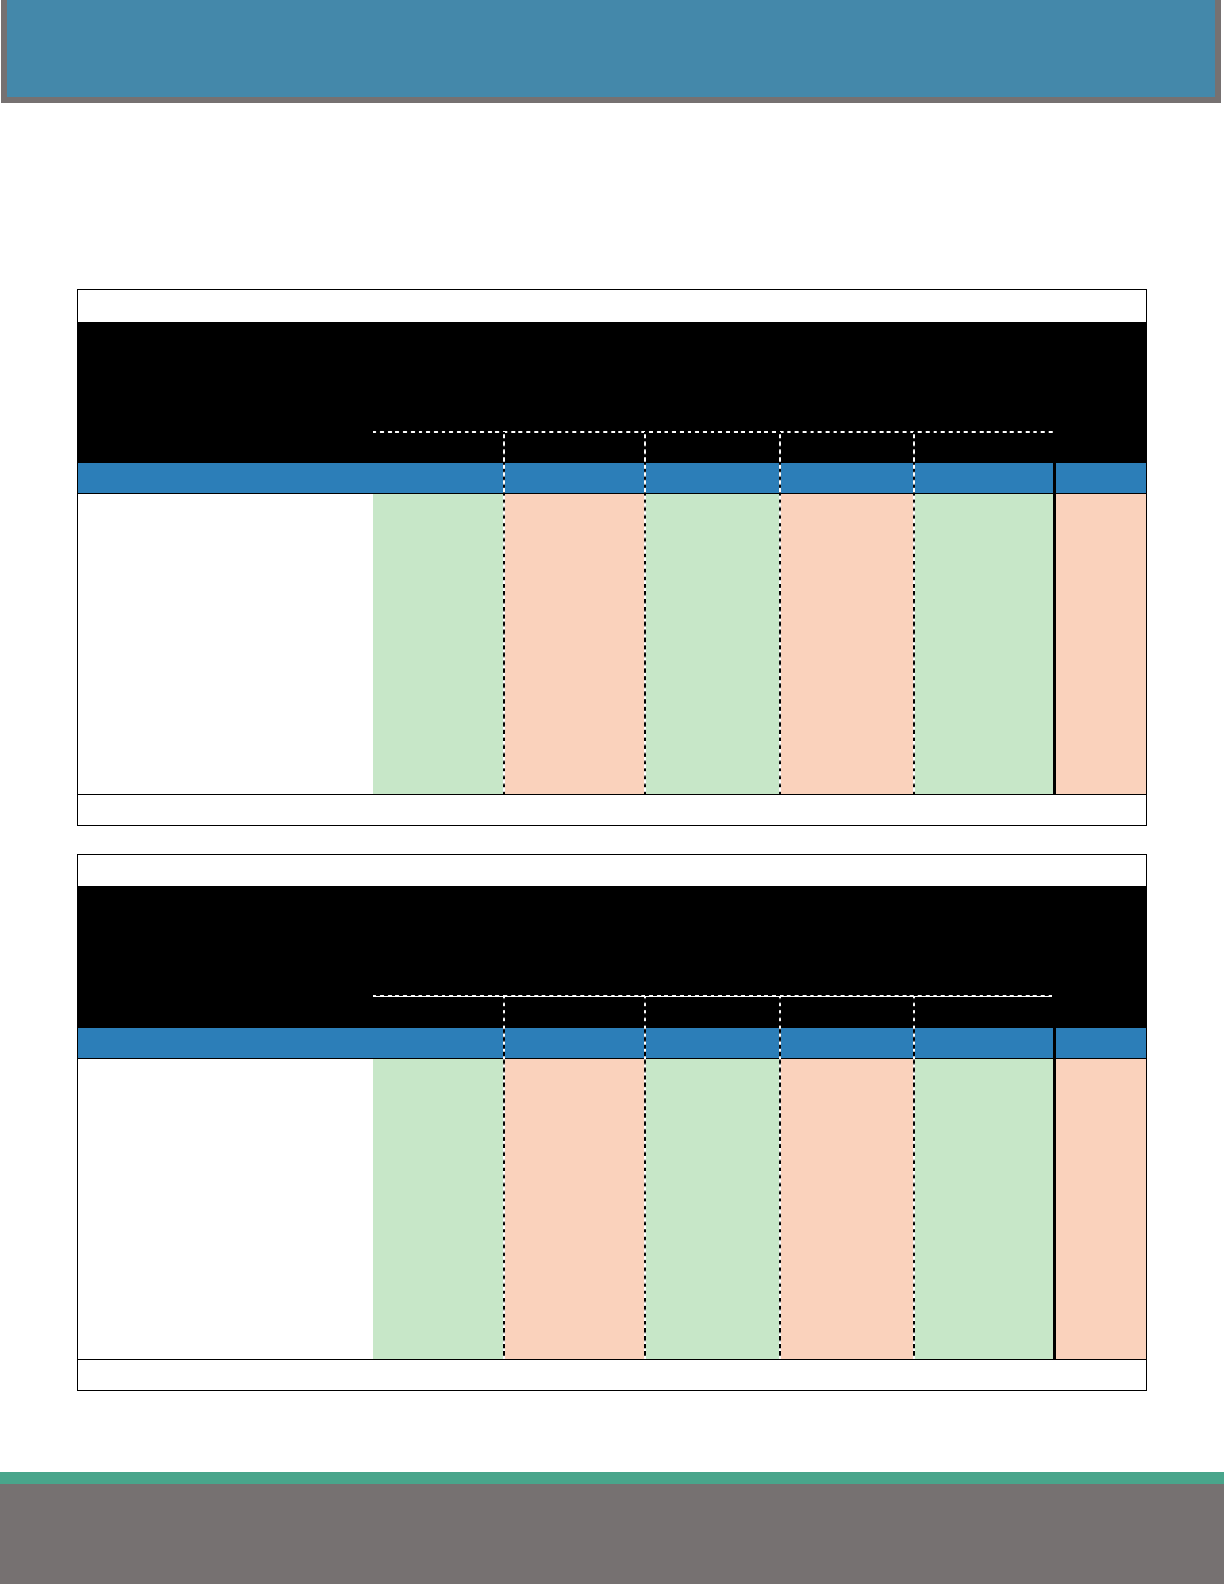
Table 7 displays the employer and employee share of the medical premium for single and family plans by
jurisdiction. This data corresponds with the data displayed in Table 5.
Table 7
Employer & Employee Cost Sharing Percentage
Towards Medical Premium
(All Medical Plan Types)
Single Family
Comparison Group
Employer
Share
Employee
Share
Employer
Share
Employee
Share n
STATEWIDE 87.2% 12.8% 86.3% 13.7% 2,046
State of Ohio 87.5% 12.5% 87.2% 12.8% 2
Counties 87.4% 12.6% 86.4% 13.6% 149
Less than 50,000 87.8% 12.2% 86.2% 13.8% 57
50,000 - 149,999 86.6% 13.4% 86.1% 13.9% 52
150,000 or more 87.7% 12.3% 87.1% 12.9% 40
Cities 88.7% 11.3% 88.5% 11.5% 371
Less than 25,000 89.0% 11.0% 88.7% 11.3% 264
25,000 - 99,999 87.6% 12.4% 87.9% 12.1% 98
100,000 or more 89.2% 10.8% 87.5% 12.5% 9
Townships 92.1% 7.9% 91.5% 8.5% 146
Less than 10,000 93.9% 6.1% 93.1% 6.9% 69
10,000 - 29,999 91.6% 8.4% 91.6% 8.4% 56
30,000 or more 86.9% 13.1% 86.1% 13.9% 21
School Districts* 86.3% 13.7% 85.2% 14.8% 1,204
Less than 1,000 87.5% 12.5% 86.7% 13.3% 329
1,000 - 2,499 86.0% 14.0% 85.2% 14.8% 473
2,500 - 9,999 85.9% 14.1% 84.8% 15.2% 285
10,000 or more 85.9% 14.1% 79.8% 20.2% 32
Educational Svc Centers 85.6% 14.4% 83.4% 16.6% 85
Colleges & Universities 84.9% 15.1% 84.4% 15.6% 78
Fire Districts 87.0% 13.0% 87.5% 12.5% 15
Metro Housing Authorities 86.3% 13.7% 83.2% 16.8% 52
Port Authorities 86.8% 13.2% 86.9% 13.1% 5
Regional Transit Authorities 90.2% 9.8% 87.3% 12.7% 24
Note: Includes plans where employees contribute $0 to the medical premium.
Note: Includes plans where the medical premium includes the cost of prescription and dental.
Note: n: number of plans
On average, employees in Townships pay the lowest percentage towards the single premium at
7.9% and 8.5% towards the family premium. Employees working for Colleges & Universities pay
the highest percentage of the single premium at 15.1% and 15.6% towards the family premium.
12
2022HEALTHINSURANCEREPORT
MEDICAL INSURANCE – ALL PLAN TYPES
Figure 4 displays the statewide average percentages of the employee’s contribution toward the family
medical premium, found in Table 7, over the past five years. While medical premiums continue to rise,
the employee’s share of the premium cost has changed very little. The reported 2022 percent share is
13.7%, which mirrors prior years.
Figure 4
13.5%
13.2%
13.5%
13.4%
13.7%
0.0%
2.0%
4.0%
6.0%
8.0%
10.0%
12.0%
14.0%
16.0%
18.0%
20.0%
2018 2019 2020 2021 2022
StatewideFamilyPremiumEmployeePercentShare
13
2022HEALTHINSURANCEREPORT
MEDICAL INSURANCE – ALL PLAN TYPES
Table 8 is a continuation of Table 7 and breaks down the employer and employee percent share costs by
region and number of employees covered. This data corresponds with the data displayed in Table 6.
Table 8
Employer & Employee Cost Sharing Percentage
Towards Medical Premium by Region
(All Medical Plan Types)
Single Family
Comparison Group
Employer
Share
Employee
Share
Employer
Share
Employee
Share n
STATEWIDE 87.2% 12.8% 86.3% 13.7% 2,046
REGION
1 - Akron/Canton 88.0% 12.0% 87.9% 12.1% 245
2 - Cincinnati 85.5% 14.5% 84.4% 15.6% 225
3 - Cleveland 88.6% 11.4% 89.0% 11.0% 344
4 - Columbus 86.2% 13.8% 84.1% 15.9% 361
5 - Dayton 84.8% 15.2% 83.6% 16.4% 266
6 - Southeast Ohio 88.4% 11.6% 86.6% 13.4% 167
7 - Toledo 87.1% 12.9% 86.6% 13.4% 283
8 - Warren/Youngstown 91.0% 9.0% 90.9% 9.1% 155
EMPLOYEES COVERED
1 - 49 89.5% 10.5% 88.3% 11.7% 327
50 - 99 88.0% 12.0% 87.5% 12.5% 340
100 - 149 86.8% 13.2% 86.0% 14.0% 409
150 - 249 86.4% 13.6% 85.7% 14.3% 438
250 - 499 87.0% 13.0% 86.3% 13.7% 312
500 - 999 85.2% 14.8% 83.9% 16.1% 126
1,000 or more 86.0% 14.0% 83.1% 16.9% 94
Note: Includes plans where employees contribute $0 to the medical premium.
Note: Includes plans where the medical premium includes the cost of prescription and dental.
Note: n: number of plans.
Table 8 shows that the Warren/Youngstown region (Region 8) reported the lowest average
employee percent share at 9.0% for single and 9.1% for family coverage. The Dayton region
(Region 5) reported the highest average employee share at 15.2% for single and 16.4% for family
coverage.
When comparing the number of employees covered, employees working for employers with 1-49
employees had the lowest employee share for single and family plans. Employees choosing a
single plan contributed an average of 10.5%, and employees choosing a family plan contributed
an average of 11.7% towards the medical premium.
14
2022HEALTHINSURANCEREPORT
MEDICAL INSURANCE – ALL PLAN TYPES
TOTAL MONTHLY MEDICAL PREMIUMS BY PLAN TYPE
Table 9 highlights the average costs of single and family plans related to specific plan types.
Table 9
Average Total Monthly Premium by Plan Type
Single Family n
ALL PLANS $ 762.75 $ 2,008.21 2,046
EPO $ 741.22 $ 1,707.43 15
PPO $ 810.14 $ 2,084.92 1,043
POS $ 907.61 $ 2,316.14 22
HMO $ 706.83 $ 1,927.12 28
HDHP $ 708.72 $ 1,921.73 938
Note: Includes plans where employees contribute $0 to the medical premium.
Note: Includes plans where the medical premium includes the cost of prescription and dental.
Note: n: number of plans.
Point of Service (POS) plans are the most expensive single and family plan type reported this
year. The POS monthly premium averaged $907.61 for a single plan and $2,316.14 for a family
plan.
Both single and family average monthly premiums increased in all categories compared to the
2021 report.
15
2022HEALTHINSURANCEREPORT
MEDICAL INSURANCE – ALL PLAN TYPES
FULLY-INSURED VS SELF-INSURED MEDICAL PLANS
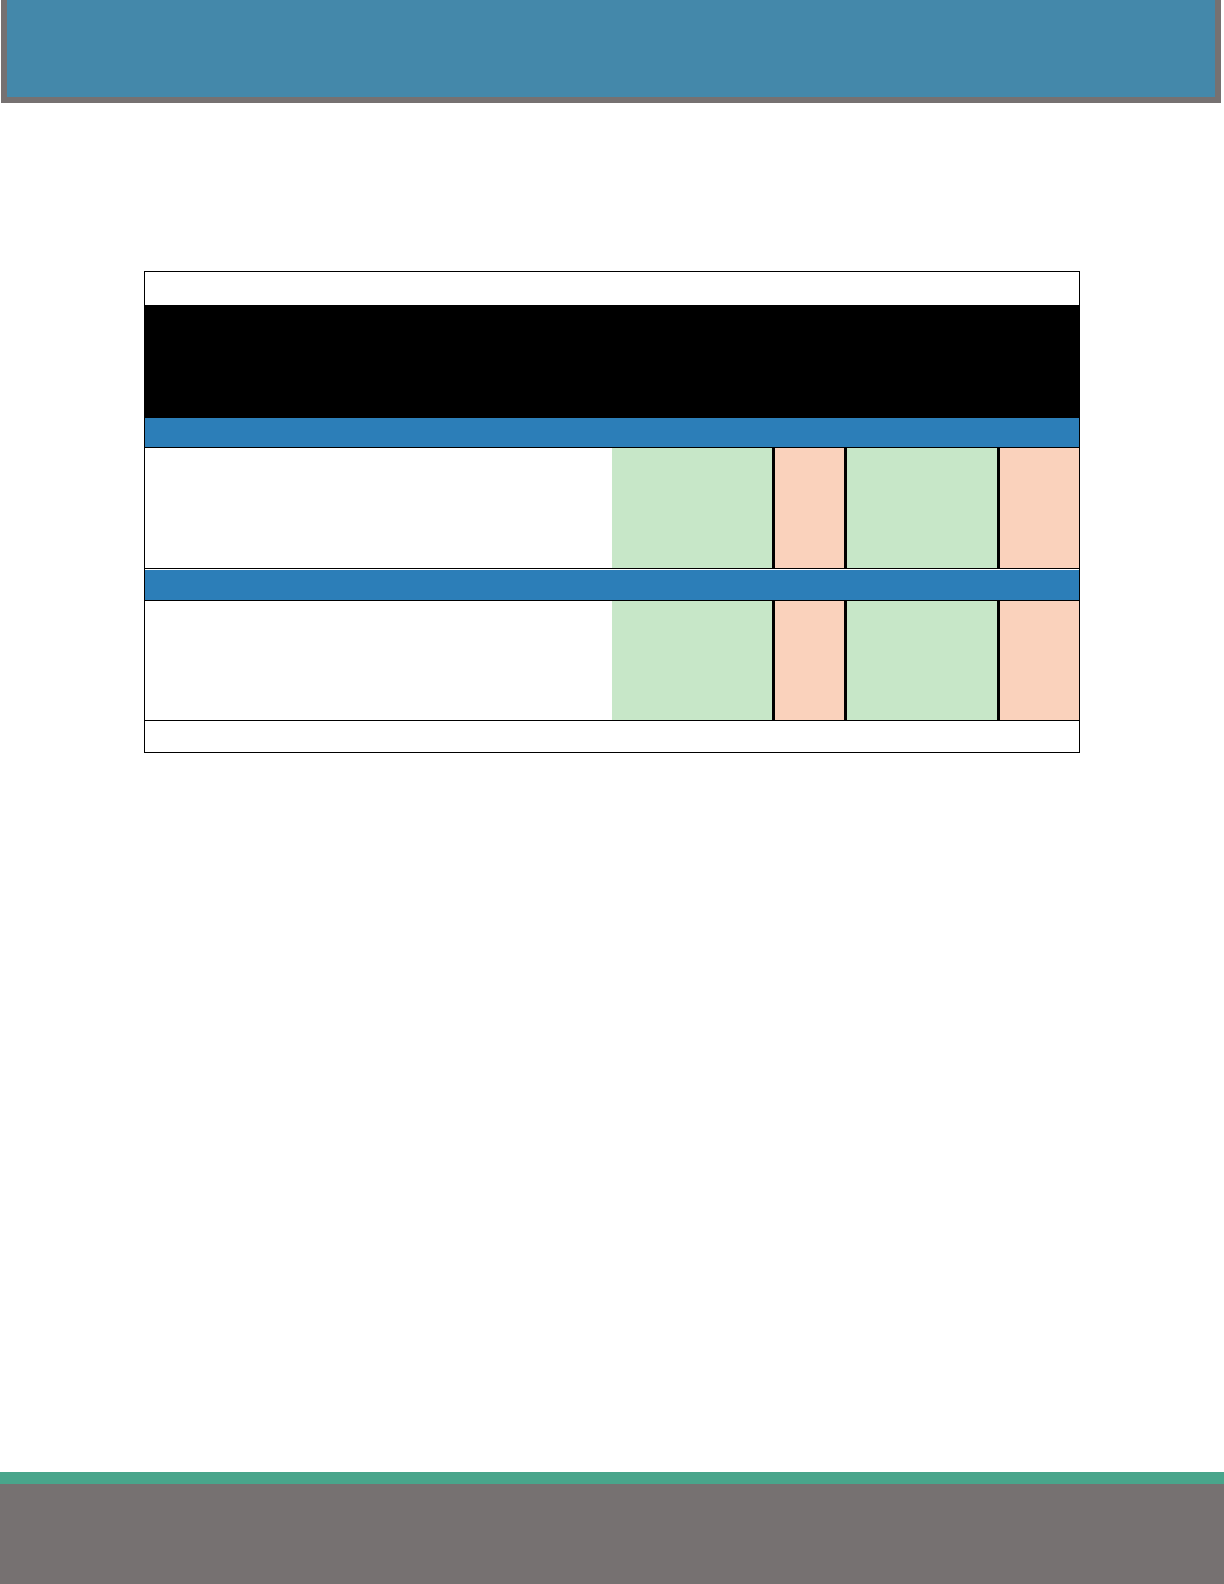
Tables 10 and 11 compare the annual cost of fully-insured medical plans to self-insured plans. The data
presented includes all plan types reported. The primary difference between the fully-insured and self-
insured health insurance plans is who assumes all the risks. With a fully-insured health insurance plan, the
risk falls on the insurance company. In a self-insured health insurance plan, most of the risk falls on the
employer.
Table 10
Statewide Average Annual Cost Per Year by Funding Type
(SINGLE)
Comparison Group 2018 2019 2020 2021 2022 n
Fully-Insured $ 7,747 $ 8,124 $ 8,466 $ 8,922 $ 9,106 437
Self-Insured $ 7,486 $ 8,097 $ 8,496 $ 8,873 $ 9,165 1,609
Note: n: number of plans.
The average annual cost for single plans rose 2.1% for fully-insured plans and 3.3% for self-
insured plans.
Table 11
Statewide Average Annual Cost Per Year by Funding Type
(FAMILY)
Comparison Group 2018 2019 2020 2021 2022 n
Fully-Insured $21,588 $21,997 $23,571 $24,080 $24,940 437
Self-Insured $19,296 $20,685 $22,002 $23,009 $23,878 1,609
Note: n: number of plans.
The average annual cost for family plans rose 3.6% for fully-insured plans and 3.8% for self-
insured plans.
16
2022HEALTHINSURANCEREPORT
MEDICAL INSURANCE – ALL PLAN TYPES
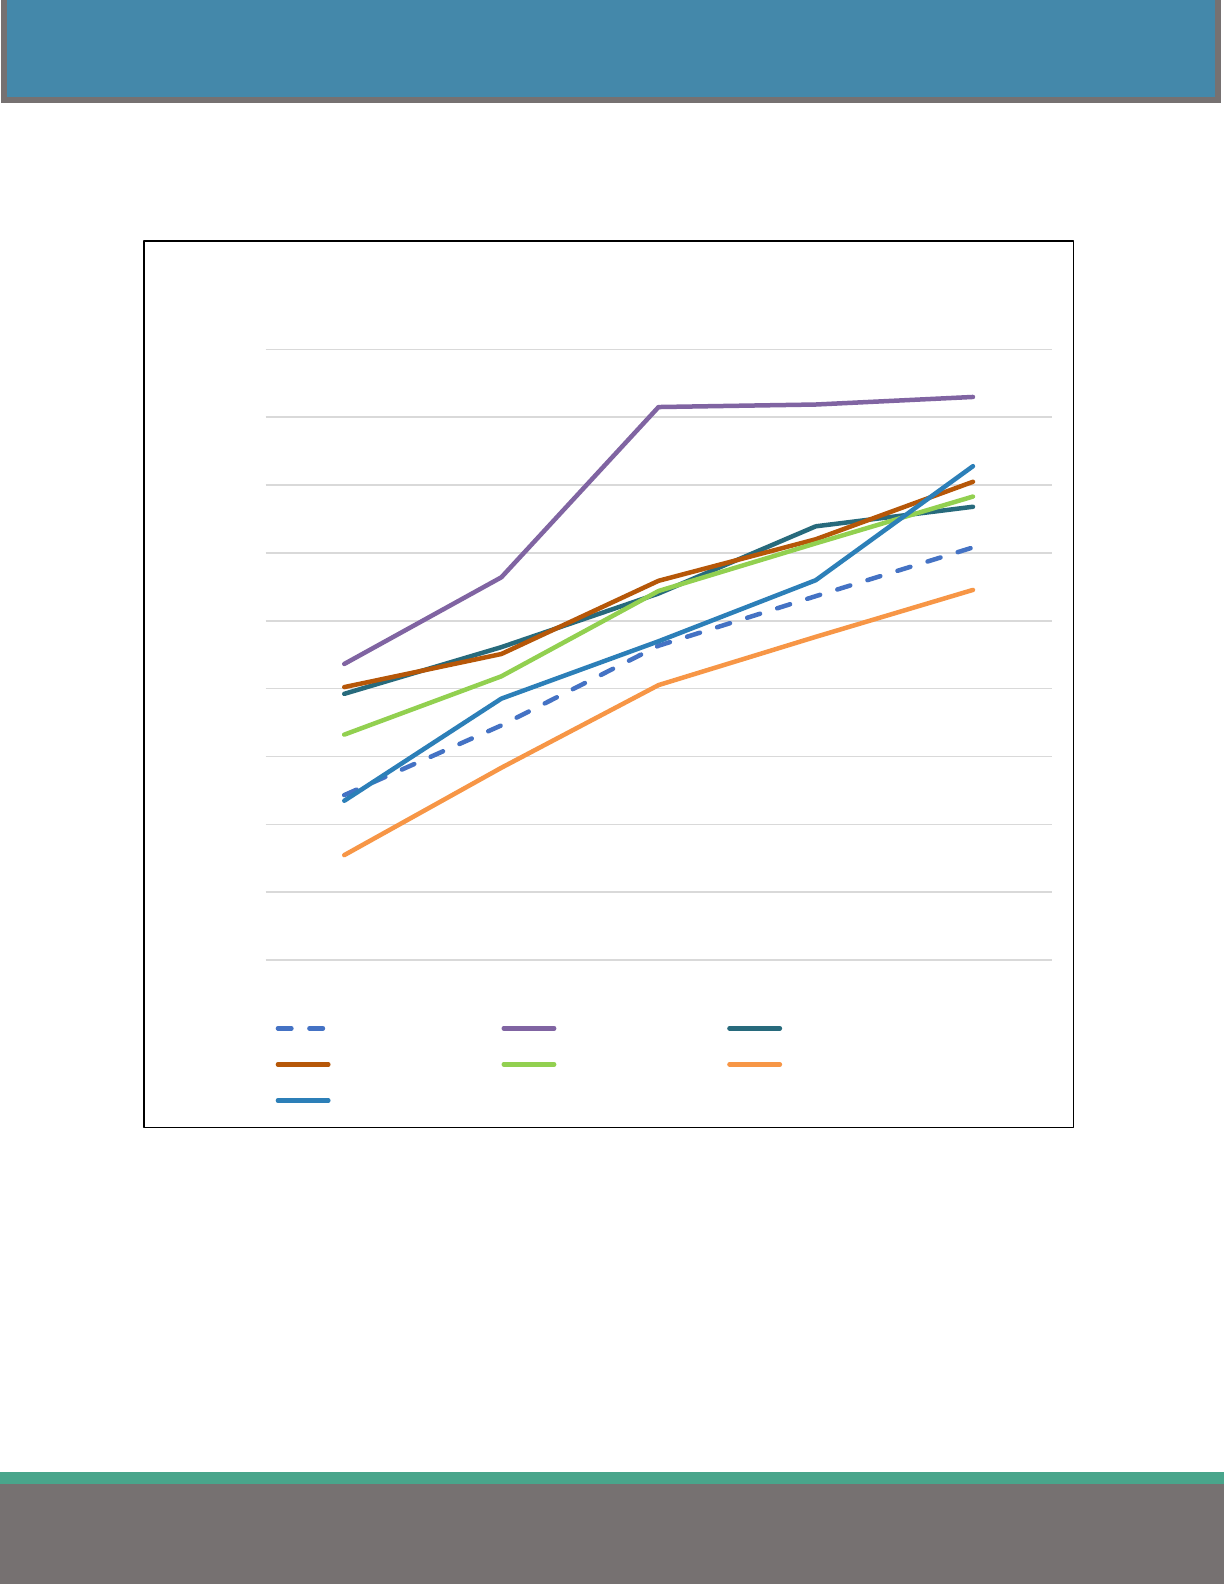
Figures 5 and 6 display the average statewide cost per employee per year for fully-insured and self-
insured medical plans found in Tables 10 and 11 (located on page 15). The graph illustrates that, on
average, self-insured plans cost less per employee, though the gap appears to be closing.
Figure 5
Figure 6
$7,000.00
$7,500.00
$8,000.00
$8,500.00
$9,000.00
$9,500.00
2018 2019 2020 2021 2022
StatewideAverageAnnualCostPerSinglePlanPerYear
byFundingType
Fully‐Insured Self‐Insured
$19,000.00
$20,000.00
$21,000.00
$22,000.00
$23,000.00
$24,000.00
$25,000.00
$26,000.00
2018 2019 2020 2021 2022
StatewideAverageAnnualCostPerFamilyPlanPerYear
byFundingType
Fully‐Insured Self‐Insured
17
2022HEALTHINSURANCEREPORT
MEDICAL INSURANCE – ALL PLAN TYPES
NETWORK DEDUCTIBLES
Table 12 shows the average deductibles for jurisdictions, regions, and the number of employees covered.
The rising number of High Deductible Health Plans significantly impacts the average deductible.
Table 12
Average In-Network Deductible Amount
(All Plan Types)
Comparison Group Single Family n
STATEWIDE $ 1,651 $ 3,240 2,046
State of Ohio $ 1,200 $ 2,400 2
Counties $ 1,285 $ 2,516 149
Cities $ 1,612 $ 3,260 371
Townships $ 2,386 $ 4,830 146
School Districts & ESCs $ 1,582 $ 3,087 1,204
Colleges & Universities $ 1,749 $ 3,084 78
Fire Districts $ 3,683 $ 7,367 15
Metro Housing Authorities $ 2,162 $ 4,130 52
Port Authorities $ 1,840 $ 3,680 5
Regional Transit Authorities $ 846 $ 1,713 24
REGION
1 - Akron/Canton $ 1,031 $ 1,924 245
2 - Cincinnati $ 2,048 $ 4,084 225
3 - Cleveland $ 1,401 $ 2,696 344
4 - Columbus $ 1,937 $ 3,857 361
5 - Dayton $ 1,947 $ 3,898 266
6 - Southeast Ohio $ 1,610 $ 3,231 167
7 - Toledo $ 1,858 $ 3,541 283
8 - Warren/Youngstown $ 1,085 $ 2,155 155
EMPLOYEES COVERED
1 - 49 $ 2,141 $ 4,286 327
50 - 99 $ 1,655 $ 3,277 340
100 - 149 $ 1,632 $ 3,208 409
150 - 249 $ 1,582 $ 3,061 438
250 - 499 $ 1,429 $ 2,731 312
500 - 999 $ 1,590 $ 3,156 126
1,000 or more $ 1,151 $ 2,280 94
Note: Average deductible amounts include plans where employees contribute $0 to the annual deductible.
Note: n: number of plans.
Fire Districts have the highest reported average deductible for both single and family plans in-
network. Regional Transit Authorities have the lowest in-network deductible in both categories.
18
2022HEALTHINSURANCEREPORT
MEDICAL INSURANCE – ALL PLAN TYPES
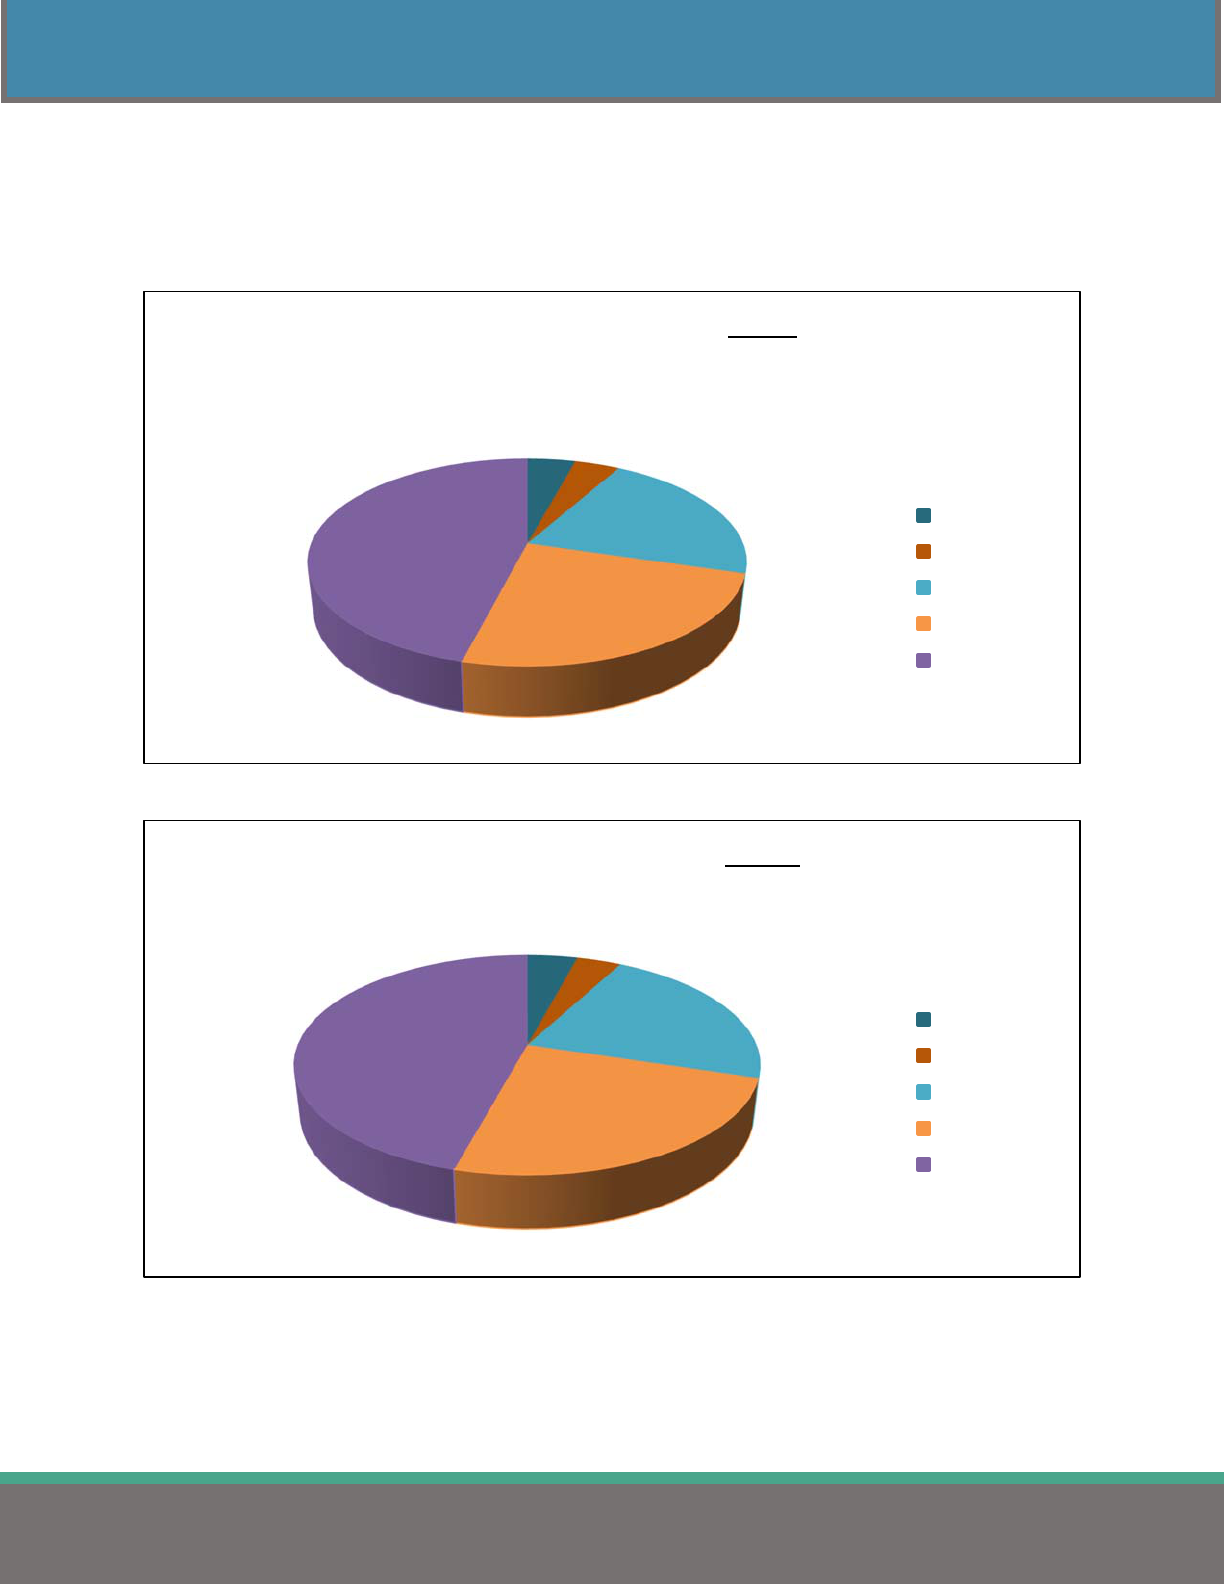
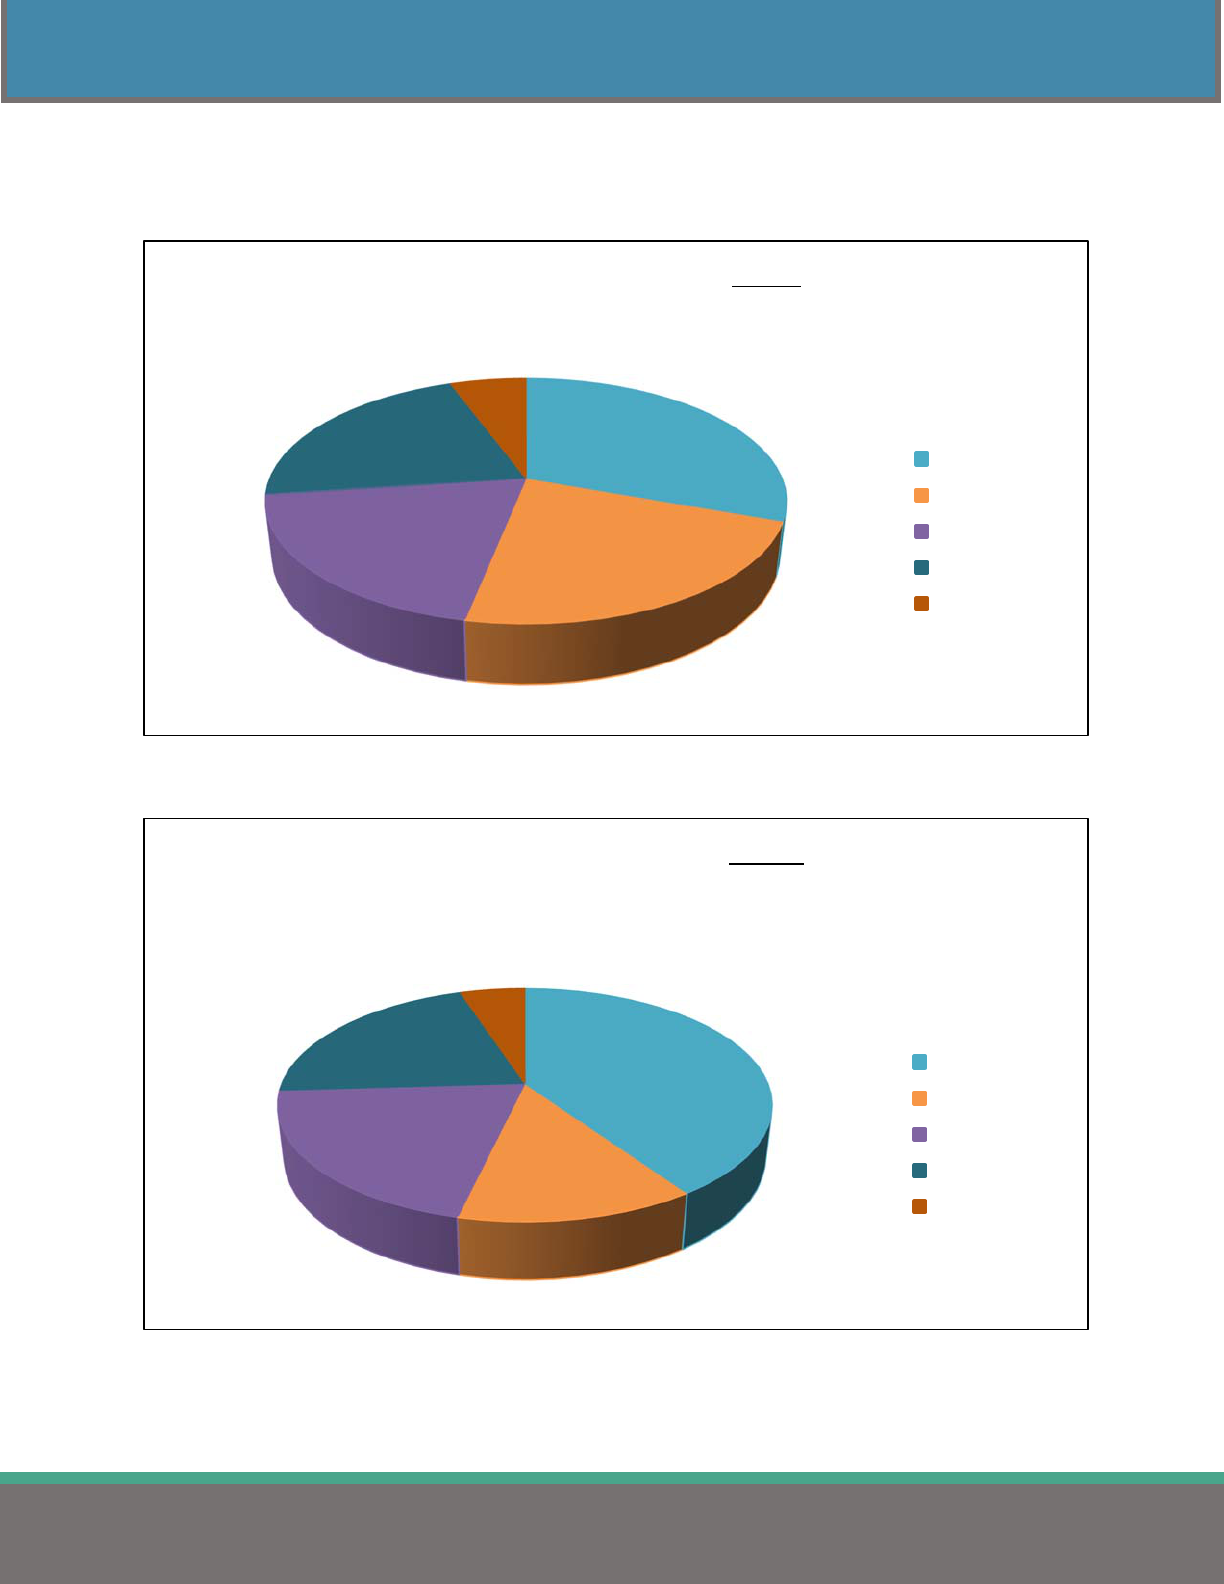
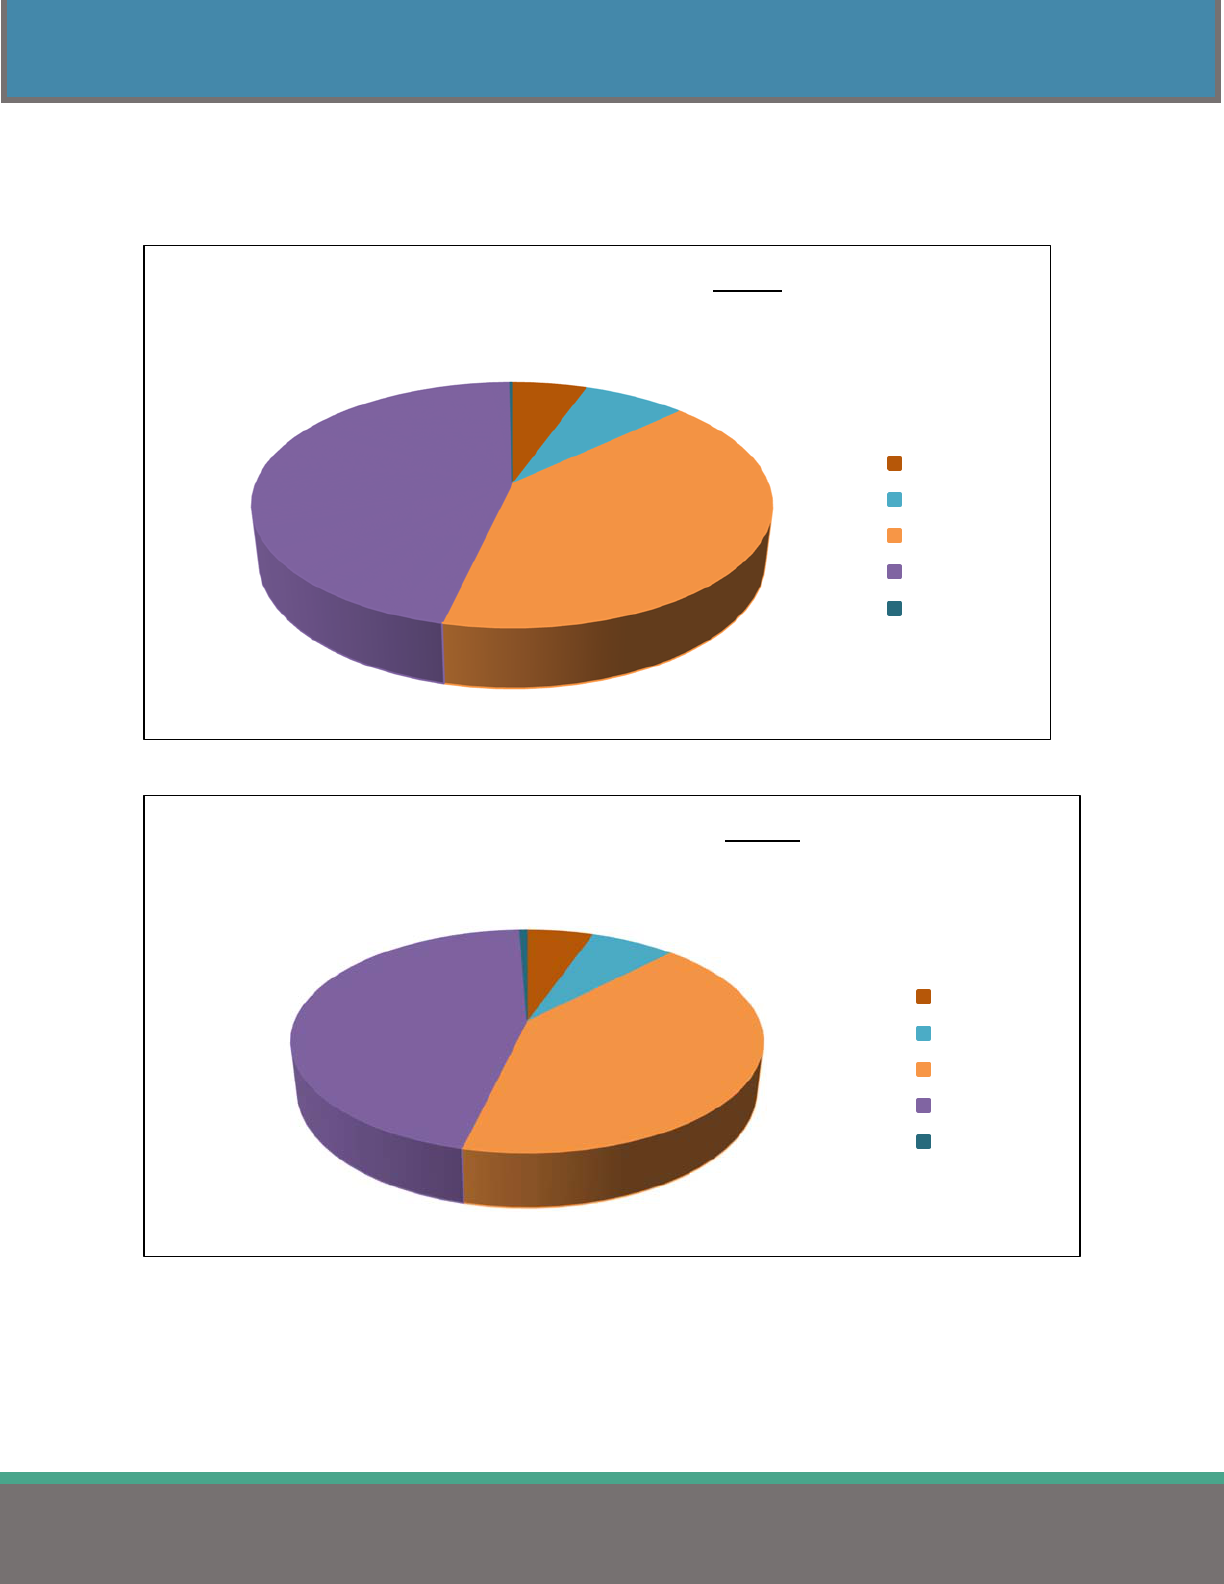
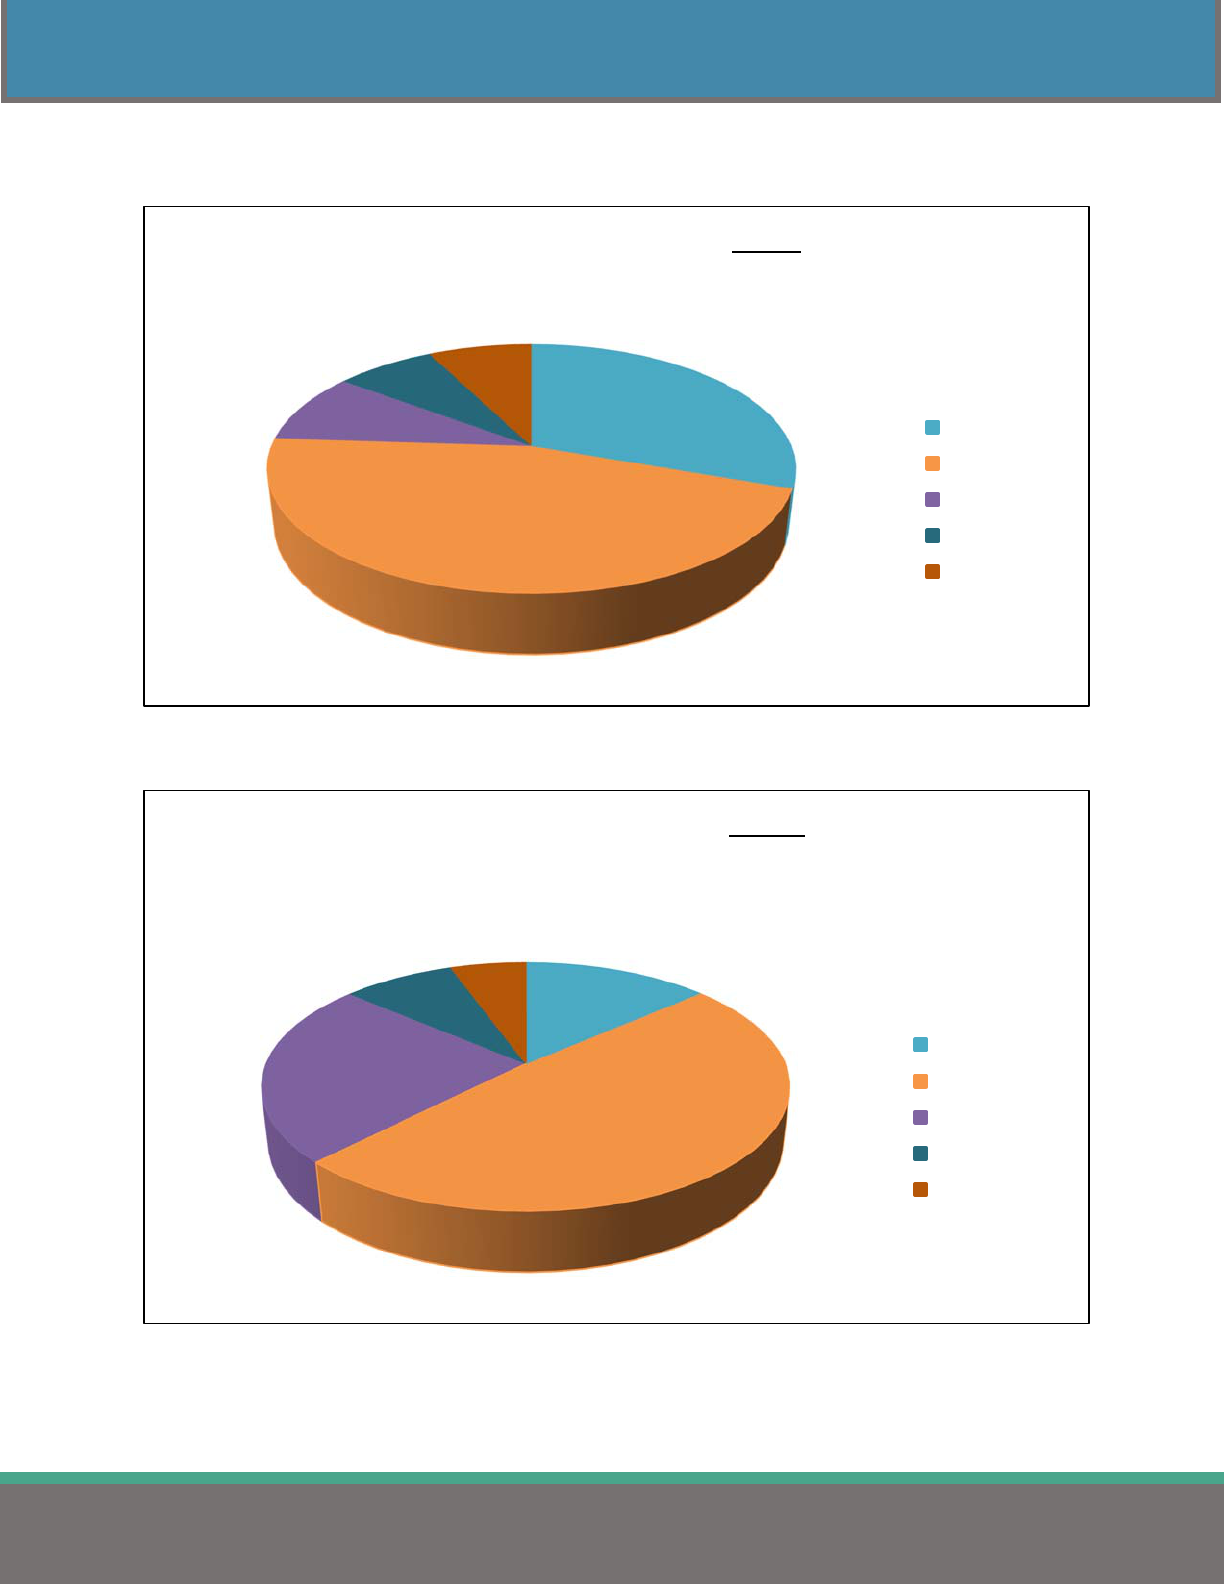
Figures 7 and 8 show the percent of plans in each deductible category for single and family coverage
displayed in Table 12. Each chart's highest category represents those plans eligible for a Health Savings
Account (HSA). Deductibles must be at least $1,400 for single and $2,800 for family coverage to qualify
for an HSA.
Figure 7
Figure 8
4.2%
3.9%
21.5%
24.4%
46.0%
DeductibleCategoriesforSingle
In‐NetworkMedicalCoverage
$0
$1‐$124
$125‐$499
$500‐$1,399
$1,400ormore
4.1%
3.7%
22.0%
24.4%
45.8%
DeductibleCategoriesforFamily
In‐NetworkMedicalCoverage
$0
$1‐$249
$250‐$899
$900‐$2,799
$2,800ormore
19
2022HEALTHINSURANCEREPORT
MEDICAL INSURANCE – ALL PLAN TYPES
NON-NETWORK DEDUCTIBLES
Table 13 shows the average non-network deductibles for jurisdictions, regions, and the number of
employees covered.
Table 13
Average Non-Network Deductible Amount
(All Plan Types)
Comparison Group Single Family n
STATEWIDE $ 3,151 $ 6,136 2,046
State of Ohio $ 2,400 $ 4,800 2
Counties $ 2,596 $ 5,119 149
Cities $ 3,565 $ 7,048 371
Townships $ 5,516 $ 10,725 146
School Districts & ESCs $ 2,647 $ 5,141 1,204
Colleges & Universities $ 3,703 $ 6,926 78
Fire Districts $ 9,517 $ 18,033 15
Metro Housing Authorities $ 5,099 $ 9,890 52
Port Authorities $ 3,938 $ 7,875 5
Regional Transit Authorities $ 1,957 $ 3,939 24
REGION
1 - Akron/Canton $ 2,165 $ 4,018 245
2 - Cincinnati $ 4,036 $ 7,900 225
3 - Cleveland $ 2,650 $ 4,988 344
4 - Columbus $ 3,461 $ 6,743 361
5 - Dayton $ 3,939 $ 7,738 266
6 - Southeast Ohio $ 3,265 $ 6,628 167
7 - Toledo $ 3,138 $ 6,142 283
8 - Warren/Youngstown $ 2,387 $ 4,749 155
EMPLOYEES COVERED
1 - 49 $ 4,688 $ 9,053 327
50 - 99 $ 3,488 $ 7,002 340
100 - 149 $ 2,821 $ 5,431 409
150 - 249 $ 2,680 $ 5,210 438
250 - 499 $ 2,629 $ 4,972 312
500 - 999 $ 2,966 $ 5,917 126
1,000 or more $ 2,100 $ 4,254 94
Note: Average deductible amounts include plans where employees contribute $0 to the annual deductible.
Note: n: number of plans.
20
2022HEALTHINSURANCEREPORT
MEDICAL INSURANCE – ALL PLAN TYPES
Figures 9 and 10 show the percent of plans in each non-network deductible category for single and family
coverage displayed in Table 13.
Figure 9
Figure 10
30.5%
22.6%
19.7%
21.6%
5.6%
DeductibleCategoriesforSingle
Non‐NetworkMedicalCoverage
$0‐$999
$1,000‐$2,499
$2,500‐$4,999
$5,000‐$9,999
$10,000ormore
40.4%
13.2%
20.4%
20.9%
5.1%
DeductibleCategoriesforFamily
Non‐NetworkMedicalCoverage
$0‐$2,499
$2,500‐$4,999
$5,000‐$9,999
$10,000‐$19,999
$20,000ormore
21
2022HEALTHINSURANCEREPORT
MEDICAL INSURANCE – ALL PLAN TYPES
COPAY AND COINSURANCE
Table 14 shows the breakdown of the 2,046 medical plans submitted by the average copay and
coinsurance amounts for network and non-network plans covered by the employee.
Table 14
Statewide Average Medical Copay & Coinsurance Amounts
(Covered by Employee)
Network n Non-Network n
COPAY
Office Visit $ 17.94 1,400 $ 22.09 313
Emergency Room $ 134.15 1,393 $ 139.34 1,035
Urgent Care $ 36.61 1,353 $ 33.94 423
Hospital Stay - Admitted $ 42.70 432 $ 49.59 181
COINSURANCE
Office Visit 23.2% 916 38.6% 1,640
Emergency Room 27.0% 888 32.3% 1,032
Urgent Care 27.2% 791 37.4% 1,529
Hospital Stay - Admitted 24.2% 1,505 38.3% 1,650
Note: n: number of plans.
Three hundred forty-one plans (16.7%) indicated that their office visit copay amount is $20, and
256 plans (12.5%) indicated their office visit copay amount is $25, the two most reported copay
dollar amounts.
Two hundred sixty-five plans (13.0%) indicated that their emergency room copay amount is
$100, the most reported copay. Eight hundred forty-nine plans (41.5%) indicated that their
emergency room copay is between $100 and $300.
Two hundred twenty-five plans (11.0%) indicated that their urgent care copay amount is $50, the
most reported copay.
22
2022HEALTHINSURANCEREPORT
MEDICAL INSURANCE – ALL PLAN TYPES
The two tables below show the employee’s average co-insurance percentage of the medical claim for
network and non-network claims when admitted into the hospital. The employee would typically be
responsible for this percentage of the medical claim (medical bill); once the employee reaches the
deductible. The employee would pay this percentage on all claims until they reached the out-of-pocket
maximum.
Table 15
Co-Insurance Categories for In-Network Medical Coverage by Jurisdiction
(All Plan Types)
Employee’s Co-Insurance Percentage
Comparison Group 0% 1-10% 11-19% 20% >20% n
STATEWIDE 11.4% 29.2% 1.7% 39.9% 17.8% 2,046
State of Ohio 0.0% 0.0% 0.0% 100.0% 0.0% 2
Counties 6.6% 16.4% 1.6% 50.8% 24.6% 149
Cities 16.3% 24.9% 1.2% 40.0% 17.6% 371
Townships 21.8% 14.1% 0.0% 39.7% 24.4% 146
School Districts & ESCs 10.2% 34.7% 1.4% 38.1% 15.6% 1,204
Colleges & Universities 3.2% 23.8% 9.5% 42.9% 20.6% 78
Fire Districts 37.5% 0.0% 0.0% 25.0% 37.5% 15
Metro Housing Authorities 13.5% 13.5% 0.0% 45.9% 27.1% 52
Port Authorities 0.0% 50.0% 0.0% 0.0% 50.0% 5
Regional Transit Authorities 5.9% 23.5% 5.9% 41.2% 23.5% 24
Note: n: number of plans.
Table 16
Co-Insurance Categories for Non-Network Medical Coverage by Jurisdiction
(All Plan Types)
Employee’s Co-Insurance Percentage
Comparison Group 0-19% 20% 21-30% 31-40% >40% n
STATEWIDE 1.8% 15.4% 26.9% 31.7% 24.2% 2,046
State of Ohio 0.0% 0.0% 0.0% 100.0% 0.0% 2
Counties 0.8% 5.6% 14.5% 50.0% 29.1% 149
Cities 0.4% 17.9% 30.8% 23.3% 27.6% 371
Townships 1.1% 14.7% 18.9% 27.4% 37.9% 146
School Districts & ESCs 2.4% 16.9% 28.2% 32.4% 20.1% 1,204
Colleges & Universities 1.5% 6.1% 30.3% 25.8% 36.3% 78
Fire Districts 0.0% 10.0% 50.0% 0.0% 40.0% 15
Metro Housing Authorities 0.0% 14.6% 17.1% 34.1% 34.2% 52
Port Authorities 0.0% 25.0% 25.0% 0.0% 50.0% 5
Regional Transit Authorities 5.6% 0.0% 22.2% 50.0% 22.2% 24
Note: n: number of plans.
23
2022HEALTHINSURANCEREPORT
MEDICAL INSURANCE – ALL PLAN TYPES
OUT-OF-POCKET MAXIMUMS
Tables 17 and 18 display the average, minimum, and maximum out-of-pocket maximums for single and
family medical coverage for all plan types reported.
Table 17
Average In-Network Out-of-Pocket Maximums
(All Plan Types)
Single Family
Comparison Group Average Minimum Maximum Average Minimum Maximum n
STATEWIDE $ 3,267 $ 0 $ 10,000 $ 6,493 $ 0 $ 21,000 2,046
State of Ohio $ 3,000 $ 2,500 $ 3,500 $ 6,000 $ 5,000 $ 7,000 2
Counties $ 3,284 $ 400 $ 7,900 $ 6,593 $ 500 $ 15,800 149
Cities $ 3,054 $ 0 $ 10,000 $ 6,052 $ 0 $ 15,000 371
Townships $ 3,637 $ 0 $ 8,000 $ 7,285 $ 0 $ 20,000 146
School Districts & ESCs $ 3,179 $ 0 $ 8,700 $ 6,305 $ 0 $ 20,000 1,204
Colleges & Universities $ 4,184 $ 0 $ 8,150 $ 8,201 $ 0 $ 16,300 78
Fire Districts $ 5,067 $ 3,000 $ 7,950 $ 10,133 $ 6,000 $ 15,900 15
Metro Housing Authorities $ 4,003 $ 0 $ 10,000 $ 8,350 $ 0 $ 21,000 52
Port Authorities $ 3,930 $ 2,500 $ 6,350 $ 7,860 $ 5,000 $ 12,700 5
Regional Transit Authorities $ 2,815 $ 0 $ 7,500 $ 5,567 $ 0 $ 15,000 24
REGION
1 - Akron/Canton $ 2,191 $ 0 $ 8,550 $ 4,310 $ 0 $ 20,000 245
2 - Cincinnati $ 3,531 $ 0 $ 7,950 $ 7,069 $ 0 $ 15,900 225
3 - Cleveland $ 3,744 $ 0 $ 10,000 $ 7,508 $ 0 $ 17,100 344
4 - Columbus $ 3,425 $ 0 $ 8,000 $ 6,792 $ 0 $ 20,000 361
5 - Dayton $ 3,148 $ 0 $ 8,000 $ 6,310 $ 0 $ 21,000 266
6 - Southeast Ohio $ 3,270 $ 300 $ 7,350 $ 6,523 $ 500 $ 15,000 167
7 - Toledo $ 3,431 $ 0 $ 10,000 $ 6,684 $ 0 $ 20,000 283
8 - Warren/Youngstown $ 3,059 $ 0 $ 8,150 $ 6,059 $ 0 $ 16,300 155
EMPLOYEES COVERED
1 - 49 $ 3,652 $ 0 $ 8,000 $ 7,422 $ 0 $ 21,000 327
50 - 99 $ 3,163 $ 0 $ 8,700 $ 6,293 $ 0 $ 20,000 340
100 - 149 $ 3,292 $ 0 $ 10,000 $ 6,441 $ 0 $ 20,000 409
150 - 249 $ 3,082 $ 0 $ 10,000 $ 6,123 $ 0 $ 16,300 438
250 - 499 $ 3,210 $ 0 $ 8,550 $ 6,355 $ 0 $ 20,000 312
500 - 999 $ 3,445 $ 400 $ 8,550 $ 6,853 $ 800 $ 17,100 126
1,000 or more $ 3,022 $ 0 $ 8,150 $ 5,970 $ 0 $ 16,300 94
Note: Excludes plans that have unlimited out-of-network maximums.
Note: n: number of plans.
Fire Districts have the highest reported average in-network out-of-pocket maximums for both
single and family plans. Regional Transit Authorities have the lowest average out-of-pocket
maximums in both categories.
24
2022HEALTHINSURANCEREPORT
MEDICAL INSURANCE – ALL PLAN TYPES
Table 18
Average Non-Network Out-of-Pocket Maximums
(All Plan Types)
Single Family
Comparison Group Average Minimum Maximum Average Minimum Maximum n
STATEWIDE $ 6,558 $ 0 $ 32,600 $ 12,921 $ 0 $ 64,800 2,046
State of Ohio $ 6,000 $ 5,000 $ 7,000 $ 12,000 $ 10,000 $ 14,000 2
Counties $ 6,620 $ 0 $ 22,050 $ 13,034 $ 0 $ 44,100 149
Cities $ 7,301 $ 0 $ 32,400 $ 14,518 $ 0 $ 64,800 371
Townships $ 9,900 $ 0 $ 25,000 $ 19,791 $ 0 $ 48,000 146
School Districts & ESCs $ 5,556 $ 0 $ 32,600 $ 10,913 $ 0 $ 41,400 1,204
Colleges & Universities $ 8,311 $ 1,500 $ 28,000 $ 15,654 $ 3,000 $ 40,000 78
Fire Districts $ 14,348 $ 3,000 $ 23,850 $ 28,700 $ 6,000 $ 47,700 15
Metro Housing Authorities $ 10,486 $ 1,000 $ 22,500 $ 21,771 $ 2,000 $ 45,000 52
Port Authorities $ 8,570 $ 5,000 $ 12,500 $ 9,040 $ 2,000 $ 18,000 5
Regional Transit Authorities $ 5,150 $ 0 $ 22,500 $ 10,133 $ 0 $ 45,000 24
REGION
1 - Akron/Canton $ 4,737 $ 150 $ 32,600 $ 8,926 $ 300 $ 44,100 245
2 - Cincinnati $ 7,990 $ 0 $ 23,850 $ 16,341 $ 0 $ 47,700 225
3 - Cleveland $ 6,324 $ 0 $ 32,400 $ 12,684 $ 0 $ 64,800 344
4 - Columbus $ 6,816 $ 0 $ 25,000 $ 13,351 $ 0 $ 44,500 361
5 - Dayton $ 7,225 $ 0 $ 28,000 $ 14,086 $ 0 $ 48,000 266
6 - Southeast Ohio $ 7,021 $ 0 $ 20,700 $ 14,145 $ 0 $ 41,400 167
7 - Toledo $ 6,113 $ 0 $ 25,000 $ 11,804 $ 0 $ 40,000 283
8 - Warren/Youngstown $ 6,083 $ 0 $ 22,500 $ 11,801 $ 0 $ 45,000 155
EMPLOYEES COVERED
1 - 49 $ 9,080 $ 0 $ 24,000 $ 18,234 $ 0 $ 48,000 327
50 - 99 $ 7,253 $ 500 $ 32,400 $ 14,141 $ 0 $ 64,800 340
100 - 149 $ 6,182 $ 0 $ 32,600 $ 11,865 $ 0 $ 44,100 409
150 - 249 $ 5,396 $ 400 $ 20,400 $ 10,758 $ 1,000 $ 40,000 438
250 - 499 $ 5,829 $ 0 $ 32,600 $ 11,404 $ 0 $ 44,100 312
500 - 999 $ 5,701 $ 0 $ 15,000 $ 11,257 $ 0 $ 30,000 126
1,000 or more $ 5,156 $ 500 $ 12,000 $ 10,524 $ 1,000 $ 24,000 94
Note: Excludes plans that have unlimited out-of-network maximums.
Note: n: number of plans.
Fire Districts have the highest reported average non-network out-of-pocket maximums for both
single and family plans. Regional Transit Authorities have the lowest average non-network out-
of-pocket maximums for single coverage. Port Authorities have the lowest average non-network
out-of-pocket maximums for family coverage.
25
2022HEALTHINSURANCEREPORT
MEDICAL INSURANCE – PPO PLANS
MEDICAL INSURANCE – PPO PLANS
PPO PREMIUMS
Table 19 breaks down the average PPO medical premiums and the contribution amounts shared by the
employer and the employee. These averages include the costs of prescription, dental, and vision
coverages when included in the medical premiums. PPO plans account for 51.0% of all medical plans
reported in 2022.
Table 19
Average Monthly Employer & Employee Contributions
Towards Medical Premium
(PPO Plans)
Single Family
Comparison Group
Employer
Share
Employee
Share Total
Employer
Share
Employee
Share Total n
STATEWIDE $ 701.31 $ 108.84 $ 810.15 $ 1,786.22 $ 298.70 $ 2,084.92 1,043
State of Ohio $ 656.00 $ 116.00 $ 772.00 $ 1,800.00 $ 338.00 $ 2,138.00 1
Counties $ 672.22 $ 105.04 $ 777.26 $ 1,838.40 $ 307.32 $ 2,145.72 77
Less than 50,000 $ 718.63 $ 99.52 $ 818.15 $ 1,889.22 $ 284.56 $ 2,173.78 27
50,000 - 149,999 $ 663.36 $ 111.63 $ 774.99 $ 1,861.79 $ 334.32 $ 2,196.11 32
150,000 or more $ 618.35 $ 101.60 $ 719.95 $ 1,720.57 $ 293.46 $ 2,014.03 18
Cities $ 732.16 $ 97.05 $ 829.21 $ 1,949.64 $ 262.65 $ 2,212.29 178
Less than 25,000 $ 757.76 $ 95.90 $ 853.66 $ 2,016.21 $ 268.10 $ 2,284.31 117
25,000 - 99,999 $ 687.14 $ 100.23 $ 787.37 $ 1,859.21 $ 256.47 $ 2,115.68 56
100,000 or more $ 652.68 $ 87.67 $ 740.35 $ 1,431.48 $ 206.49 $ 1,637.97 5
Townships $ 838.71 $ 67.09 $ 905.80 $ 2,039.51 $ 187.19 $ 2,226.70 47
Less than 10,000 $ 912.67 $ 36.12 $ 948.79 $ 2,106.87 $ 102.50 $ 2,209.37 23
10,000 - 29,999 $ 794.61 $ 93.07 $ 887.68 $ 1,989.34 $ 243.12 $ 2,232.46 19
30,000 or more $ 692.84 $ 102.64 $ 795.48 $ 1,940.67 $ 335.76 $ 2,276.43 5
School Districts* $ 685.89 $ 113.24 $ 799.13 $ 1,715.38 $ 306.75 $ 2,022.13 668
Less than 1,000 $ 683.53 $ 108.17 $ 791.70 $ 1,732.69 $ 290.87 $ 2,023.56 185
1,000 - 2,499 $ 700.14 $ 115.30 $ 815.44 $ 1,734.21 $ 309.92 $ 2,044.13 267
2,500 - 9,999 $ 662.36 $ 111.83 $ 774.19 $ 1,667.26 $ 298.15 $ 1,965.41 159
10,000 or more $ 679.50 $ 119.13 $ 798.63 $ 1,687.40 $ 386.22 $ 2,073.62 13
Educational Svc Centers $ 697.21 $ 125.76 $ 822.97 $ 1,710.88 $ 364.15 $ 2,075.03 44
Colleges & Universities $ 700.59 $ 120.29 $ 820.88 $ 1,939.72 $ 352.38 $ 2,292.10 37
Fire Districts - - - - - - 0
Metro Housing Authorities $ 593.75 $ 156.99 $ 750.74 $ 1,768.34 $ 500.39 $ 2,268.73 20
Port Authorities $ 456.54 $ 73.51 $ 530.05 $ 1,493.75 $ 240.18 $ 1,733.93 1
Regional Transit Authorities $ 967.82 $ 98.06 $ 1,065.88 $ 1,690.14 $ 252.24 $ 1,942.38 14
Note: Includes plans where employees contribute $0 to the medical premium.
Note: Includes plans where the medical premium includes the cost of prescription and dental.
Note: n: number of plans
26
2022HEALTHINSURANCEREPORT
MEDICAL INSURANCE – PPO PLANS
Table 20 organizes the same data in Table 19 by region and by the number of employees covered. These
averages include the costs of prescription, dental, and vision coverages when included with the medical
premiums. A breakdown of the regions is on page 61.
Table 20
Average Monthly Employer & Employee Contributions
Towards Medical Premium by Region
(PPO Plans)
Single
Family
Comparison Group
Employer
Share
Employee
Share Total
Employer
Share
Employee
Share Total n
STATEWIDE $ 701.31 $ 108.84 $ 810.15 $ 1,786.22 $ 298.70 $ 2,084.92 1,043
REGION
1 - Akron/Canton $ 682.38 $ 93.23 $ 775.61 $ 1,700.81 $ 239.44 $ 1,940.25 187
2 - Cincinnati $ 613.40 $ 124.26 $ 737.66 $ 1,574.77 $ 351.40 $ 1,926.17 86
3 - Cleveland $ 680.21 $ 94.38 $ 774.59 $ 1,752.91 $ 236.62 $ 1,989.53 212
4 - Columbus $ 769.06 $ 136.17 $ 905.23 $ 1,913.11 $ 387.54 $ 2,300.65 156
5 - Dayton $ 716.47 $ 160.68 $ 877.15 $ 1,880.59 $ 485.18 $ 2,365.77 88
6 - Southeast Ohio $ 843.46 $ 110.61 $ 954.07 $ 2,058.23 $ 325.97 $ 2,384.20 91
7 - Toledo $ 662.12 $ 115.10 $ 777.22 $ 1,708.48 $ 307.00 $ 2,015.48 117
8 - Warren/Youngstown $ 659.85 $ 63.88 $ 723.73 $ 1,768.16 $ 173.55 $ 1,941.71 106
EMPLOYEES COVERED
1 - 49 $ 749.14 $ 97.87 $ 847.01 $ 1,952.96 $ 284.86 $ 2,237.82 130
50 - 99 $ 687.36 $ 104.68 $ 792.04 $ 1,784.04 $ 288.11 $ 2,072.15 168
100 - 149 $ 705.31 $ 107.33 $ 812.64 $ 1,779.93 $ 292.91 $ 2,072.84 220
150 - 249 $ 716.46 $ 117.67 $ 834.13 $ 1,792.02 $ 317.09 $ 2,109.11 238
250 - 499 $ 687.51 $ 105.10 $ 792.61 $ 1,732.68 $ 284.94 $ 2,017.62 172
500 - 999 $ 668.56 $ 124.56 $ 793.12 $ 1,706.32 $ 322.55 $ 2,028.87 65
1,000 or more $ 629.55 $ 107.70 $ 737.25 $ 1,664.81 $ 323.67 $ 1,988.48 50
Note: Includes plans where employees contribute $0 to the medical premium.
Note: Includes plans where the medical premium includes the cost of prescription and dental.
Note: n: number of plans.
Compared to the statewide averages, medical premiums in the Southeast Ohio region (Region 6)
average 17.8% higher for single coverage and 14.4% higher for family coverage.
Compared to the statewide averages, medical insurance premiums in the Cincinnati region
Region 2) are 8.9% lower for single coverage and 7.6% lower for family coverage.
27
2022HEALTHINSURANCEREPORT
MEDICAL INSURANCE – PPO PLANS
EMPLOYER & EMPLOYEE SHARE OF MEDICAL PREMIUM
Table 21 displays the employer and employee share of the medical premium for single and family plans
by jurisdiction. This data corresponds with the data displayed in Table 19 (located on page 25).
Table 21
Employer & Employee Cost Sharing Percentage
Towards Medical Premium
(PPO Plans)
Single Family
Comparison Group
Employer
Share
Employee
Share
Employer
Share
Employee
Share n
STATEWIDE 86.6% 13.4% 85.7% 14.3% 1,043
State of Ohio 85.0% 15.0% 84.2% 15.8% 1
Counties 86.5% 13.5% 85.7% 14.3% 77
Less than 50,000 87.8% 12.2% 86.9% 13.1% 27
50,000 - 149,999 85.6% 14.4% 84.8% 15.2% 32
150,000 or more 85.9% 14.1% 85.4% 14.6% 18
Cities 88.3% 11.7% 88.1% 11.9% 178
Less than 25,000 88.8% 11.2% 88.3% 11.7% 117
25,000 - 99,999 87.3% 12.7% 87.9% 12.1% 56
100,000 or more 88.2% 11.8% 87.4% 12.6% 5
Townships 92.6% 7.4% 91.6% 8.4% 47
Less than 10,000 96.2% 3.8% 95.4% 4.6% 23
10,000 - 29,999 89.5% 10.5% 89.1% 10.9% 19
30,000 or more 87.1% 12.9% 85.3% 14.7% 5
School Districts * 85.8% 14.2% 84.8% 15.2% 668
Less than 1,000 86.3% 13.7% 85.6% 14.4% 185
1,000 - 2,499 85.9% 14.1% 84.8% 15.2% 267
2,500 - 9,999 85.6% 14.4% 84.8% 15.2% 159
10,000 or more 85.1% 14.9% 81.4% 18.6% 13
Educational Svc Centers 84.7% 15.3% 82.5% 17.5% 44
Colleges & Universities 85.3% 14.7% 84.6% 15.4% 37
Fire Districts - - - - 0
Metro Housing Authorities 79.1% 20.9% 77.9% 22.1% 20
Port Authorities 86.1% 13.9% 86.1% 13.9% 1
Regional Transit Authorities 90.8% 9.2% 87.0% 13.0% 14
Note: Includes plans where employees contribute $0 to the medical premium.
Note: Includes plans where the medical premium includes the cost of prescription and dental.
Note: n: number of plans
On average, employees in Townships pay the lowest percent amount towards the total single
premium at 7.4%. Employees working for Metro Housing Authorities contribute the highest
single percent share at 20.9%.
28
2022HEALTHINSURANCEREPORT
MEDICAL INSURANCE – PPO PLANS
Table 22 is a continuation of Table 21 and breaks down the employer and employee percent share costs
by region and number of employees covered. This data corresponds with the data displayed in Table 20.
Table 22
Employer & Employee Cost Sharing Percentage
Towards Medical Premium by Region
(PPO Plans)
Single Family
Comparison Group
Employer
Share
Employee
Share
Employer
Share
Employee
Share n
STATEWIDE 86.6% 13.4% 85.7% 14.3% 1,043
REGION
1 - Akron/Canton 88.0% 12.0% 87.7% 12.3% 187
2 - Cincinnati 83.2% 16.8% 81.8% 18.2% 86
3 - Cleveland 87.8% 12.2% 88.1% 11.9% 212
4 - Columbus 85.0% 15.0% 83.2% 16.8% 156
5 - Dayton 81.7% 18.3% 79.5% 20.5% 88
6 - Southeast Ohio 88.4% 11.6% 86.3% 13.7% 91
7 - Toledo 85.2% 14.8% 84.8% 15.2% 117
8 - Warren/Youngstown 91.2% 8.8% 91.1% 8.9% 106
EMPLOYEES COVERED
1 - 49 88.4% 11.6% 87.3% 12.7% 130
50 - 99 86.8% 13.2% 86.1% 13.9% 168
100 - 149 86.8% 13.2% 85.9% 14.1% 220
150 - 249 85.9% 14.1% 85.0% 15.0% 238
250 - 499 86.7% 13.3% 85.9% 14.1% 172
500 - 999 84.3% 15.7% 84.1% 15.9% 65
1,000 or more 85.4% 14.6% 83.7% 16.3% 50
Note: Includes plans where employees contribute $0 to the medical premium.
Note: Includes plans where the medical premium includes the cost of prescription and dental.
Note: n: number of plans.
On average, employees in the Warren/Youngstown region (Region 8) pay the lowest percent
amount towards the medical premium at 8.8% for single and 8.9% for family.
Employers with 1-49 employees reported the lowest average contribution towards the single
premium at 11.6% and 12.7% toward the total family premium.

29
2022HEALTHINSURANCEREPORT
MEDICAL INSURANCE – PPO PLANS
NETWORK DEDUCTIBLES
Table 23 shows the average deductibles for jurisdictions, regions, and the number of employees covered
for PPO plans.
Table 23
Average In-Network Deductible Amount
(PPO Plans)
Comparison Group Single Family n
STATEWIDE $ 455 $ 921 1,043
State of Ohio $ 400 $ 800 1
Counties $ 590 $ 1,185 77
Cities $ 440 $ 915 178
Townships $ 428 $ 920 47
School Districts & ESCs $ 433 $ 865 668
Colleges & Universities $ 549 $ 1,124 37
Fire Districts - - 0
Metro Housing Authorities $ 667 $ 1,371 20
Port Authorities $ 750 $ 1,500 1
Regional Transit Authorities $ 443 $ 921 14
REGION
1 - Akron/Canton $ 371 $ 743 187
2 - Cincinnati $ 621 $ 1,268 86
3 - Cleveland $ 419 $ 829 212
4 - Columbus $ 440 $ 959 156
5 - Dayton $ 418 $ 865 88
6 - Southeast Ohio $ 476 $ 1,047 91
7 - Toledo $ 602 $ 1,091 117
8 - Warren/Youngstown $ 411 $ 825 106
EMPLOYEES COVERED
1 - 49 $ 550 $ 1,149 130
50 - 99 $ 469 $ 942 168
100 - 149 $ 441 $ 880 220
150 - 249 $ 437 $ 877 238
250 - 499 $ 416 $ 841 172
500 - 999 $ 460 $ 929 65
1,000 or more $ 435 $ 904 50
Note: Average deductible amounts include plans where employees contribute $0 to the annual deductible.
Note: n: number of plans.
Port Authorities have the highest reported average deductible for both single and family plans in-
network. The State of Ohio has the lowest in-network deductible in both categories.
30
2022HEALTHINSURANCEREPORT
MEDICAL INSURANCE – PPO PLANS
Figures 11 and 12 show the percent of plans in each deductible category for single and family coverage
displayed in Table 23.
Figure 11
Figure 12
5.5%
7.6%
40.5%
46.2%
0.2%
DeductibleCategoriesforSingle
In‐NetworkMedicalCoverage
$0
$1‐$124
$125‐$499
$500‐$1,399
$1,400ormore
5.4%
7.0%
41.3%
45.7%
0.6%
DeductibleCategoriesforFamily
In‐NetworkMedicalCoverage
$0
$1‐$249
$250‐$899
$900‐$2,799
$2,800ormore
31
2022HEALTHINSURANCEREPORT
MEDICAL INSURANCE – PPO PLANS
NON-NETWORK DEDUCTIBLES
Table 24 shows the average non-network deductibles for jurisdictions, regions, and the number of
employees covered.
Table 24
Average Non-Network Deductible Amount
(PPO Plans)
Comparison Group Single Family n
STATEWIDE $ 1,061 $ 2,175 1,043
State of Ohio $ 800 $ 1,600 1
Counties $ 1,249 $ 2,518 77
Cities $ 1,232 $ 2,557 178
Townships $ 1,915 $ 3,857 47
School Districts & ESCs $ 918 $ 1,874 668
Colleges & Universities $ 1,270 $ 2,660 37
Fire Districts - - 0
Metro Housing Authorities $ 1,222 $ 2,733 20
Port Authorities $ 2,250 $ 4,500 1
Regional Transit Authorities $ 1,129 $ 2,296 14
REGION
1 - Akron/Canton $ 861 $ 1,740 187
2 - Cincinnati $ 1,657 $ 3,569 86
3 - Cleveland $ 874 $ 1,722 212
4 - Columbus $ 975 $ 2,066 156
5 - Dayton $ 1,230 $ 2,547 88
6 - Southeast Ohio $ 1,072 $ 2,305 91
7 - Toledo $ 1,452 $ 2,830 117
8 - Warren/Youngstown $ 875 $ 1,780 106
EMPLOYEES COVERED
1 - 49 $ 1,516 $ 3,113 130
50 - 99 $ 1,376 $ 2,878 168
100 - 149 $ 903 $ 1,824 220
150 - 249 $ 925 $ 1,868 238
250 - 499 $ 874 $ 1,746 172
500 - 999 $ 958 $ 2,041 65
1,000 or more $ 964 $ 2,101 50
Note: Average deductible amounts include plans where employees contribute $0 to the annual deductible.
Note: n: number of plans.
Port Authorities have the highest reported average deductible for both single and family plans for
non-network. The State of Ohio had the lowest reported average deductible for both single and
family plans for non-network.
32
2022HEALTHINSURANCEREPORT
MEDICAL INSURANCE – PPO PLANS
OUT-OF-POCKET MAXIMUMS
Tables 25 and 26 give the average, minimum, and maximum out-of-pocket maximums for single and
family medical coverage.
Table 25
Average In-Network Out-of-Pocket Maximums
(PPO Plans)
Single
Family
Comparison Group Average Minimum Maximum Average Minimum Maximum n
STATEWIDE $ 2,467 $ 0 $ 8,550 $ 4,937 $ 0 $ 17,100 1,043
State of Ohio $ 2,500 $ 2,500 $ 2,500 $ 5,000 $ 5,000 $ 5,000 1
Counties $ 2,635 $ 400 $ 7,900 $ 5,292 $ 500 $ 15,800 77
Cities $ 2,095 $ 0 $ 7,350 $ 4,225 $ 0 $ 14,700 178
Townships $ 1,879 $ 0 $ 7,150 $ 3,845 $ 0 $ 14,300 47
School Districts & ESCs $ 2,520 $ 0 $ 8,550 $ 5,020 $ 0 $ 17,100 668
Colleges & Universities $ 3,924 $ 750 $ 8,150 $ 7,638 $ 1,500 $ 16,300 37
Fire Districts - - - - - - 0
Metro Housing Authorities $ 2,454 $ 350 $ 6,600 $ 5,551 $ 700 $ 15,000 20
Port Authorities $ 3,000 $ 3,000 $ 3,000 $ 6,000 $ 6,000 $ 6,000 1
Regional Transit
Authorities
$ 1,946 $ 0 $ 6,850 $ 3,786 $ 0 $ 13,700 14
REGION
1 - Akron/Canton $ 1,618 $ 0 $ 8,550 $ 3,226 $ 0 $ 17,100 187
2 - Cincinnati $ 2,748 $ 170 $ 7,150 $ 5,519 $ 500 $ 14,300 86
3 - Cleveland $ 3,378 $ 0 $ 8,550 $ 6,795 $ 0 $ 17,100 212
4 - Columbus $ 2,356 $ 0 $ 7,150 $ 4,863 $ 0 $ 14,300 156
5 - Dayton $ 1,966 $ 0 $ 6,100 $ 3,945 $ 0 $ 12,200 88
6 - Southeast Ohio $ 2,267 $ 300 $ 7,350 $ 4,363 $ 500 $ 15,000 91
7 - Toledo $ 2,560 $ 0 $ 7,900 $ 5,106 $ 0 $ 15,800 117
8 - Warren/Youngstown $ 2,571 $ 350 $ 8,150 $ 5,012 $ 700 $ 16,300 106
EMPLOYEES COVERED
1 - 49 $ 2,339 $ 0 $ 7,350 $ 4,771 $ 0 $ 15,000 130
50 - 99 $ 2,249 $ 0 $ 8,150 $ 4,560 $ 0 $ 16,300 168
100 - 149 $ 2,538 $ 0 $ 8,550 $ 4,968 $ 0 $ 17,100 220
150 - 249 $ 2,352 $ 0 $ 8,150 $ 4,774 $ 0 $ 16,300 238
250 - 499 $ 2,597 $ 0 $ 8,550 $ 5,168 $ 0 $ 17,100 172
500 - 999 $ 2,892 $ 400 $ 8,550 $ 5,716 $ 800 $ 17,100 65
1,000 or more $ 2,812 $ 0 $ 8,150 $ 5,505 $ 0 $ 16,300 50
Note: Excludes plans that have unlimited out-of-network maximums.
Note: n: number of plans.
33
2022HEALTHINSURANCEREPORT
MEDICAL INSURANCE – PPO PLANS
Table 26
Average Non-Network Out-of-Pocket Maximums
(PPO Plans)
Single Family
Comparison Group Average Minimum Maximum Average Minimum Maximum n
STATEWIDE $ 4,112 $ 0 $ 22,050 $ 8,249 $ 0 $ 44,100 1,043
State of Ohio $ 5,000 $ 5,000 $ 5,000 $ 10,000 $ 10,000 $ 10,000 1
Counties $ 5,103 $ 800 $ 22,050 $ 10,247 $ 1,800 $ 44,100 77
Cities $ 4,571 $ 150 $ 22,050 $ 9,171 $ 300 $ 44,100 178
Townships $ 6,080 $ 0 $ 21,000 $ 12,284 $ 0 $ 42,000 47
School Districts & ESCs $ 3,656 $ 0 $ 16,000 $ 7,290 $ 0 $ 32,000 668
Colleges & Universities $ 5,302 $ 1,500 $ 10,000 $ 10,748 $ 3,000 $ 20,000 37
Fire Districts - - - - - - 0
Metro Housing
Authorities
$ 4,629 $ 1,000 $ 10,000 $ 10,701 $ 2,000 $ 30,000 20
Port Authorities $ 9,000 $ 9,000 $ 9,000 $ 18,000 $ 18,000 $ 18,000 1
Regional Transit
Authorities
$ 2,859 $ 0 $ 6,850 $ 5,491 $ 0 $ 13,700 14
REGION
1 - Akron/Canton $ 3,028 $ 150 $ 22,050 $ 5,988 $ 300 $ 44,100 187
2 - Cincinnati $ 6,050 $ 340 $ 21,000 $ 12,580 $ 1,000 $ 42,000 86
3 - Cleveland $ 3,497 $ 0 $ 22,050 $ 7,001 $ 0 $ 44,100 212
4 - Columbus $ 4,215 $ 0 $ 16,000 $ 8,490 $ 0 $ 32,000 156
5 - Dayton $ 4,433 $ 0 $ 18,000 $ 8,762 $ 0 $ 36,000 88
6 - Southeast Ohio $ 4,511 $ 750 $ 19,200 $ 9,130 $ 1,300 $ 38,400 91
7 - Toledo $ 4,490 $ 0 $ 20,000 $ 8,939 $ 0 $ 40,000 117
8 - Warren/Youngstown $ 3,951 $ 900 $ 15,000 $ 7,772 $ 1,000 $ 30,000 106
EMPLOYEES COVERED
1 - 49 $ 5,618 $ 0 $ 22,050 $ 11,411 $ 0 $ 44,100 130
50 - 99 $ 4,789 $ 500 $ 22,050 $ 9,648 $ 500 $ 44,100 168
100 - 149 $ 3,800 $ 0 $ 13,200 $ 7,505 $ 0 $ 26,400 220
150 - 249 $ 3,333 $ 400 $ 14,200 $ 6,637 $ 1,000 $ 28,400 238
250 - 499 $ 3,862 $ 0 $ 22,050 $ 7,748 $ 0 $ 44,100 172
500 - 999 $ 3,561 $ 0 $ 9,000 $ 7,090 $ 0 $ 18,000 65
1,000 or more $ 4,134 $ 1,200 $ 9,000 $ 8,601 $ 2,400 $ 18,000 50
Note: Excludes plans that have unlimited out-of-network maximums.
Note: n: number of plans.
Port Authorities reported the highest average non-network out-of-pocket maximums for single and
family plans.
Regional Transit Authorities reported the lowest average non-network out-of-pocket maximums
for single and family plans.
34
MEDICAL INSURANCE – HDHPs
2022HEALTHINSURANCEREPORT
MEDICAL INSURANCE – HDHPs
HDHP PREMIUMS
The second most frequently utilized plan type is the High Deductible Health Plan (HDHP). HDHPs
account for 45.8% of all plans reported this year. Table 27 breaks down the average HDHP medical
premiums and the contribution amounts shared by the employer and the employee. These averages include
the costs of prescription, dental, and vision coverages when included with the medical premiums.
Table 27
Average Monthly Employer & Employee Contributions
Towards Medical Premium
(HDHP Plans)
Single Family
Comparison Group
Employer
Share
Employee
Share Total
Employer
Share
Employee
Share Total
n
STATEWIDE $ 623.54 $ 85.18 $ 708.72 $ 1,673.93 $ 247.80 $ 1,921.73 938
State of Ohio $ 699.00 $ 78.00 $ 777.00 $ 2,089.00 $ 233.00 $ 2,322.00 1
Counties $ 618.14 $ 83.24 $ 701.38 $ 1,728.06 $ 260.14 $ 1,988.20 59
Less than 50,000 $ 652.22 $ 95.67 $ 747.89 $ 1,807.95 $ 314.87 $ 2,122.82 29
50,000 - 149,999 $ 594.08 $ 77.61 $ 671.69 $ 1,649.09 $ 209.57 $ 1,858.66 20
150,000 or more $ 567.42 $ 58.42 $ 625.84 $ 1,654.30 $ 202.56 $ 1,856.86 10
Cities $ 626.46 $ 76.08 $ 702.54 $ 1,793.08 $ 277.09 $ 2,070.17 180
Less than 25,000 $ 627.42 $ 73.49 $ 700.91 $ 1,834.45 $ 224.57 $ 2,059.02 138
25,000 - 99,999 $ 606.91 $ 84.62 $ 691.53 $ 1,666.63 $ 236.05 $ 1,902.68 38
100,000 or more $ 779.50 $ 83.61 $ 863.11 $ 1,597.79 $ 227.29 $ 1,825.08 4
Townships $ 632.64 $ 57.41 $ 690.05 $ 1,836.34 $ 174.95 $ 2,011.29 95
Less than 10,000 $ 642.61 $ 54.36 $ 696.97 $ 1,842.15 $ 167.84 $ 2,009.99 45
10,000 - 29,999 $ 660.59 $ 50.43 $ 711.02 $ 1,928.74 $ 149.73 $ 2,078.47 36
30,000 or more $ 534.85 $ 83.55 $ 618.40 $ 1,589.14 $ 257.80 $ 1,846.94 14
School Districts * $ 613.94 $ 91.44 $ 705.38 $ 1,576.69 $ 259.50 $ 1,836.19 510
Less than 1,000 $ 638.13 $ 77.49 $ 715.62 $ 1,646.65 $ 222.00 $ 1,868.65 144
1,000 - 2,499 $ 615.92 $ 101.49 $ 717.41 $ 1,596.92 $ 271.38 $ 1,868.30 197
2,500 - 9,999 $ 566.94 $ 87.17 $ 654.11 $ 1,450.04 $ 259.43 $ 1,709.47 116
10,000 or more $ 621.71 $ 100.40 $ 722.11 $ 1,535.20 $ 362.54 $ 1,897.74 13
Educational Svc Centers $ 651.02 $ 101.29 $ 752.31 $ 1,608.14 $ 299.87 $ 1,908.01 40
Colleges & Universities $ 585.67 $ 111.84 $ 697.51 $ 1,696.82 $ 314.94 $ 2,011.76 38
Fire Districts $ 623.38 $ 93.29 $ 716.67 $ 1,800.65 $ 256.99 $ 2,057.64 15
Metro Housing Authorities $ 811.24 $ 83.75 $ 894.99 $ 1,984.81 $ 289.33 $ 2,274.14 29
Port Authorities $ 614.84 $ 92.69 $ 707.53 $ 1,813.90 $ 269.32 $ 2,083.22 4
Regional Transit Authorities $ 646.22 $ 80.25 $ 726.47 $ 1,603.86 $ 227.53 $ 1,831.39 7
Note: Includes plans where employees contribute $0 to the medical premium.
Note: Includes plans where the medical premium includes the cost of prescription and dental.
Note: n: number of plans
35
MEDICAL INSURANCE – HDHPs
2022HEALTHINSURANCEREPORT
Table 28 organizes the same data in Table 27 by region and by the number of employees covered. These
averages include the costs of prescription, dental, and vision coverages when included with the medical
premiums. A breakdown of the regions is on page 61.
Table 28
Average Monthly Employer & Employee Contributions
Towards Medical Premium by Region
(HDHP Plans)
Single Family
Comparison Group
Employer
Share
Employee
Share Total
Employer
Share
Employee
Share Total n
STATEWIDE $ 623.54 $ 85.18 $ 708.72 $ 1,673.93 $ 247.80 $ 1,921.73 938
REGION
1 - Akron/Canton $ 539.09 $ 82.42 $ 621.51 $ 1,558.35 $ 209.79 $ 1,768.14 51
2 - Cincinnati $ 579.70 $ 82.71 $ 662.41 $ 1,613.23 $ 258.79 $ 1,872.02 135
3 - Cleveland $ 593.74 $ 59.77 $ 653.51 $ 1,616.52 $ 153.75 $ 1,770.27 109
4 - Columbus $ 648.29 $ 95.13 $ 743.42 $ 1,699.88 $ 293.15 $ 1,993.03 197
5 - Dayton $ 646.84 $ 100.71 $ 747.55 $ 1,754.38 $ 289.72 $ 2,044.10 177
6 - Southeast Ohio $ 693.17 $ 91.06 $ 784.23 $ 1,789.55 $ 270.69 $ 2,060.24 76
7 - Toledo $ 615.96 $ 77.60 $ 693.56 $ 1,616.75 $ 217.46 $ 1,834.21 153
8 - Warren/Youngstown $ 634.27 $ 67.01 $ 701.28 $ 1,686.69 $ 180.05 $ 1,866.74 40
EMPLOYEES COVERED
1 - 49 $ 658.10 $ 70.58 $ 728.68 $ 1,815.08 $ 225.70 $ 2,040.78 192
50 - 99 $ 647.42 $ 75.79 $ 723.21 $ 1,763.41 $ 218.55 $ 1,981.96 165
100 - 149 $ 608.39 $ 95.24 $ 703.63 $ 1,635.55 $ 263.83 $ 1,899.38 179
150 - 249 $ 620.72 $ 93.87 $ 714.59 $ 1,635.22 $ 258.23 $ 1,893.45 192
250 - 499 $ 589.84 $ 86.21 $ 676.05 $ 1,585.80 $ 241.79 $ 1,827.59 122
500 - 999 $ 595.01 $ 95.17 $ 690.18 $ 1,510.08 $ 303.97 $ 1,814.05 55
1,000 or more $ 580.95 $ 88.79 $ 669.74 $ 1,492.15 $ 293.01 $ 1,785.16 33
Note: Includes plans where employees contribute $0 to the medical premium.
Note: Includes plans where the medical premium includes the cost of prescription and dental.
Note: n: number of plans.
Compared to the statewide averages, medical premiums in the Southeast Ohio region (Region 6)
are 10.7% higher for single coverage and 7.2% higher for family coverage.
Compared to the statewide averages, medical premiums in the Akron/Canton region (Region 1) are
12.3% lower for single coverage and 8.0% lower for family coverage.
36
MEDICAL INSURANCE – HDHPs
2022HEALTHINSURANCEREPORT
EMPLOYER & EMPLOYEE SHARE OF MEDICAL PREMIUM
Table 29 displays the employer and employee share of the medical premium for single and family plans by
jurisdiction. This data corresponds with the data displayed in Table 27.
Table 29
Employer & Employee Cost Sharing Percentage
Towards Medical Premium
(HDHP Plans)
Single Family
Comparison Group
Employer
Share
Employee
Share
Employer
Share
Employee
Share n
STATEWIDE 88.0% 12.0% 87.1% 12.9% 938
State of Ohio 90.0% 10.0% 90.0% 10.0% 1
Counties 88.1% 11.9% 86.9% 13.1% 59
Less than 50,000 87.2% 12.8% 85.2% 14.8% 29
50,000 - 149,999 88.4% 11.6% 88.7% 11.3% 20
150,000 or more 90.7% 9.3% 89.1% 10.9% 10
Cities 89.2% 10.8% 86.6% 13.4% 180
Less than 25,000 89.5% 10.5% 89.1% 10.9% 138
25,000 - 99,999 87.8% 12.2% 87.6% 12.4% 38
100,000 or more 90.3% 9.7% 87.5% 12.5% 4
Townships 91.7% 8.3% 91.3% 8.7% 95
Less than 10,000 92.2% 7.8% 91.6% 8.4% 45
10,000 - 29,999 92.9% 7.1% 92.8% 7.2% 36
30,000 or more 86.5% 13.5% 86.0% 14.0% 14
School Districts 87.0% 13.0% 85.9% 14.1% 510
Less than 1,000 89.2% 10.8% 88.1% 11.9% 144
1,000 - 2,499 85.9% 14.1% 85.5% 14.5% 197
2,500 - 9,999 86.7% 13.3% 84.8% 15.2% 116
10,000 or more 86.1% 13.9% 80.9% 19.1% 13
Educational Svc Centers 86.5% 13.5% 84.3% 15.7% 40
Colleges & Universities 84.0% 16.0% 84.3% 15.7% 38
Fire Districts 87.0% 13.0% 87.5% 12.5% 15
Metro Housing Authorities 90.6% 9.4% 87.3% 12.7% 29
Port Authorities 86.9% 13.1% 87.1% 12.9% 4
Regional Transit Authorities 89.0% 11.0% 87.6% 12.4% 7
Note: Includes plans where employees contribute $0 to the medical premium.
Note: Includes plans where the medical premium includes the cost of prescription and dental.
Note: n: number of plans
On average, employees working for Townships pay the lowest percentage share amount towards
the total single premium at 8.3% and total family premium at 8.7%.
37
MEDICAL INSURANCE – HDHPs
2022HEALTHINSURANCEREPORT
Table 30 is a continuation of Table 29 and breaks down the employer and employee percent share costs by
region and number of employees covered. This data corresponds with the data displayed in Table 28.
Table 30
Employer & Employee Cost Sharing Percentage
Towards Medical Premium by Region
(HDHP Plans)
Single Family
Comparison Group
Employer
Share
Employee
Share
Employer
Share
Employee
Share n
STATEWIDE 88.0% 12.0% 87.1% 12.9% 938
REGION
1 - Akron/Canton 86.7% 13.3% 88.1% 11.9% 51
2 - Cincinnati 87.5% 12.5% 86.2% 13.8% 135
3 - Cleveland 90.9% 9.1% 91.3% 8.7% 109
4 - Columbus 87.2% 12.8% 85.3% 14.7% 197
5 - Dayton 86.5% 13.5% 85.8% 14.2% 177
6 - Southeast Ohio 88.4% 11.6% 86.9% 13.1% 76
7 - Toledo 88.8% 11.2% 88.1% 11.9% 153
8 - Warren/Youngstown 90.4% 9.6% 90.4% 9.6% 40
EMPLOYEES COVERED
1 - 49 90.3% 9.7% 88.9% 11.1% 192
50 - 99 89.5% 10.5% 89.0% 11.0% 165
100 - 149 86.5% 13.5% 86.1% 13.9% 179
150 - 249 86.9% 13.1% 86.4% 13.6% 192
250 - 499 87.2% 12.8% 86.8% 13.2% 122
500 - 999 86.2% 13.8% 83.2% 16.8% 55
1,000 or more 86.7% 13.3% 83.6% 16.4% 33
Note: Includes plans where employees contribute $0 to the medical premium.
Note: Includes plans where the medical premium includes the cost of prescription and dental.
Note: n: number of plans
Table 30 shows that the Cleveland region (Region 3) reported the lowest average employee
percent share at 9.1% for single and 8.7% for family coverage
When comparing the number of employees covered, employers with 1-49 employees reported the
lowest averages with 9.7% employee single premium share and 11.1% employee family premium
share.

38
MEDICAL INSURANCE – HDHPs
2022HEALTHINSURANCEREPORT
NETWORK DEDUCTIBLES
Table 31 shows the average deductibles for jurisdictions, regions, and the number of employees covered
for high deductible health plans.
Table 31
Average In-Network Deductible Amount
(HDHPs)
Comparison Group Single Family n
STATEWIDE $ 3,062 $ 5,998 938
State of Ohio $ 2,000 $ 4,000 1
Counties $ 2,401 $ 4,660 59
Cities $ 2,857 $ 5,739 180
Townships $ 3,440 $ 6,932 95
School Districts & ESCs $ 3,133 $ 6,114 510
Colleges & Universities $ 3,029 $ 5,238 38
Fire Districts $ 3,683 $ 7,367 15
Metro Housing Authorities $ 3,374 $ 6,454 29
Port Authorities $ 2,113 $ 4,225 4
Regional Transit Authorities $ 1,929 $ 3,857 7
REGION
1 - Akron/Canton $ 3,506 $ 6,625 51
2 - Cincinnati $ 3,017 $ 5,983 135
3 - Cleveland $ 3,520 $ 6,751 109
4 - Columbus $ 3,196 $ 6,323 197
5 - Dayton $ 2,704 $ 5,399 177
6 - Southeast Ohio $ 2,908 $ 5,765 76
7 - Toledo $ 2,962 $ 5,687 153
8 - Warren/Youngstown $ 3,019 $ 5,976 40
EMPLOYEES COVERED
1 - 49 $ 3,265 $ 6,523 192
50 - 99 $ 2,931 $ 5,787 165
100 - 149 $ 3,131 $ 6,154 179
150 - 249 $ 3,035 $ 5,849 192
250 - 499 $ 3,027 $ 5,771 122
500 - 999 $ 3,018 $ 5,975 55
1,000 or more $ 2,530 $ 4,945 33
Note: Average deductible amounts include plans where employees contribute $0 to the annual deductible.
Note: n: number of plans.
Regional Transit Authorities have the lowest reported average deductible for both single and
family plans in-network.
39
MEDICAL INSURANCE – HDHPs
2022HEALTHINSURANCEREPORT
Figures 13 and 14 show the percent of HDHPs in each deductible category for single and family coverage.
Figure 13
Figure 14
30.4%
45.6%
9.2%
7.3%
7.5%
DeductibleCategoriesforSingle
In‐NetworkMedicalCoverage
$0‐$2,499
$2,500‐$3,499
$3,500‐$4,499
$4,500‐$5,999
$6,000ormore
13.6%
48.8%
23.9%
8.2%
5.5%
DeductibleCategoriesforFamily
In‐NetworkMedicalCoverage
$0‐$3,999
$4,000‐$5,999
$6,000‐$9,999
$10,000‐$12,999
$13,000ormore
40
MEDICAL INSURANCE – HDHPs
2022HEALTHINSURANCEREPORT
NON-NETWORK DEDUCTIBLES
Table 32 shows the average non-network deductibles for jurisdictions, regions, and the number of
employees covered.
Table 32
Average Non-Network Deductible Amount
(HDHPs)
Comparison Group Single Family
n
STATEWIDE $ 5,665 $ 10,934 938
State of Ohio $ 4,000 $ 8,000 1
Counties $ 4,480 $ 8,760 59
Cities $ 5,985 $ 11,709 180
Townships $ 7,534 $ 14,678 95
School Districts & ESCs $ 5,119 $ 9,848 510
Colleges & Universities $ 6,136 $ 11,314 38
Fire Districts $ 9,517 $ 18,033 15
Metro Housing Authorities $ 7,980 $ 15,219 29
Port Authorities $ 4,500 $ 9,000 4
Regional Transit Authorities $ 3,750 $ 7,500 7
REGION
1 - Akron/Canton $ 7,100 $ 13,209 51
2 - Cincinnati $ 5,772 $ 11,163 135
3 - Cleveland $ 6,337 $ 11,804 109
4 - Columbus $ 5,652 $ 10,828 197
5 - Dayton $ 5,301 $ 10,349 177
6 - Southeast Ohio $ 5,861 $ 11,816 76
7 - Toledo $ 4,567 $ 8,945 153
8 - Warren/Youngstown $ 6,992 $ 13,809 40
EMPLOYEES COVERED
1 - 49 $ 7,074 $ 13,578 192
50 - 99 $ 5,668 $ 11,193 165
100 - 149 $ 5,364 $ 10,308 179
150 - 249 $ 5,090 $ 9,826 192
250 - 499 $ 5,366 $ 10,067 122
500 - 999 $ 5,315 $ 10,450 55
1,000 or more $ 4,164 $ 8,196 33
Note: Average deductible amounts include plans where employees contribute $0 to the annual deductible.
Note: n: number of plans.
Fire Districts have the highest reported average non-network deductible for single and family
plans.
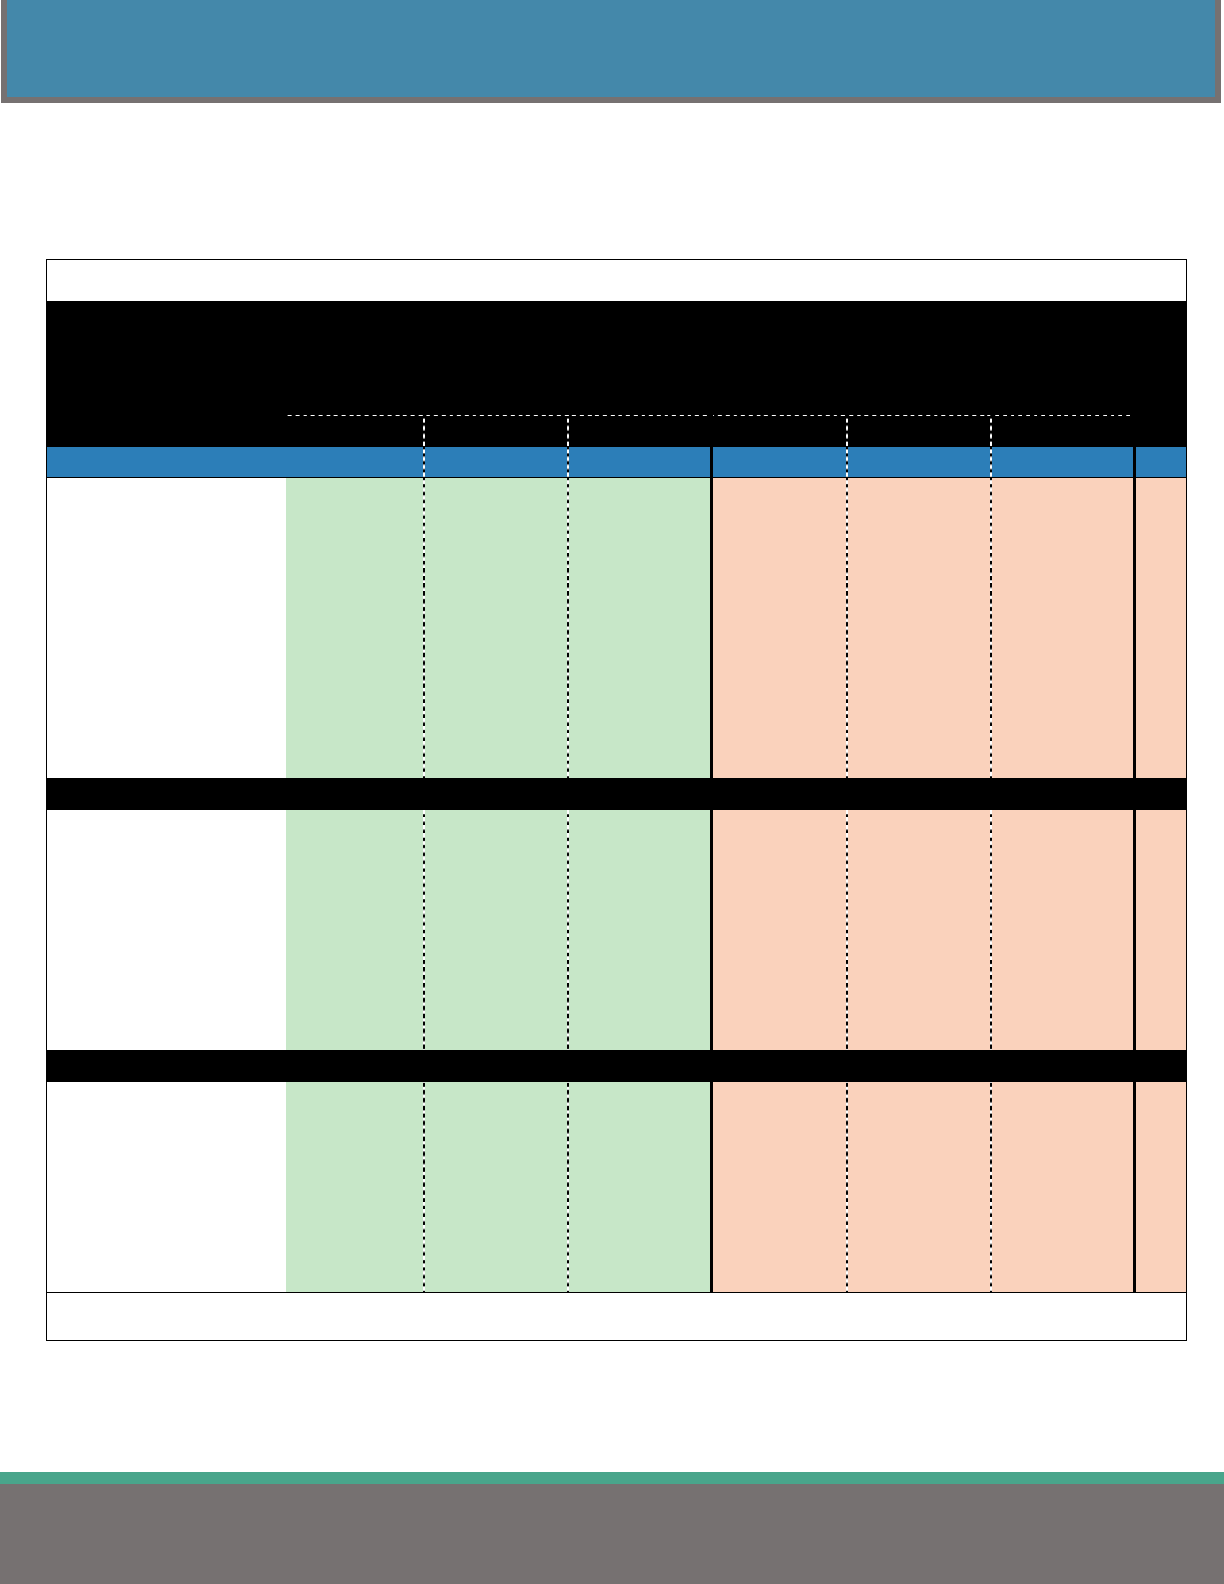
41
MEDICAL INSURANCE – HDHPs
2022HEALTHINSURANCEREPORT
OUT-OF-POCKET MAXIMUMS
Tables 33 and 34 display the average, minimum, and maximum out-of-pocket maximums for single and
family medical coverage for all high deductible health plans reported.
Table 33
Average In-Network Out-of-Pocket Maximums
(HDHPs)
Single Family
Comparison Group Average Minimum Maximum Average Minimum Maximum n
STATEWIDE $ 4,210 $ 0 $ 10,000 $ 8,342 $ 0 $ 21,000 938
State of Ohio $ 3,500 $ 3,500 $ 3,500 $ 7,000 $ 7,000 $ 7,000 1
Counties $ 4,125 $ 1,400 $ 7,150 $ 8,281 $ 2,800 $ 14,300 59
Cities $ 3,969 $ 0 $ 10,000 $ 7,788 $ 0 $ 15,000 180
Townships $ 4,588 $ 0 $ 8,000 $ 9,170 $ 0 $ 20,000 95
School Districts & ESCs $ 4,110 $ 0 $ 8,700 $ 8,126 $ 0 $ 20,000 510
Colleges & Universities $ 4,585 $ 0 $ 8,150 $ 9,076 $ 0 $ 14,000 38
Fire Districts $ 5,067 $ 3,000 $ 7,950 $ 10,133 $ 6,000 $ 15,900 15
Metro Housing Authorities $ 5,217 $ 0 $ 10,000 $ 10,774 $ 0 $ 21,000 29
Port Authorities $ 4,163 $ 2,500 $ 6,350 $ 8,325 $ 5,000 $ 12,700 4
Regional Transit Authorities $ 5,471 $ 3,000 $ 7,500 $ 10,943 $ 6,000 $ 15,000 7
REGION
1 - Akron/Canton $ 4,172 $ 0 $ 8,150 $ 8,183 $ 0 $ 20,000 51
2 - Cincinnati $ 4,036 $ 0 $ 7,950 $ 8,078 $ 0 $ 15,900 135
3 - Cleveland $ 4,671 $ 0 $ 10,000 $ 9,308 $ 0 $ 17,100 109
4 - Columbus $ 4,296 $ 0 $ 8,000 $ 8,401 $ 0 $ 20,000 197
5 - Dayton $ 3,736 $ 0 $ 8,000 $ 7,493 $ 0 $ 21,000 177
6 - Southeast Ohio $ 4,471 $ 1,000 $ 7,150 $ 9,143 $ 2,000 $ 14,300 76
7 - Toledo $ 4,248 $ 1,000 $ 10,000 $ 8,179 $ 2,000 $ 20,000 153
8 - Warren/Youngstown $ 4,620 $ 0 $ 7,500 $ 9,373 $ 0 $ 15,000 40
EMPLOYEES COVERED
1 - 49 $ 4,593 $ 0 $ 8,000 $ 9,355 $ 0 $ 21,000 192
50 - 99 $ 4,055 $ 250 $ 8,700 $ 7,977 $ 500 $ 20,000 165
100 - 149 $ 4,270 $ 0 $ 10,000 $ 8,376 $ 0 $ 20,000 179
150 - 249 $ 4,005 $ 0 $ 10,000 $ 7,820 $ 0 $ 16,000 192
250 - 499 $ 4,192 $ 1,000 $ 8,550 $ 8,295 $ 2,000 $ 20,000 122
500 - 999 $ 4,170 $ 1,500 $ 8,550 $ 8,281 $ 3,000 $ 17,100 55
1,000 or more $ 3,803 $ 0 $ 7,000 $ 7,579 $ 0 $ 14,000 33
Note: Excludes plans that have unlimited out-of-network maximums.
Note: n: number of plans.
Regional Transit Authorities have the highest reported average out-of-pocket maximums for
single and family plans.
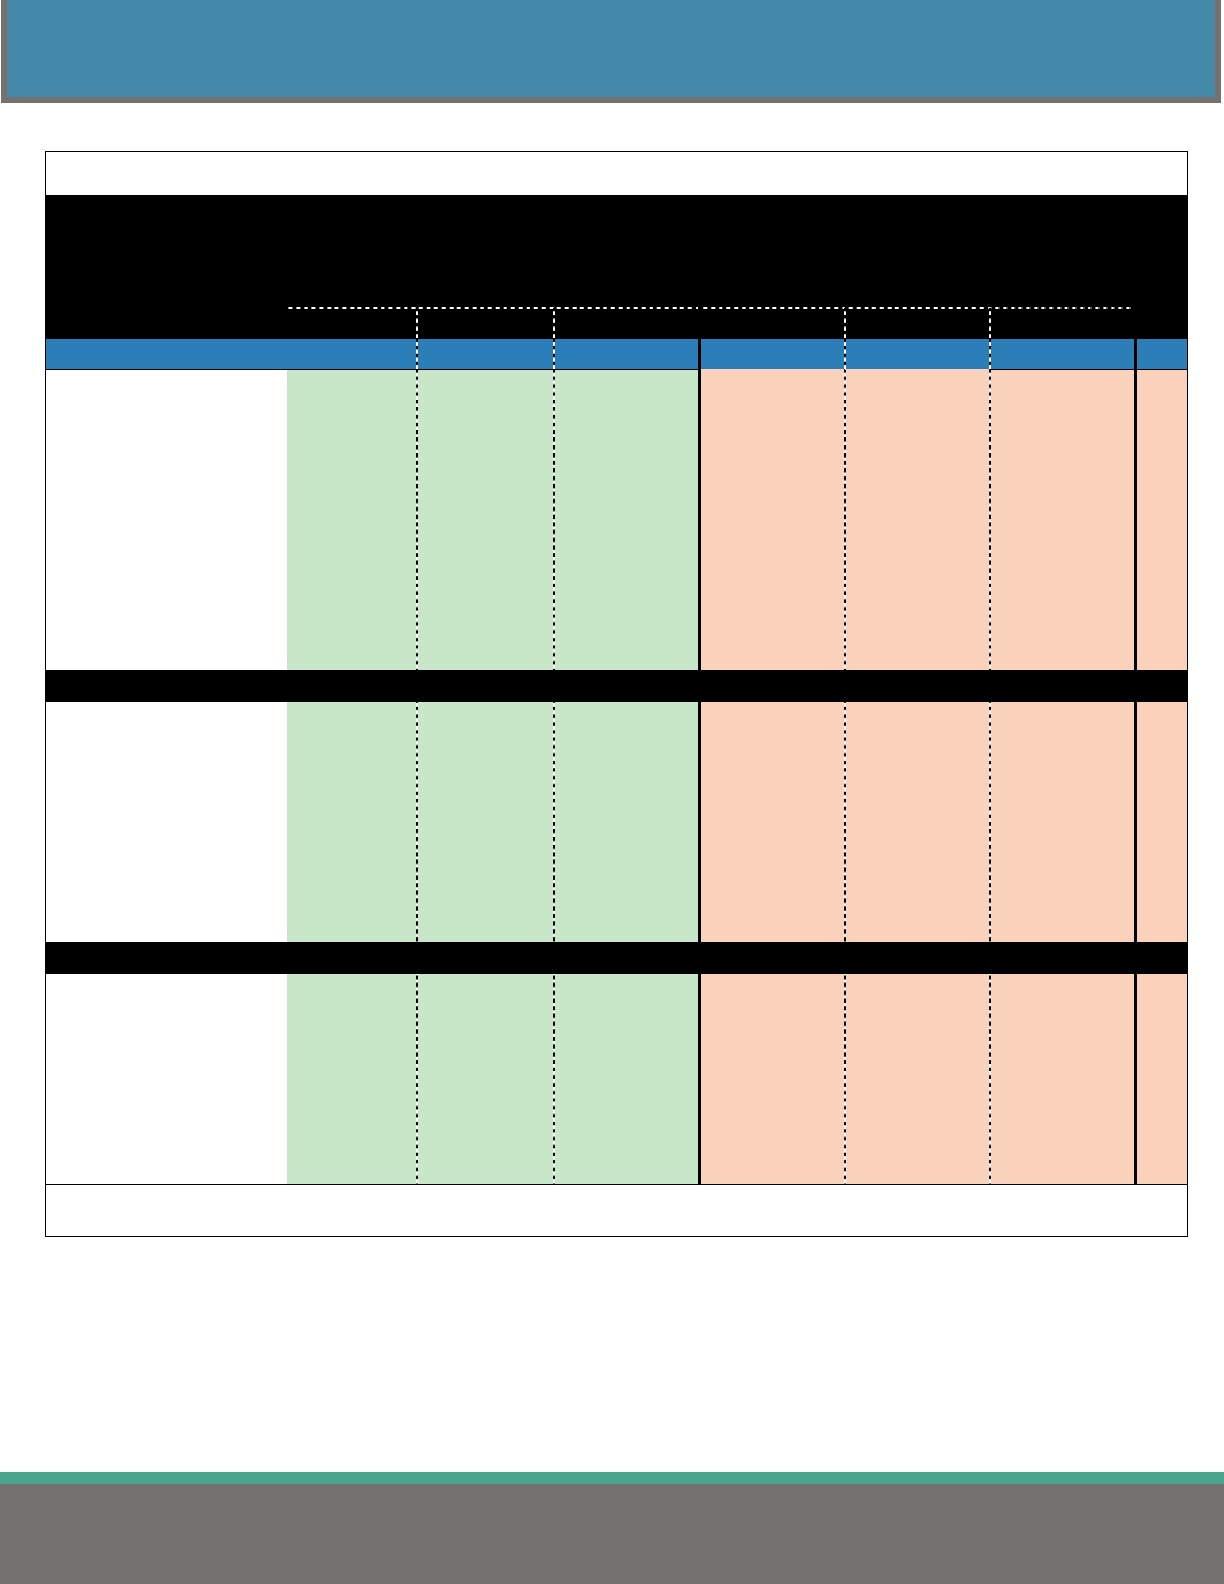
42
MEDICAL INSURANCE – HDHPs
2022HEALTHINSURANCEREPORT
Table 34
Average Non-Network Out-of-Pocket Maximums
(HDHPs)
Single Family
Comparison Group Average Minimum Maximum Average Minimum Maximum n
STATEWIDE $ 9,240 $ 0 $ 32,600 $ 18,141 $ 0 $ 64,800 938
State of Ohio $ 7,000 $ 7,000 $ 7,000 $ 14,000 $ 14,000 $ 14,000 1
Counties $ 8,686 $ 0 $ 20,000 $ 16,841 $ 0 $ 40,000 59
Cities $ 9,954 $ 0 $ 32,400 $ 19,714 $ 0 $ 64,800 180
Townships $ 12,101 $ 1,000 $ 25,000 $ 24,755 $ 4,000 $ 48,000 95
School Districts & ESCs $ 8,011 $ 0 $ 32,600 $ 15,628 $ 0 $ 41,400 510
Colleges & Universities $ 10,790 $ 4,100 $ 28,000 $ 19,947 $ 8,000 $ 40,000 38
Fire Districts $ 14,348 $ 3,000 $ 23,850 $ 28,700 $ 6,000 $ 47,700 15
Metro Housing Authorities $ 13,837 $ 3,000 $ 22,500 $ 28,415 $ 6,000 $ 45,000 29
Port Authorities $ 6,800 $ 2,000 $ 12,500 $ 8,463 $ 5,000 $ 12,700 4
Regional Transit Authorities $ 11,450 $ 5,300 $ 22,500 $ 22,900 $ 10,600 $ 45,000 7
REGION
1 - Akron/Canton $ 11,065 $ 1,000 $ 32,600 $ 20,407 $ 1,900 $ 44,100 51
2 - Cincinnati $ 9,395 $ 0 $ 23,850 $ 19,065 $ 0 $ 47,700 135
3 - Cleveland $ 10,582 $ 0 $ 32,400 $ 21,334 $ 0 $ 64,800 109
4 - Columbus $ 8,958 $ 400 $ 22,225 $ 17,638 $ 0 $ 44,500 197
5 - Dayton $ 8,676 $ 2,000 $ 28,000 $ 16,869 $ 4,000 $ 48,000 177
6 - Southeast Ohio $ 9,928 $ 0 $ 20,700 $ 20,121 $ 0 $ 41,400 76
7 - Toledo $ 7,459 $ 1,000 $ 25,000 $ 14,186 $ 900 $ 40,000 153
8 - Warren/Youngstown $ 11,805 $ 0 $ 22,500 $ 22,668 $ 0 $ 45,000 40
EMPLOYEES COVERED
1 - 49 $ 11,653 $ 0 $ 24,000 $ 23,371 $ 0 $ 48,000 192
50 - 99 $ 9,650 $ 3,000 $ 32,400 $ 18,737 $ 0 $ 64,800 165
100 - 149 $ 9,002 $ 0 $ 32,600 $ 17,120 $ 0 $ 44,100 179
150 - 249 $ 8,006 $ 1,000 $ 20,400 $ 15,986 $ 4,000 $ 40,000 192
250 - 499 $ 8,468 $ 2,000 $ 32,600 $ 16,425 $ 900 $ 40,000 122
500 - 999 $ 7,756 $ 0 $ 15,000 $ 15,343 $ 0 $ 30,000 55
1,000 or more $ 7,030 $ 3,500 $ 12,000 $ 14,115 $ 7,000 $ 24,000 33
Note: Excludes plans that have unlimited out-of-network maximums.
Note: n: number of plans.
Fire Districts have the highest reported average non-network out-of-pocket maximums for single
and family plans.
Port Authorities have the lowest reported average non-network out-of-pocket maximums for single
and family plans.
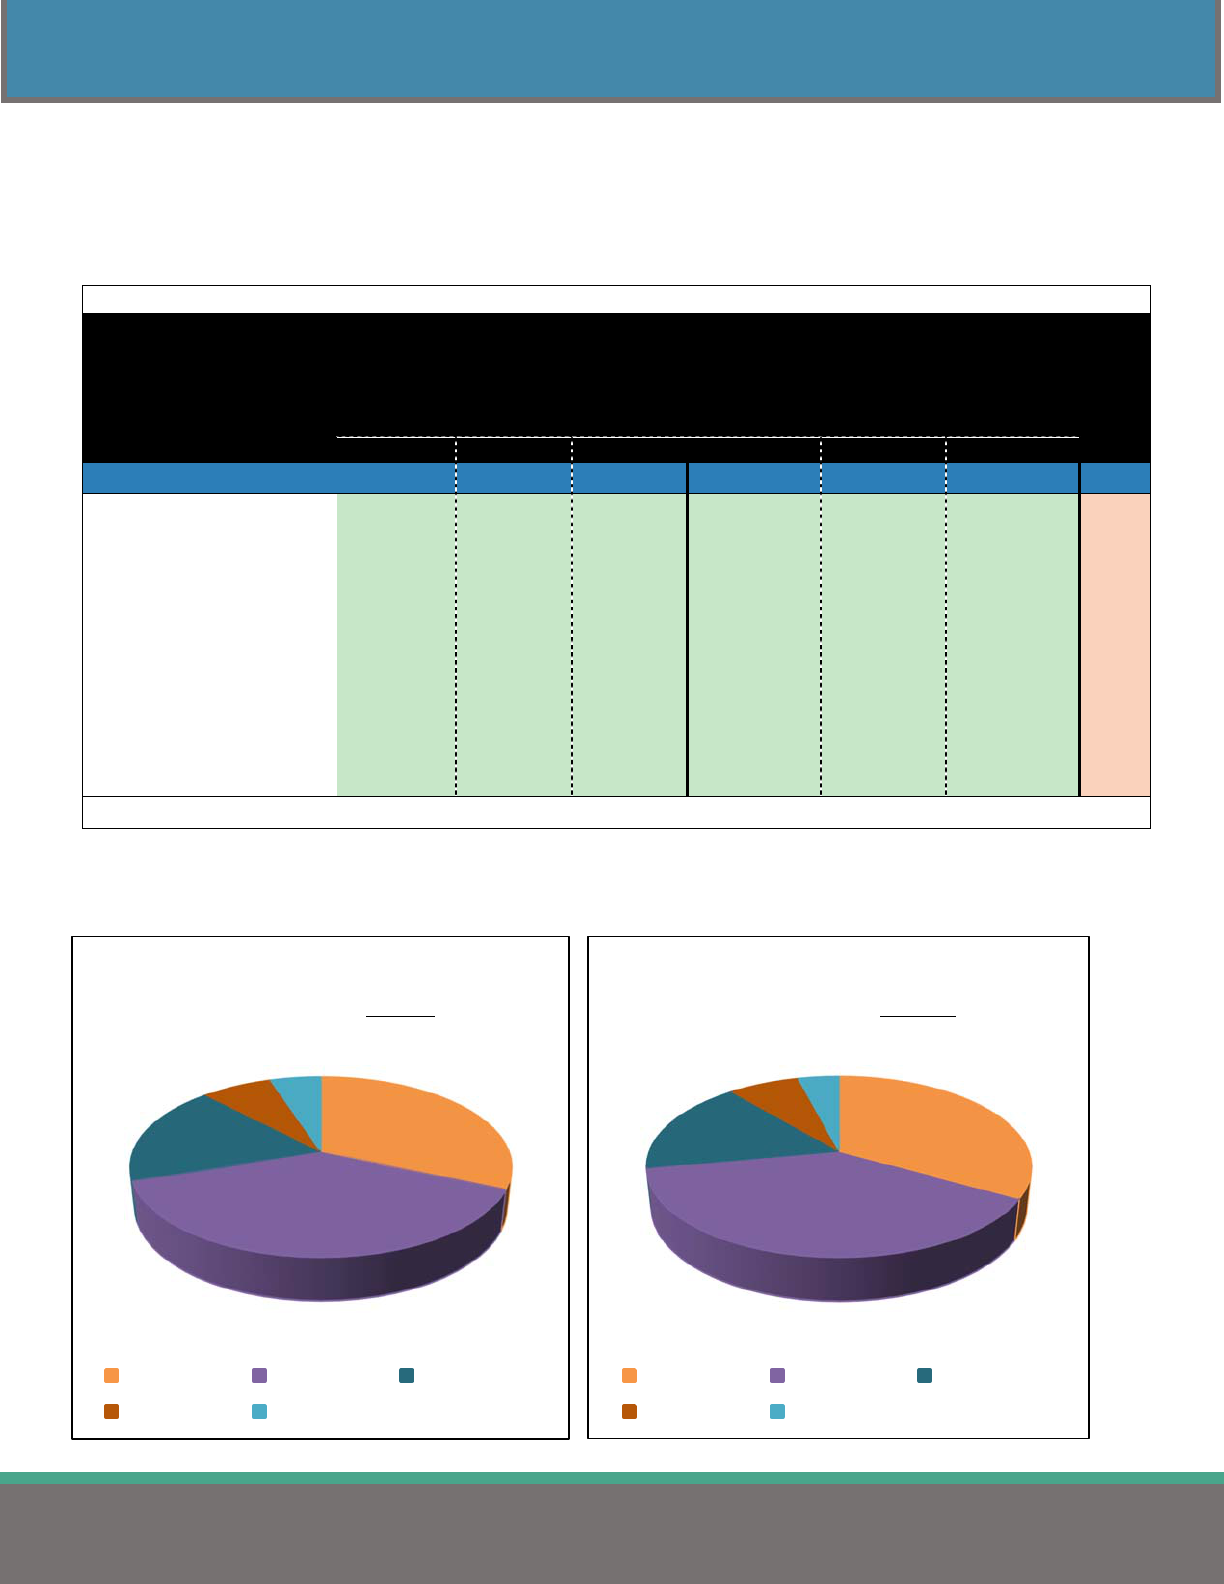
43
MEDICAL INSURANCE – HDHPs
2022HEALTHINSURANCEREPORT
HEALTH SAVINGS ACCOUNT
A health savings account (HSA) is a tax-exempt account used to pay or reimburse certain medical
expenses incurred by the employee. Table 35 provides the average annual employer contributions towards
an HSA for employers enrolled in a high deductible health plan.
Table 35
Health Savings Accounts
Average Annual Employer Contribution Amount
Single Family
Comparison Group
Average Minimum Maximum Average Minimum Maximum n
STATEWIDE $ 1,252 $ 150 $ 7,000 $ 2,432 $ 300 $ 14,636 397
State of Ohio $ 1,000 $ 1,000 $ 1,000 $ 2,000 $ 2,000 $ 2,000 1
Counties $ 990 $ 150 $ 2,500 $ 1,895 $ 300 $ 5,000 29
Cities $ 1,405 $ 250 $ 3,275 $ 2,826 $ 500 $ 6,550 54
Townships $ 2,013 $ 400 $ 7,000 $ 3,754 $ 800 $ 10,000 31
School Districts & ESCs $ 1,183 $ 300 $ 5,741 $ 2,303 $ 500 $ 14,636 258
Colleges & Universities $ 1,010 $ 500 $ 1,960 $ 1,925 $ 1,000 $ 3,500 14
Fire Districts $ 1,000 $ 1,000 $ 1,000 $ 4,000 $ 4,000 $ 4,000 1
Metro Housing $ 1,000 $ 500 $ 1,800 $ 1,600 $ 900 $ 3,000 6
Port Authorities $ 788 $ 700 $ 875 $ 1,575 $ 1,400 $ 1,750 2
Regional Transit Authorities $ 950 $ 950 $ 950 $ 1,800 $ 1,800 $ 1,800 1
Note: n: number of employers.
Figures 15 and 16 group the employer’s HSA contribution into categories by contribution amount.
Figure 15 Figure 16
31.7%
38.0%
18.1%
7.1%
5.1%
HSAEmployerContribution
ByCategory‐ Single
$0‐$999 $1,000‐$1,499 $1,500‐$1,999
$2,000‐$2,499 $2,500ormore
33.2%
38.8%
16.9%
7.1%
4.0%
HSAEmployerContribution
ByCategory‐ Family
$0‐$1,999 $2,000‐$2,999 $3,000‐$3,999
$4,000‐$4,999 $5,000ormore
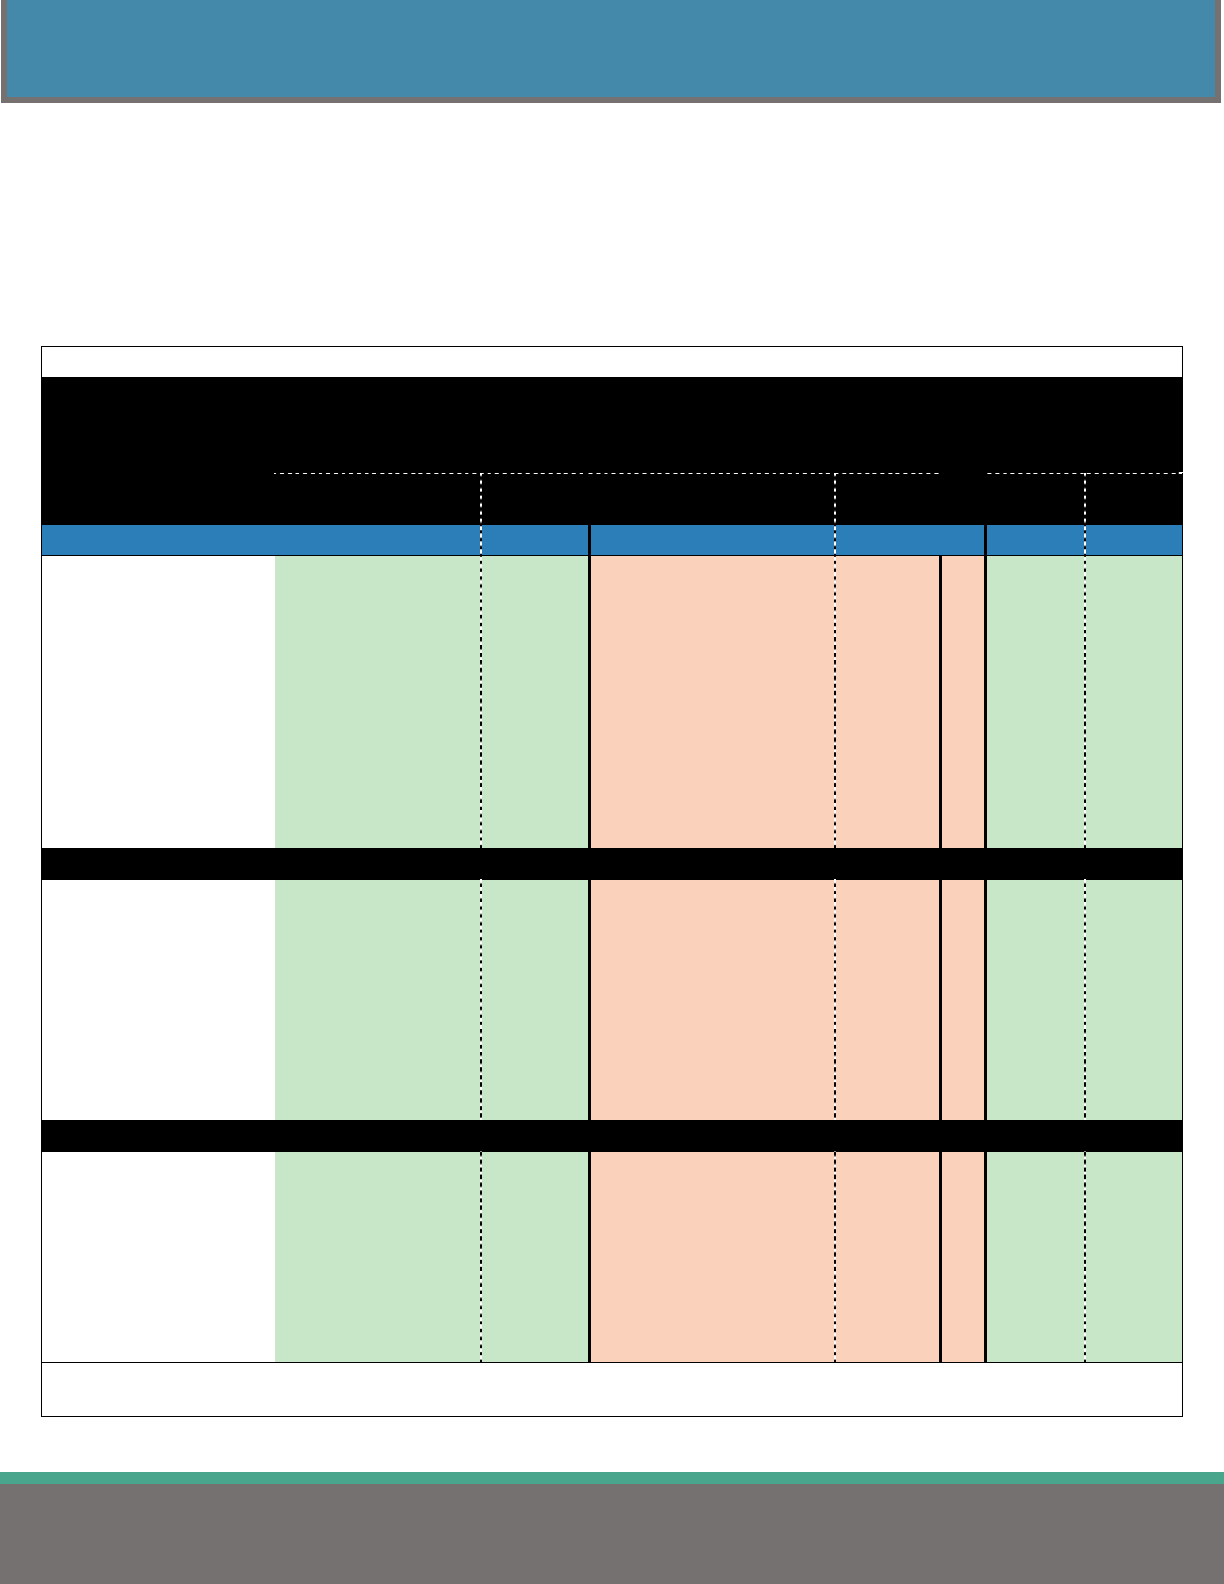
44
PRESCRIPTION INSURANCE
2022HEALTHINSURANCEREPORT
PRESCRIPTION INSURANCE
PRESCRIPTION CARVE-OUT PREMIUMS
Table 36 shows the employer and employee prescription premiums when purchased in a separate plan.
These costs are not included in the medical premium.
Table 36
Average Monthly Prescription Premiums and Employer/Employee Contributions
Single Family Single Family
Com
p
arison Grou
p
Employer
Share
Employee
Share
Total
Premium
Employer
Share
Employee
Share
Total
Premium n
Employee
Share
Employee
Share
STATEWIDE $ 144.60 $ 16.70 $ 161.30 $ 326.40 $ 43.57 $ 369.97 85 10.4% 11.8%
State of Ohio - - - - - - 0 - -
Counties $ 136.88 $ 9.49 $ 146.37 $ 356.20 $ 29.44 $ 385.64 8 6.5% 7.6%
Cities $ 222.47 $ 16.74 $ 239.21 $ 444.35 $ 38.90 $ 483.25 9 7.0% 8.0%
Townships - - - - - - 0 - -
School Districts & ESCs $ 137.38 $ 17.56 $ 154.94 $ 308.76 $ 45.82 $ 354.58 68 11.3% 12.9%
Colleges & Universities - - - - - - 0 - -
Fire Districts - - - - - - 0 - -
Metro Housing Authorities - - - - - - 0 - -
Port Authorities - - - - - - 0 - -
Regional Transit Authorities - - - - - - 0 - -
REGION
1 - Akron/Canton $ 140.15 $ 24.75 $ 164.90 $ 355.12 $ 64.10 $ 419.22 15 15.0% 15.3%
2 - Cincinnati $ 357.81 $ 29.91 $ 387.72 $ 892.79 $ 75.17 $ 967.96 2 7.7% 7.8%
3 - Cleveland $ 122.19 $ 15.21 $ 137.40 $ 277.48 $ 34.42 $ 311.90 38 11.1% 11.0%
4 - Columbus $ 173.78 $ 16.98 $ 190.76 $ 316.94 $ 36.64 $ 353.58 5 8.9% 10.4%
5 - Dayton - - - - - - 0 - -
6 - Southeast Ohio $ 178.69 $ 18.83 $ 197.52 $ 257.85 $ 83.50 $ 341.35 8 9.5% 24.5%
7 - Toledo $ 143.73 $ 10.73 $ 154.46 $ 313.06 $ 22.94 $ 336.00 9 6.9% 6.8%
8 - Warren/Youngstown $ 156.09 $ 9.16 $ 165.25 $ 445.03 $ 24.56 $ 469.59 8 5.5% 5.2%
EMPLOYEES COVERED
1 - 49 $ 140.68 $ 0.00 $ 140.68 - - - 1 0.0% -
50 - 99 $ 169.46 $ 28.70 $ 198.16 $ 416.52 $ 70.38 $ 486.90 12 14.5% 14.5%
100 - 149 $ 139.57 $ 14.12 $ 153.69 $ 357.06 $ 34.76 $ 391.82 26 9.2% 8.9%
150 - 249 $ 196.95 $ 22.34 $ 219.29 $ 321.34 $ 40.26 $ 361.60 7 10.2% 11.1%
250 - 499 $ 126.36 $ 12.45 $ 138.81 $ 269.36 $ 43.81 $ 313.17 27 9.0% 14.0%
500 - 999 $ 123.40 $ 15.92 $ 139.32 $ 295.39 $ 38.47 $ 333.86 7 11.4% 11.5%
1,000 or more $ 172.56 $ 20.63 $ 193.19 $ 285.42 $ 42.59 $ 328.01 5 10.7% 13.0%
Note: Includes plans where employees contribute $0 to the medical premium.
Note: n: number of plans.
45
PRESCRIPTION INSURANCE
2022HEALTHINSURANCEREPORT
PRESCRIPTION COPAYS/COINSURANCE – ALL PLAN TYPES
Table 37 displays the average prescription retail copays and coinsurance amounts. The data in this table
includes all prescription plans reported regardless if they are in a separate carved-out plan. This table
breaks down the data extracted from 2,015 prescription plans.
Table 37
Average Prescription Retail Copays/Coinsurance
Comparison Group Network n Non-Network n
Dollar Copay Amount
Generic $ 9.69 1,609 $ 9.89 554
Brand (Formulary) $ 27.23 1,566 $ 9.89 554
Brand (Non-Formulary) $ 46.85 1,497 $ 35.70 524
Cosmetic/Biologic $ 84.58 803 $ 50.67 379
Coinsurance Percentage
Generic 19.7% 674 40.4% 718
Brand (Formulary) 20.7% 698 40.9% 706
Brand (Non-Formulary) 27.4% 689 40.1% 685
Cosmetic/Biologic 22.4% 809 39.8% 618
Note: n: number of plans.
Table 38 displays the average prescription mail order copays and coinsurance amounts. The data in this
table includes all prescription plans reported regardless if they are in a separate carved-out plan. This
table breaks down the data extracted from 2,015 prescription plans.
Table 38
Average Prescription Mail Order Copays/Coinsurance
Comparison Group Network n Non-Network n
Dollar Copay Amount
Generic $ 18.58 1,615 $ 11.62 430
Brand (Formulary) $ 56.14 1,577 $ 30.01 421
Brand (Non-Formulary) $ 97.64 1,509 $ 48.74 412
Cosmetic/Biologic $ 118.75 718 $ 48.89 306
Coinsurance Percentage
Generic 20.0% 650 40.8% 540
Brand (Formulary) 20.9% 669 41.3% 535
Brand (Non-Formulary) 27.6% 656 39.8% 520
Cosmetic/Biologic 22.1% 728 39.6% 490
Note: n: number of plans.
46
DENTAL INSURANCE
2022HEALTHINSURANCEREPORT
DENTAL INSURANCE
DENTAL CARVE-OUT PREMIUMS
Table 39 displays the employer and employee dental premium contribution when purchased in a separate
plan. These costs are not included in the medical premium.
Table 39
Dental Carve-Out Premiums
Average Total Premium and Employer and Employee Share
Sin
g
le
Family Single Family
Com
p
arison Grou
p
Employer
Share
Employee
Share
Total
Premium
Employer
Share
Employee
Share
Total
Premium n
Employee
Share
Employee
Share
STATEWIDE $ 31.75 $ 6.77 $ 38.52 $ 83.83 $ 23.18 $ 107.01 872 17.6% 21.7%
State of Ohio $ 34.23 $ 0.00 $ 34.23 $ 99.19 $ 0.00 $ 99.19 1 0.0% 0.0%
Counties $ 13.58 $ 15.02 $ 28.60 $ 37.38 $ 52.46 $ 89.84 66 52.5% 58.4%
Cities $ 22.68 $ 8.34 $ 31.02 $ 66.77 $ 29.99 $ 96.76 149 26.9% 31.0%
Townships $ 28.83 $ 3.81 $ 32.64 $ 92.40 $ 13.78 $ 106.18 97 11.7% 13.0%
School Districts $ 38.57 $ 5.71 $ 44.28 $ 95.13 $ 18.06 $ 113.19 481 12.9% 16.0%
Colleges & Univ. $ 28.36 $ 8.99 $ 37.35 $ 72.73 $ 37.66 $ 110.39 32 24.1% 34.1%
Fire Districts $ 24.82 $ 5.11 $ 29.93 $ 86.04 $ 19.20 $ 105.24 10 17.1% 18.2%
Metro Housing $ 24.03 $ 6.19 $ 30.22 $ 70.09 $ 27.38 $ 97.47 26 20.5% 28.1%
Port Authorities $ 29.76 $ 1.55 $ 31.31 $ 108.72 $ 5.79 $ 114.51 3 5.0% 5.1%
Regional Transit
Authorities
$ 21.23 $ 5.33 $ 26.56 $ 67.56 $ 19.82 $ 87.38 7 20.1% 22.7%
REGION
1 - Akron/Canton $ 47.55 $ 7.17 $ 54.72 $ 125.01 $ 22.55 $ 147.56 140 13.1% 15.3%
2 - Cincinnati $ 26.72 $ 6.71 $ 33.43 $ 77.03 $ 21.40 $ 98.43 94 20.1% 21.7%
3 - Cleveland $ 28.69 $ 5.01 $ 33.70 $ 80.42 $ 16.93 $ 97.35 142 14.9% 17.4%
4 - Columbus $ 32.96 $ 6.46 $ 39.42 $ 82.79 $ 23.14 $ 105.93 150 16.4% 21.8%
5 - Dayton $ 24.32 $ 8.40 $ 32.72 $ 62.65 $ 29.23 $ 91.88 130 25.7% 31.8%
6 - Southeast Ohio $ 29.70 $ 4.61 $ 34.31 $ 70.00 $ 20.11 $ 90.11 67 13.4% 22.3%
7 - Toledo $ 27.37 $ 11.50 $ 38.87 $ 71.01 $ 38.53 $ 109.54 84 29.6% 35.2%
8 – Warren
Youngstown
$ 31.80 $ 3.65 $ 35.45 $ 88.93 $ 11.94 $ 100.87 65 10.3% 11.8%
EMPLOYEES COVERED
1 - 49 $ 24.95 $ 7.53 $ 32.48 $ 74.54 $ 27.66 $ 102.20 175 23.2% 27.1%
50 - 99 $ 29.74 $ 6.65 $ 36.39 $ 82.60 $ 22.50 $ 105.10 141 18.3% 21.4%
100 - 149 $ 32.76 $ 7.14 $ 39.90 $ 83.99 $ 23.93 $ 107.92 158 17.9% 22.2%
150 - 249 $ 35.18 $ 6.45 $ 41.63 $ 88.87 $ 21.96 $ 110.83 165 15.5% 19.8%
250 - 499 $ 34.94 $ 6.61 $ 41.55 $ 87.02 $ 21.31 $ 108.33 144 15.9% 19.7%
500 - 999 $ 35.80 $ 5.58 $ 41.38 $ 92.67 $ 19.41 $ 112.08 53 13.5% 17.3%
1,000 or more $ 32.67 $ 5.78 $ 38.45 $ 82.54 $ 20.30 $ 102.84 36 15.0% 19.7%
Note: n: number of plans.
47
DENTAL INSURANCE
2022HEALTHINSURANCEREPORT
DENTAL MAXIMUM BENEFIT – ALL PLAN TYPES
Table 40 displays the average annual dental maximum benefit. The data in this table includes all dental
plans reported regardless if they are in a separate carved-out plan.
Table 40
Average Annual Dental Maximum Benefit
All Dental Plans Offered
Comparison Group Average Minimum Maximum n
STATEWIDE $ 1,675 $ 300 $ 6,000 1,196
State of Ohio $ 1,500 $ 1,500 $ 1,500 1
Counties $ 1,340 $ 1,000 $ 4,000 78
Cities $ 1,568 $ 750 $ 6,000 219
Townships $ 1,449 $ 475 $ 3,000 117
School Districts & ESCs $ 1,808 $ 300 $ 5,000 685
Colleges & Universities $ 1,494 $ 500 $ 3,000 36
Fire Districts $ 1,750 $ 1,000 $ 6,000 13
Metro Housing $ 1,445 $ 300 $ 4,000 32
Port Authorities $ 1,188 $ 1,000 $ 1,500 4
Regional Transit Authorities $ 1,231 $ 1,000 $ 2,100 11
REGION
1 – Akron/Canton $ 1,987 $ 750 $ 4,000 169
2 – Cincinnati $ 1,828 $ 500 $ 3,500 139
3 – Cleveland $ 1,795 $ 300 $ 6,000 184
4 – Columbus $ 1,576 $ 750 $ 3,000 207
5 – Dayton $ 1,407 $ 750 $ 5,000 151
6 – Southeast Ohio $ 1,419 $ 300 $ 6,000 99
7 – Toledo $ 1,639 $ 750 $ 4,000 153
8 – Warren/Youngstown $ 1,652 $ 750 $ 4,000 94
EMPLOYEES COVERED
1 – 49 $ 1,393 $ 300 $ 6,000 221
50 – 99 $ 1,621 $ 300 $ 4,000 201
100 – 149 $ 1,706 $ 750 $ 6,000 232
150 – 249 $ 1,698 $ 750 $ 4,000 248
250 – 499 $ 1,838 $ 750 $ 4,000 179
500 – 999 $ 1,981 $ 1,000 $ 3,300 70
1,000 or more $ 1,808 $ 500 $ 5,000 45
Note: Includes all dental plans offered.
Note: n: number of plans.
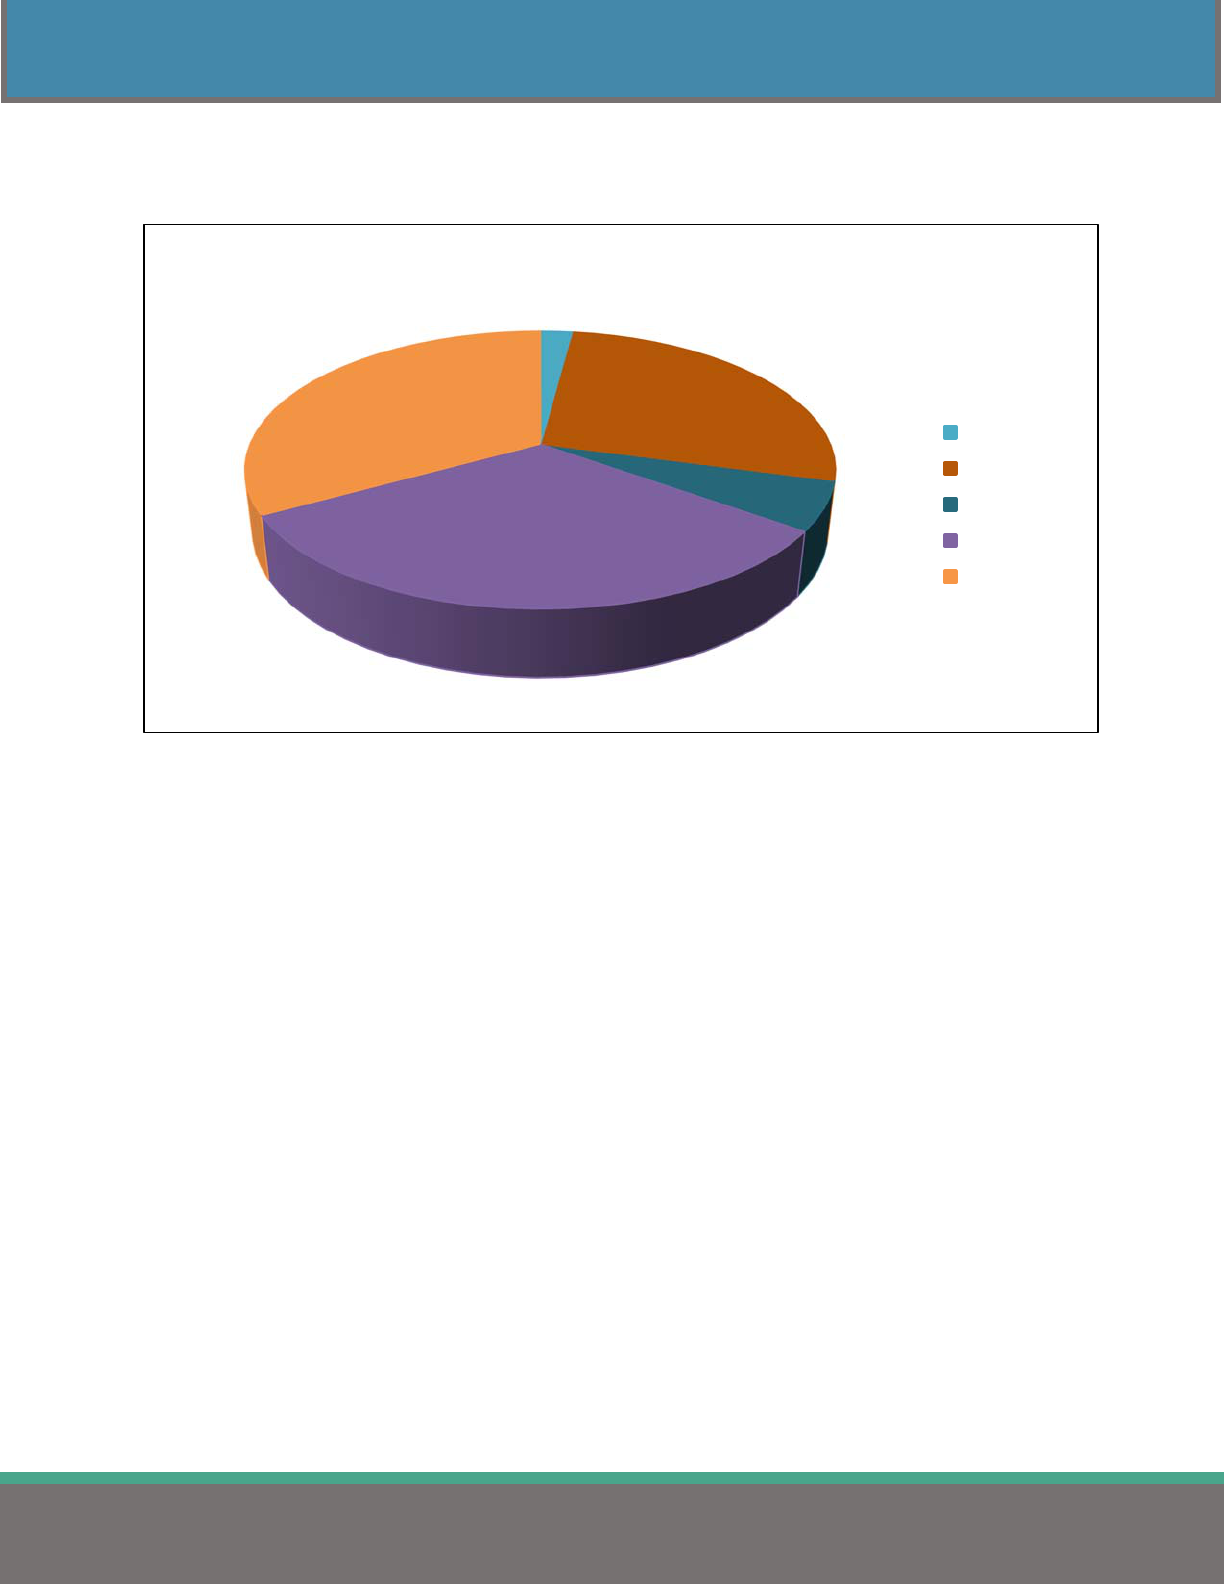
48
DENTAL INSURANCE
2022HEALTHINSURANCEREPORT
Figure 17 graphs the statewide average dental maximums by category. This figure includes the 1,196
dental plans reported in Table 40.
Figure 17
2.1%
27.1%
5.7%
32.0%
33.1%
StatewideAverageDentalMaximumbyCategory
$250‐$749
$750‐$999
$1,000‐$1,399
$1,400‐$1,599
$1,600‐$6,000

49
DENTAL INSURANCE
2022HEALTHINSURANCEREPORT
DENTAL COMPOSITE RATES
Table 41 shows the average, minimum, and maximum dental composite rates. Composite rates are flat
insurance premium rates offered to the employees regardless of choosing single or family coverage.
Table 41
Dental Carve-Out Monthly Premiums
Average Composite Rate Total Premium
Comparison Group Average Minimum Maximum n
STATEWIDE $ 81.48 $ 3.05 $ 166.00 206
State of Ohio - - - 0
Counties - - - 0
Cities $ 67.59 $ 7.63 $ 166.00 29
Townships $ 68.93 $ 20.00 $ 116.57 4
School Districts & ESCs $ 84.88 $ 41.04 $ 129.54 169
Colleges & Universities $ 71.91 $ 64.43 $ 79.38 2
Fire Districts $ 59.52 $ 59.52 $ 59.52 1
Metro Housing $ 3.05 $ 3.05 $ 3.05 1
Port Authorities - - - 0
Regional Transit Authorities - - - 0
REGION
1 - Akron/Canton $ 57.06 $ 8.00 $ 84.00 5
2 - Cincinnati $ 80.20 $ 17.50 $ 101.66 39
3 - Cleveland $ 71.78 $ 56.00 $ 91.15 14
4 - Columbus $ 82.39 $ 8.00 $ 113.72 49
5 - Dayton $ 91.24 $ 34.50 $ 129.54 17
6 - Southeast Ohio $ 68.60 $ 3.05 $ 122.40 24
7 - Toledo $ 88.53 $ 7.63 $ 119.61 52
8 - Warren/Youngstown $ 89.25 $ 59.52 $ 166.00 6
EMPLOYEES COVERED
1 - 49 $ 69.81 $ 3.05 $ 166.00 14
50 - 99 $ 82.43 $ 8.00 $ 129.54 40
100 - 149 $ 81.57 $ 7.63 $ 122.73 57
150 - 249 $ 85.92 $ 51.00 $ 122.40 53
250 - 499 $ 76.37 $ 41.04 $ 100.80 22
500 - 999 $ 84.78 $ 63.04 $ 102.64 13
1,000 or more $ 75.00 $ 40.75 $ 103.00 7
Note: Includes plans where the employee contributes $0 towards dental premium.
Note: n: number of plans.
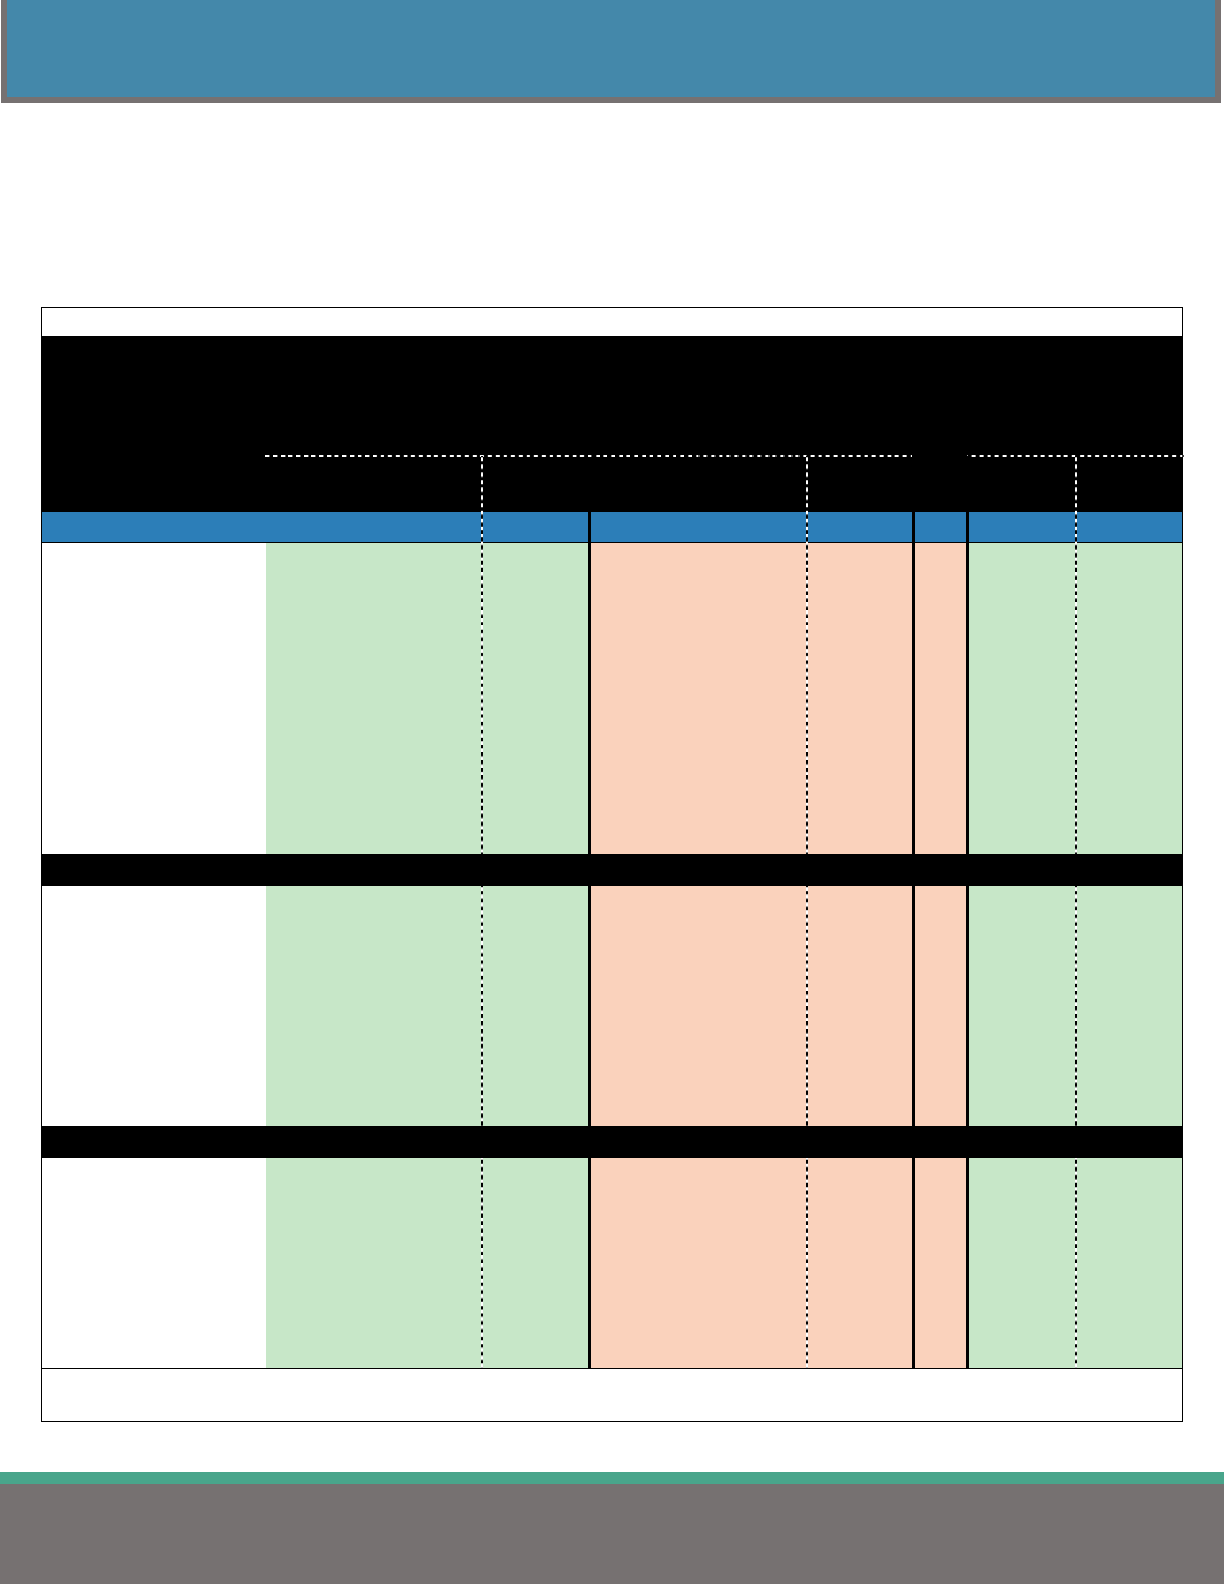
50
VISION INSURANCE
2022HEALTHINSURANCEREPORT
VISION INSURANCE
VISION CARVE-OUT PREMIUMS
Table 42 shows the employer and employee vision premiums when purchased in a separate plan. These
costs are not included in the medical premium.
Table 42
Vision Carve-Out Monthly Premiums
Average Total Premium and Employer and Employee Share
Sin
g
le Famil
y
Sin
g
le Famil
y
Comparison Group
Employer
Share
Employee
Share
Total
Premium
Employer
Share
Employee
Share
Total
Premium n
Employee
Share
Employee
Share
STATEWIDE $ 5.44 $ 3.39 $ 8.83 $ 13.22 $ 9.46 $ 22.68 837 38.4% 41.7%
State of Ohio $ 10.04 $ 0.00 $ 10.04 $ 27.61 $ 0.00 $ 27.61 1 0.0% 0.0%
Counties $ 3.15 $ 4.54 $ 7.69 $ 7.92 $ 12.85 $ 20.77 53 59.0% 61.9%
Cities $ 3.83 $ 3.64 $ 7.47 $ 9.41 $ 10.73 $ 20.14 125 48.7% 53.3%
Townships $ 7.63 $ 1.24 $ 8.87 $ 21.75 $ 4.02 $ 25.77 72 14.0% 15.6%
School Districts & ESCs $ 5.89 $ 3.55 $ 9.44 $ 13.80 $ 9.57 $ 23.37 514 37.6% 40.9%
Colleges & Universities $ 3.76 $ 4.14 $ 7.90 $ 8.79 $ 11.86 $ 20.65 30 52.4% 57.4%
Fire Districts $ 5.98 $ 2.98 $ 8.96 $ 16.76 $ 7.46 $ 24.22 9 33.3% 30.8%
Metro Housing Authorities $ 6.13 $ 2.07 $ 8.20 $ 13.55 $ 7.44 $ 20.99 24 25.2% 35.4%
Port Authorities $ 2.39 $ 3.29 $ 5.68 $ 6.63 $ 11.90 $ 18.53 2 57.9% 64.2%
Regional Transit
Authorities
$ 2.32 $ 2.84 $ 5.16 $ 6.05 $ 7.78 $ 13.83 7 55.0% 56.3%
REGION
1 - Akron/Canton $ 7.57 $ 3.32 $ 10.89 $ 18.94 $ 9.38 $ 28.32 97 30.5% 33.1%
2 - Cincinnati $ 3.00 $ 4.56 $ 7.56 $ 7.50 $ 12.69 $ 20.19 108 60.3% 62.9%
3 - Cleveland $ 6.22 $ 2.28 $ 8.50 $ 14.81 $ 6.49 $ 21.30 121 26.8% 30.5%
4 - Columbus $ 5.27 $ 4.18 $ 9.45 $ 12.95 $ 11.17 $ 24.12 158 44.2% 46.3%
5 - Dayton $ 4.40 $ 4.00 $ 8.40 $ 10.31 $ 10.98 $ 21.29 119 47.6% 51.6%
6 - Southeast Ohio $ 6.94 $ 2.90 $ 9.84 $ 14.60 $ 9.31 $ 23.91 66 29.5% 38.9%
7 - Toledo $ 5.55 $ 3.27 $ 8.82 $ 13.74 $ 8.67 $ 22.41 111 37.1% 38.7%
8 - Warren/Youngstown $ 5.45 $ 0.94 $ 6.39 $ 15.32 $ 2.58 $ 17.90 57 14.7% 14.4%
EMPLOYEES COVERED
1 - 49 $ 6.51 $ 2.60 $ 9.11 $ 17.23 $ 7.62 $ 24.85 137 28.5% 30.7%
50 - 99 $ 5.60 $ 2.80 $ 8.40 $ 13.59 $ 8.04 $ 21.63 134 33.3% 37.2%
100 - 149 $ 5.91 $ 3.57 $ 9.48 $ 14.40 $ 9.54 $ 23.94 167 37.7% 39.8%
150 - 249 $ 5.56 $ 3.50 $ 9.06 $ 13.02 $ 9.32 $ 22.34 180 38.6% 41.7%
250 - 499 $ 4.90 $ 3.86 $ 8.76 $ 10.90 $ 11.33 $ 22.23 132 44.1% 51.0%
500 - 999 $ 2.23 $ 5.16 $ 7.39 $ 5.60 $ 13.71 $ 19.31 49 69.8% 71.0%
1,000 or more $ 4.47 $ 3.05 $ 7.52 $ 11.29 $ 9.47 $ 20.76 38 40.6% 45.6%
Note: Includes plans where employees contribute $0 to the medical premium.
Note: n: number of plans.

51
VISION INSURANCE
2022HEALTHINSURANCEREPORT
VISION COMPOSITE RATES
Table 43 shows the average, minimum, and maximum vision composite rates. Composite rates are flat
insurance premium rates offered to the employees regardless of choosing single or family coverage.
Table 43
Vision Carve-Out Monthly Premiums
Average Composite Rate Total Premium
Comparison Group Average Minimum Maximum n
STATEWIDE $ 20.05 $ 1.15 $ 100.89 85
State of Ohio - - - 0
Counties - - - 0
Cities $ 18.40 $ 1.15 $ 41.00 20
Townships $ 22.52 $ 12.72 $ 39.67 12
School Districts & ESCs $ 19.16 $ 6.65 $ 100.89 49
Colleges & Universities $ 20.36 $ 20.36 $ 20.36 1
Fire Districts $ 15.24 $ 5.98 $ 24.50 2
Metro Housing - - - 0
Port Authorities - - - 0
Regional Transit Authorities $ 76.25 $ 76.25 $ 76.25 1
REGION
1 - Akron/Canton $ 22.69 $ 5.98 $ 76.25 10
2 - Cincinnati $ 15.48 $ 6.65 $ 27.33 12
3 - Cleveland $ 15.13 $ 1.15 $ 36.00 9
4 - Columbus $ 20.43 $ 7.04 $ 39.67 28
5 - Dayton $ 14.30 $ 1.65 $ 22.91 3
6 - Southeast Ohio $ 22.01 $ 11.16 $ 47.00 14
7 - Toledo $ 14.81 $ 7.63 $ 18.87 5
8 - Warren/Youngstown $ 39.54 $ 8.03 $ 100.89 4
EMPLOYEES COVERED
1 - 49 $ 23.42 $ 5.98 $ 41.00 16
50 - 99 $ 15.91 $ 1.65 $ 35.12 18
100 - 149 $ 22.55 $ 7.63 $ 100.89 22
150 - 249 $ 23.33 $ 11.84 $ 76.25 13
250 - 499 $ 17.01 $ 1.15 $ 36.00 11
500 - 999 $ 9.27 $ 7.04 $ 11.50 2
1,000 or more $ 12.64 $ 9.03 $ 17.62 3
Note: Includes plans where the employee contributes $0 towards vision premium.
Note: n: number of plans.

52
LIFE INSURANCE
2022HEALTHINSURANCEREPORT
LIFE INSURANCE
Table 44 shows the average total monthly premium of life insurance per $1,000 of coverage.
Table 44
Average Total Monthly Life Insurance Premium
per $1,000 of Coverage
Comparison Group Amount n
STATEWIDE $ 0.16 1,195
State of Ohio $ 0.12 1
Counties $ 0.19 77
Cities $ 0.20 225
Townships $ 0.26 113
School Districts & ESCs $ 0.12 681
Colleges & Universities $ 0.15 36
Fire Districts $ 0.17 13
Metro Housing $ 0.34 32
Port Authorities $ 0.13 4
Regional Transit Authorities $ 0.35 13
REGION
1 - Akron/Canton $ 0.18 168
2 - Cincinnati $ 0.13 140
3 - Cleveland $ 0.16 180
4 - Columbus $ 0.18 210
5 - Dayton $ 0.13 153
6 - Southeast Ohio $ 0.17 97
7 - Toledo $ 0.14 151
8 - Warren/Youngstown $ 0.20 96
EMPLOYEES COVERED
1 - 49 $ 0.25 218
50 - 99 $ 0.15 203
100 - 149 $ 0.15 232
150 - 249 $ 0.13 247
250 - 499 $ 0.13 180
500 - 999 $ 0.15 70
1,000 or more $ 0.17 45
Note: n: number of plans.

53
COST SAVINGS
2022HEALTHINSURANCEREPORT
COST SAVINGS
CONSORTIUMS
A health insurance consortium is an association of employers who purchase health insurance at a group
rate. Consortiums spread out the cost of administration and can assist with obtaining better discounts by
increasing the risk pool.
Table 45 shows the variation in average medical insurance costs for consortium members versus non-
members. The average monthly premium cost per employee for consortium members tends to be less than
employers who do not belong to a consortium.
Table 45
Average Total Monthly Premium Cost
By Consortium Membership
Consortium
Member
Consortium
Non-Member
Single $ 762.86 $ 762.53
Family $ 1,985.38 $ 2,050.92
Number of plans (n) 1,328 718
Note: Joint Purchasing Arrangement examples: council of government, consortium, cooperative, and multiple employer
welfare agreement (MEWA).
Note: Excludes Carved-out prescription premiums.
Note: n: number of plans.
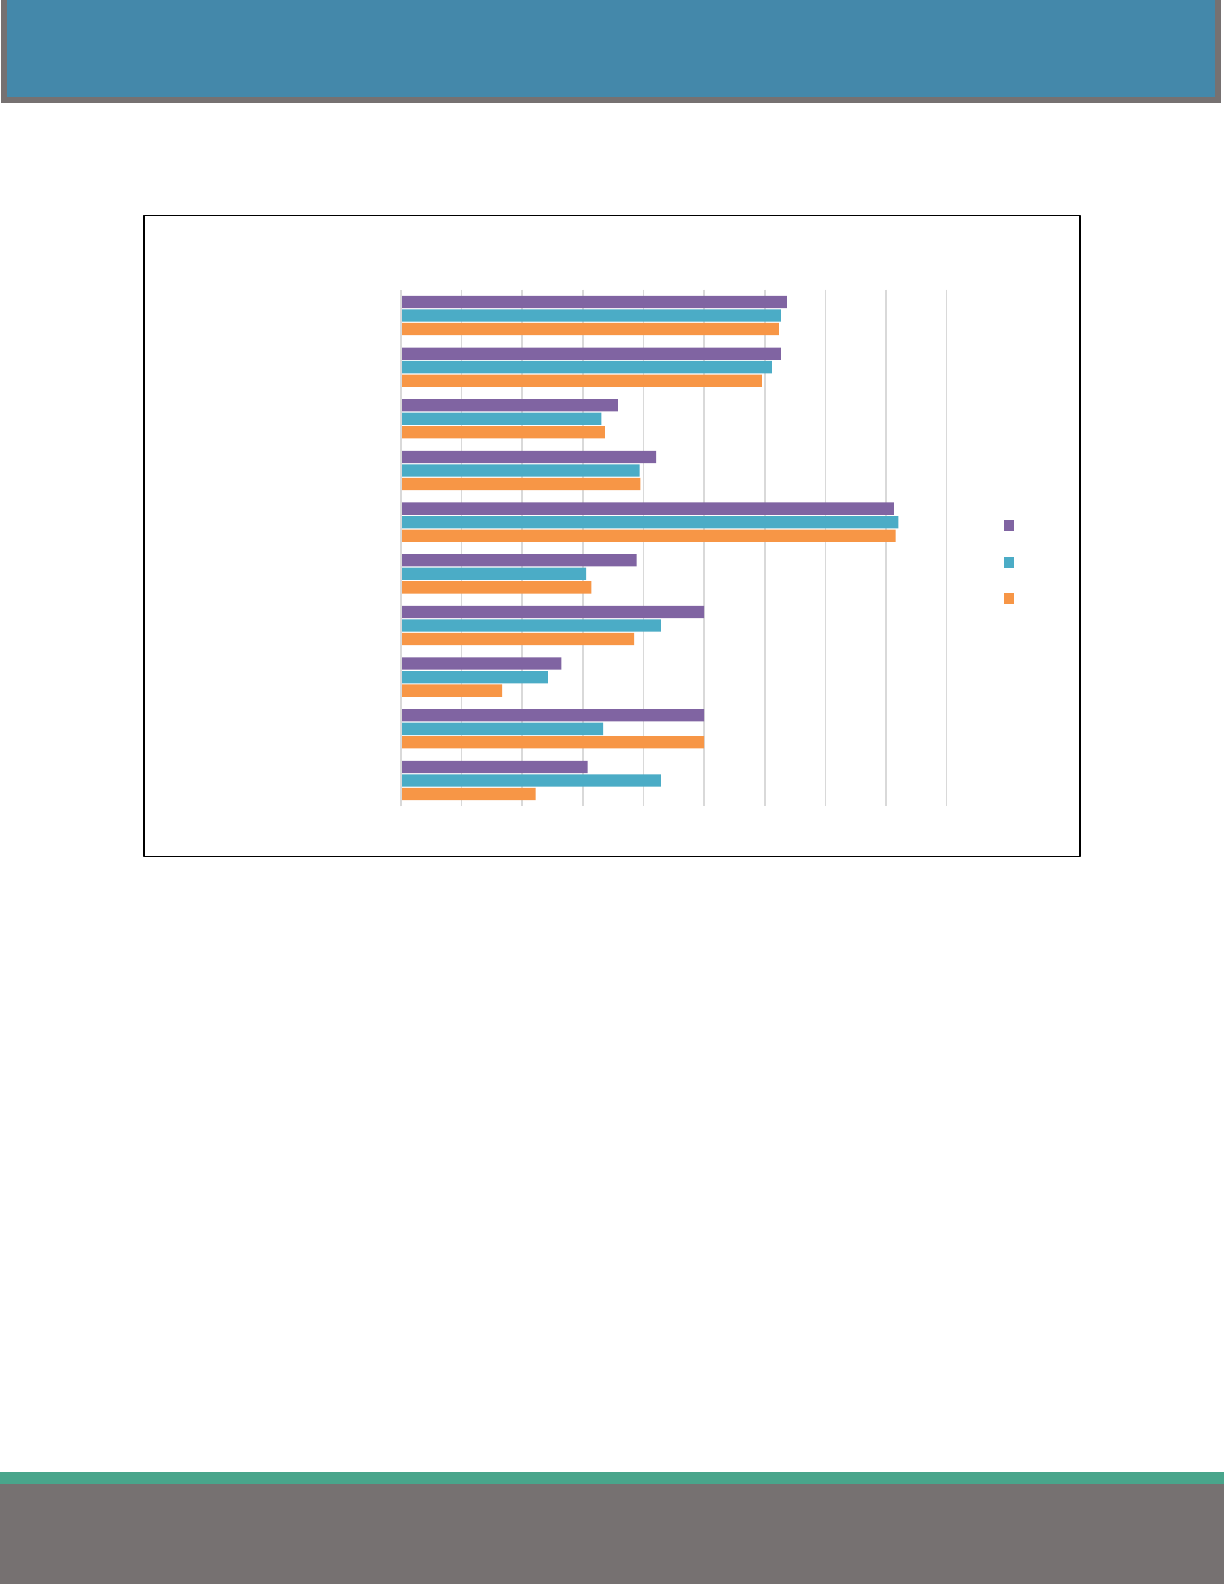
54
COST SAVINGS
2022HEALTHINSURANCEREPORT
Figure 18 illustrates the wide variations in consortium membership by jurisdiction.
Figure 18
School districts continue to have the highest consortia membership. Joint purchasing was part of
the School Employee’s Health Care Board’s “Best Practices,” explaining the much higher
frequency of consortium membership for school districts and educational service centers.
30.8%
50.0%
26.5%
50.0%
38.9%
81.3%
42.1%
35.8%
62.7%
63.7%
0.0% 10.0% 20.0% 30.0% 40.0% 50.0% 60.0% 70.0% 80.0% 90.0%
RegionalTransitAuthorities
PortAuthorities
MetroHousingAuthorities
FireDistricts
Colleges&Universities
SchoolDistricts&ESCs
Townships
Cities
Counties
STATEWIDE
PercentofEmployersBelongingtoConsortiums
2022
2021
2020
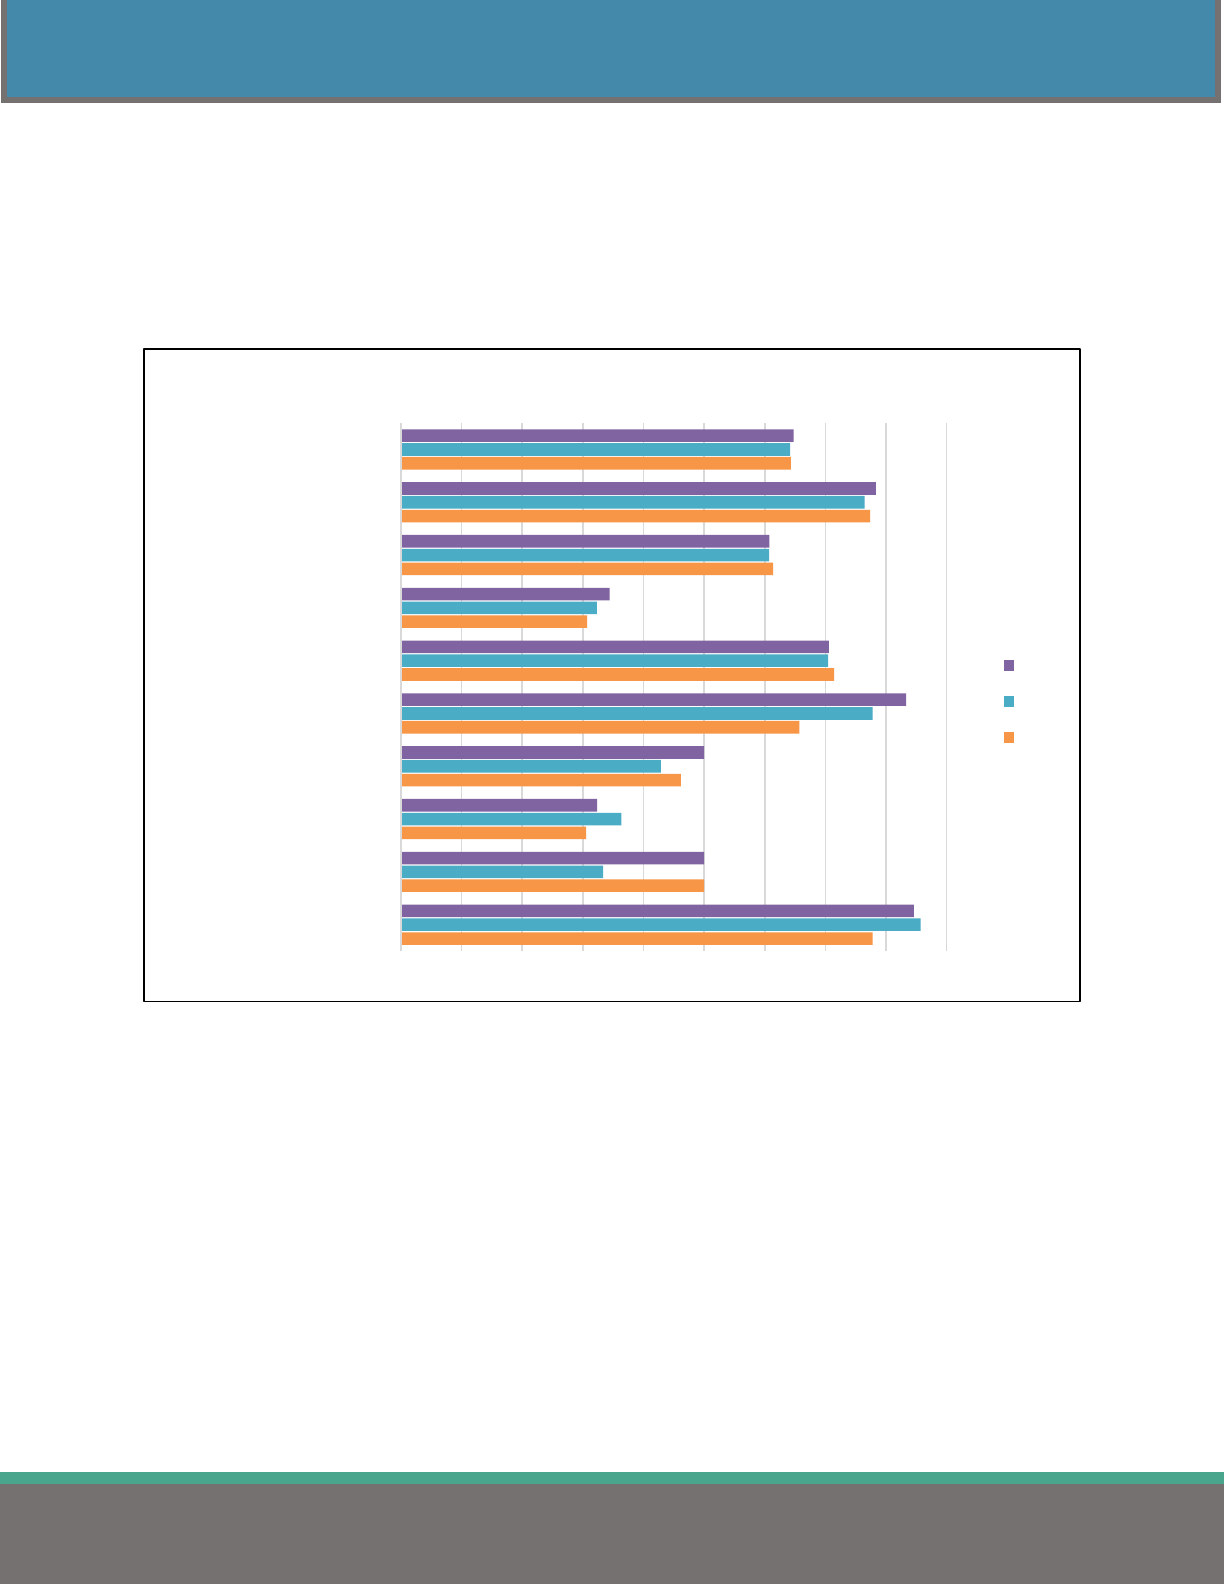
55
COST SAVINGS
2022HEALTHINSURANCEREPORT
WORKSITE WELLNESS PROGRAMS
Worksite wellness programs are outreach initiatives that focus on reducing health care costs by
encouraging employees to adopt healthier behaviors. These programs are usually separate from the
medical plan. Figure 19 shows the number of employers offering a worksite wellness plan over the past
three years.
Figure 19
More than 60% of employers statewide have implemented a worksite wellness program.
84.6%
50.0%
32.4%
50.0%
83.3%
70.6%
34.4%
60.8%
78.3%
64.8%
0.0% 10.0% 20.0% 30.0% 40.0% 50.0% 60.0% 70.0% 80.0% 90.0%
RegionalTransitAuthorities
PortAuthorities
MetroHousingAuthorities
FireDistricts
Colleges&Universities
SchoolDistricts&ESCs
Townships
Cities
Counties
STATEWIDE
PercentofEmployerswithWorksiteWellnessProgram
2022
2021
2020
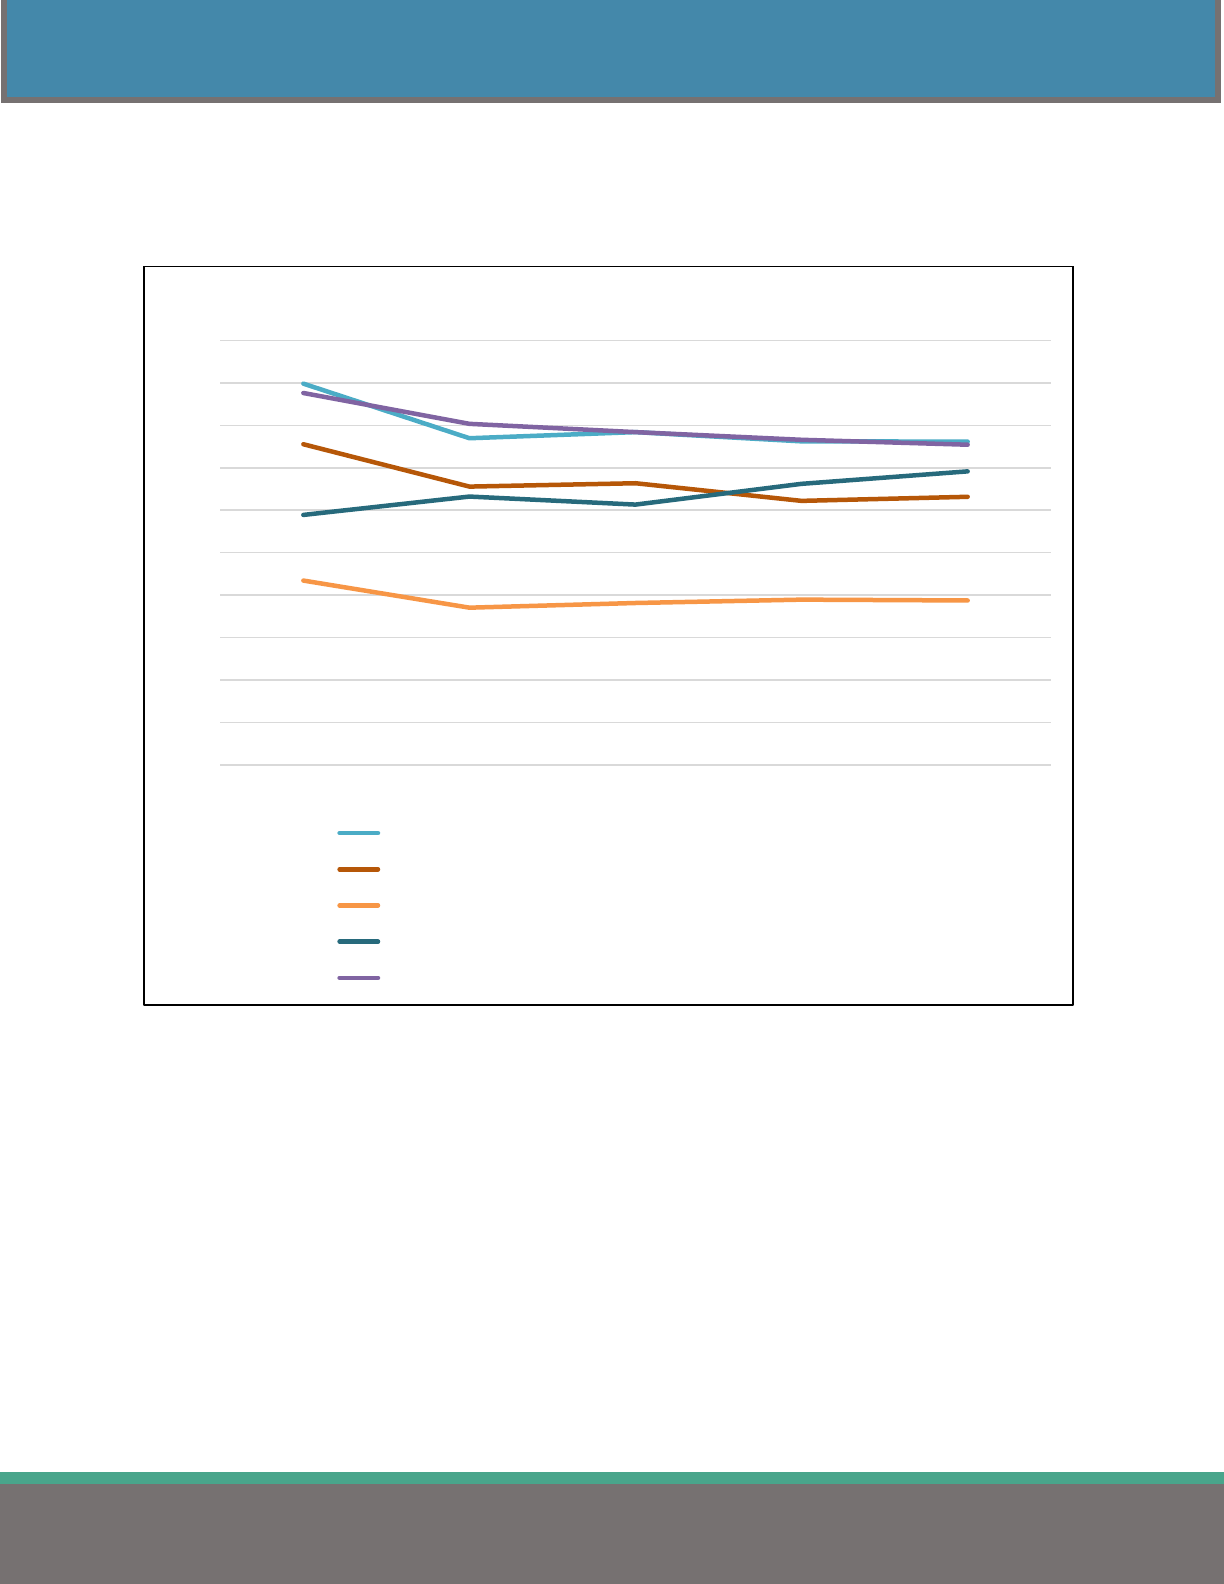
56
COST SAVINGS
2022HEALTHINSURANCEREPORT
Figure 20 highlights the various worksite wellness components offered and their implementation rates
over the last five years. Many employers reported offering multiple wellness program components each
year.
Figure 20
Health Education is one of the more frequently used wellness components (76%). This includes
counseling or training opportunities for physical activity and workplace injury prevention.
Supportive Social & Physical Work Environment (63%) typically includes policies against
tobacco use and classes or counseling on nutrition and fitness.
Integration of Worksite Program into Organization’s Structure (39%) involves the appointments
of dedicated staff to the program and/or the allocation of budget support.
Related Programs (69%) encompass employee assistance, work/life balance focus, and
occupational safety and health programs.
Screening Programs have also become a popular form of worksite wellness programs at 75%.
These programs include blood pressure and blood cholesterol screenings.
0%
10%
20%
30%
40%
50%
60%
70%
80%
90%
100%
2018 2019 2020 2021 2022
FrequencyofStatewideWellnessProgramComponents
HealthEducation
SupportiveSocial&PhysicalWorkEnvironment
IntegrationofWorksiteProgramintoOrganization'sStructure
RelatedPrograms
ScreeningPrograms
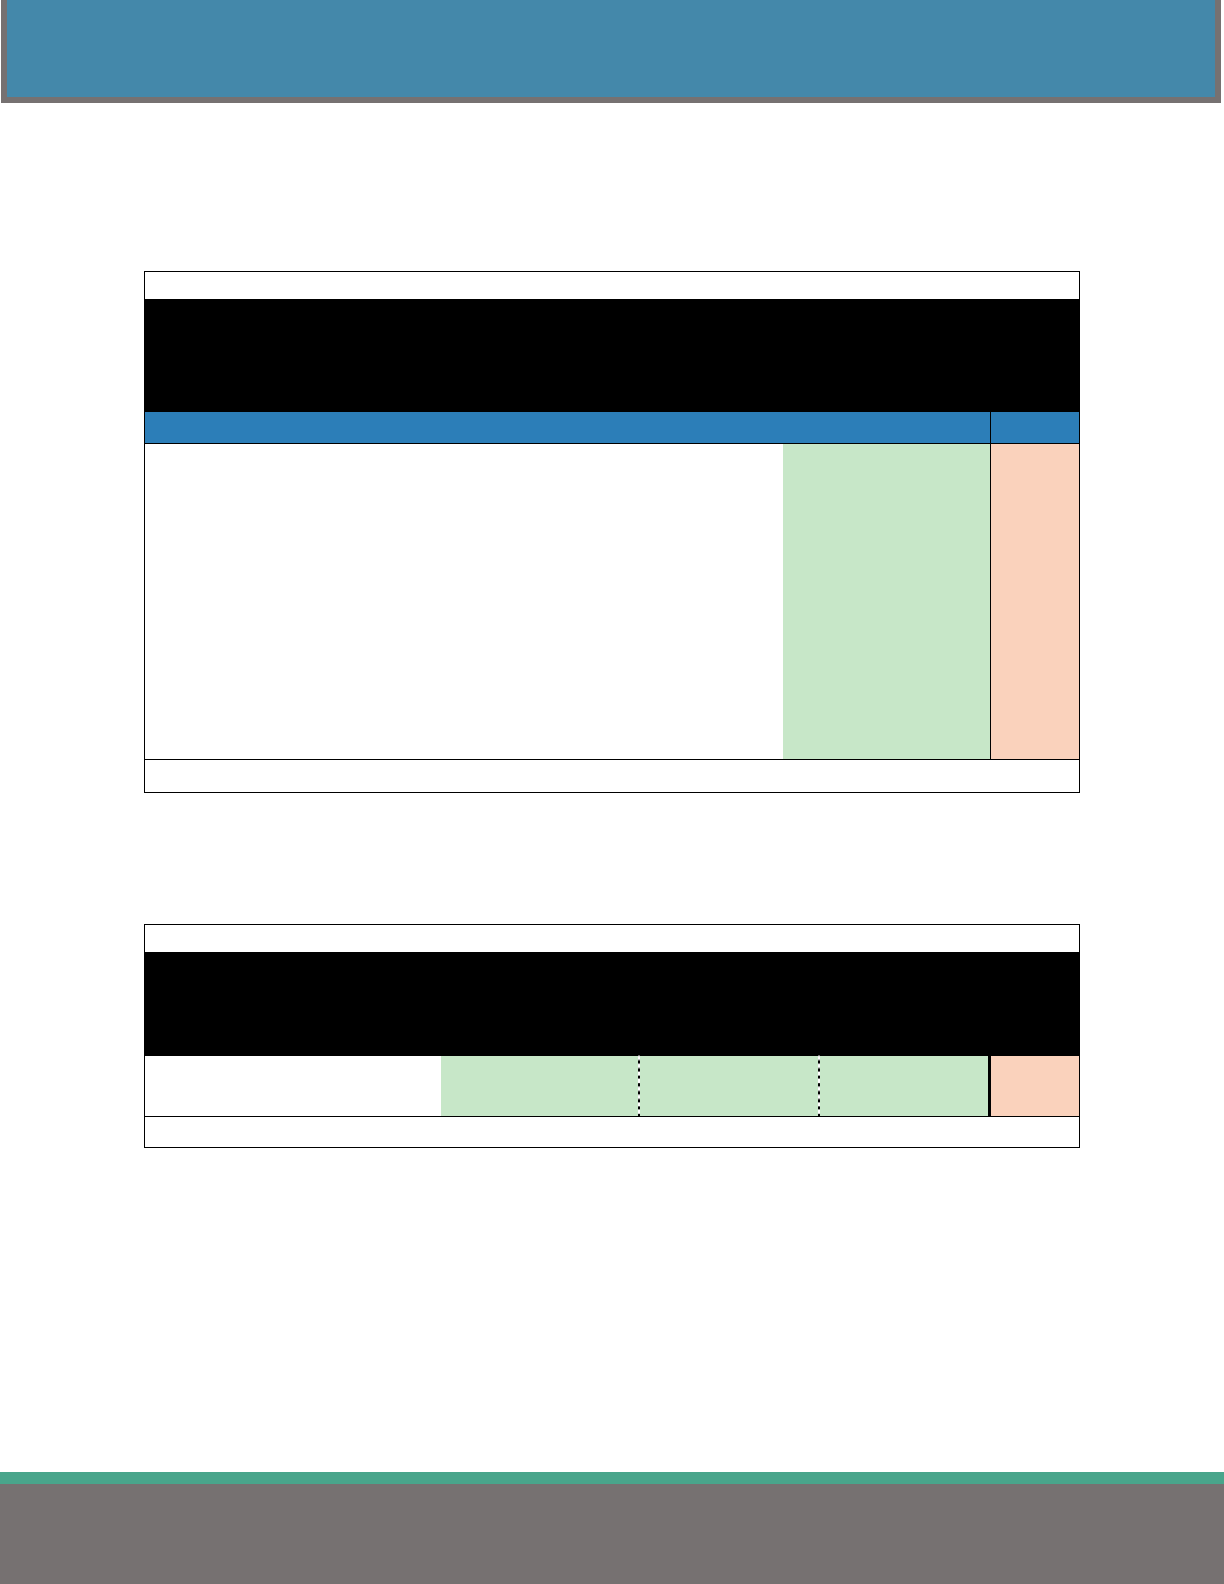
57
COST SAVINGS
2022HEALTHINSURANCEREPORT
OPT-OUT INCENTIVES
Table 46 shows the average number of employers offering opt-out monetary incentives to employees who
waive medical coverage by jurisdiction.
Table 46
Opt-Out Incentive Offered by Jurisdiction
Comparison Group
Employers Offering
Opt-Out Incentive
n
STATEWIDE 46.9% 1,232
State of Ohio 0.0% 1
Counties 24.1% 83
Cities 53.4% 232
Townships 26.4% 125
School Districts & ESCs 52.3% 690
Colleges & Universities 41.7% 36
Fire Districts 35.7% 14
Metro Housing Authorities 35.3% 34
Port Authorities 50.0% 4
Regional Transit Authorities 46.2% 13
Note: n: number of employers.
Table 47 highlights the average, minimum, and maximum incentive amount offered to employees for
single and family plans. The incentive amount may vary depending on whether the person is eligible for
single or family coverage.
Table 47
Incentive Offered to Employees for Opting Out of Medical Coverage
Opt-Out
Type
Average
Incentive
Minimum
Incentive
Maximum
Incentive n
Single $ 1,810.09 $ 180.00 $ 7,600.00 541
Family $ 2,669.14 $ 180.00 $ 12,000.00 541
Note: n: number of employers.
This year’s insurance survey submissions reported that 18,303 public employees across the state
accepted the employer-offered incentive to opt out of medical coverage.
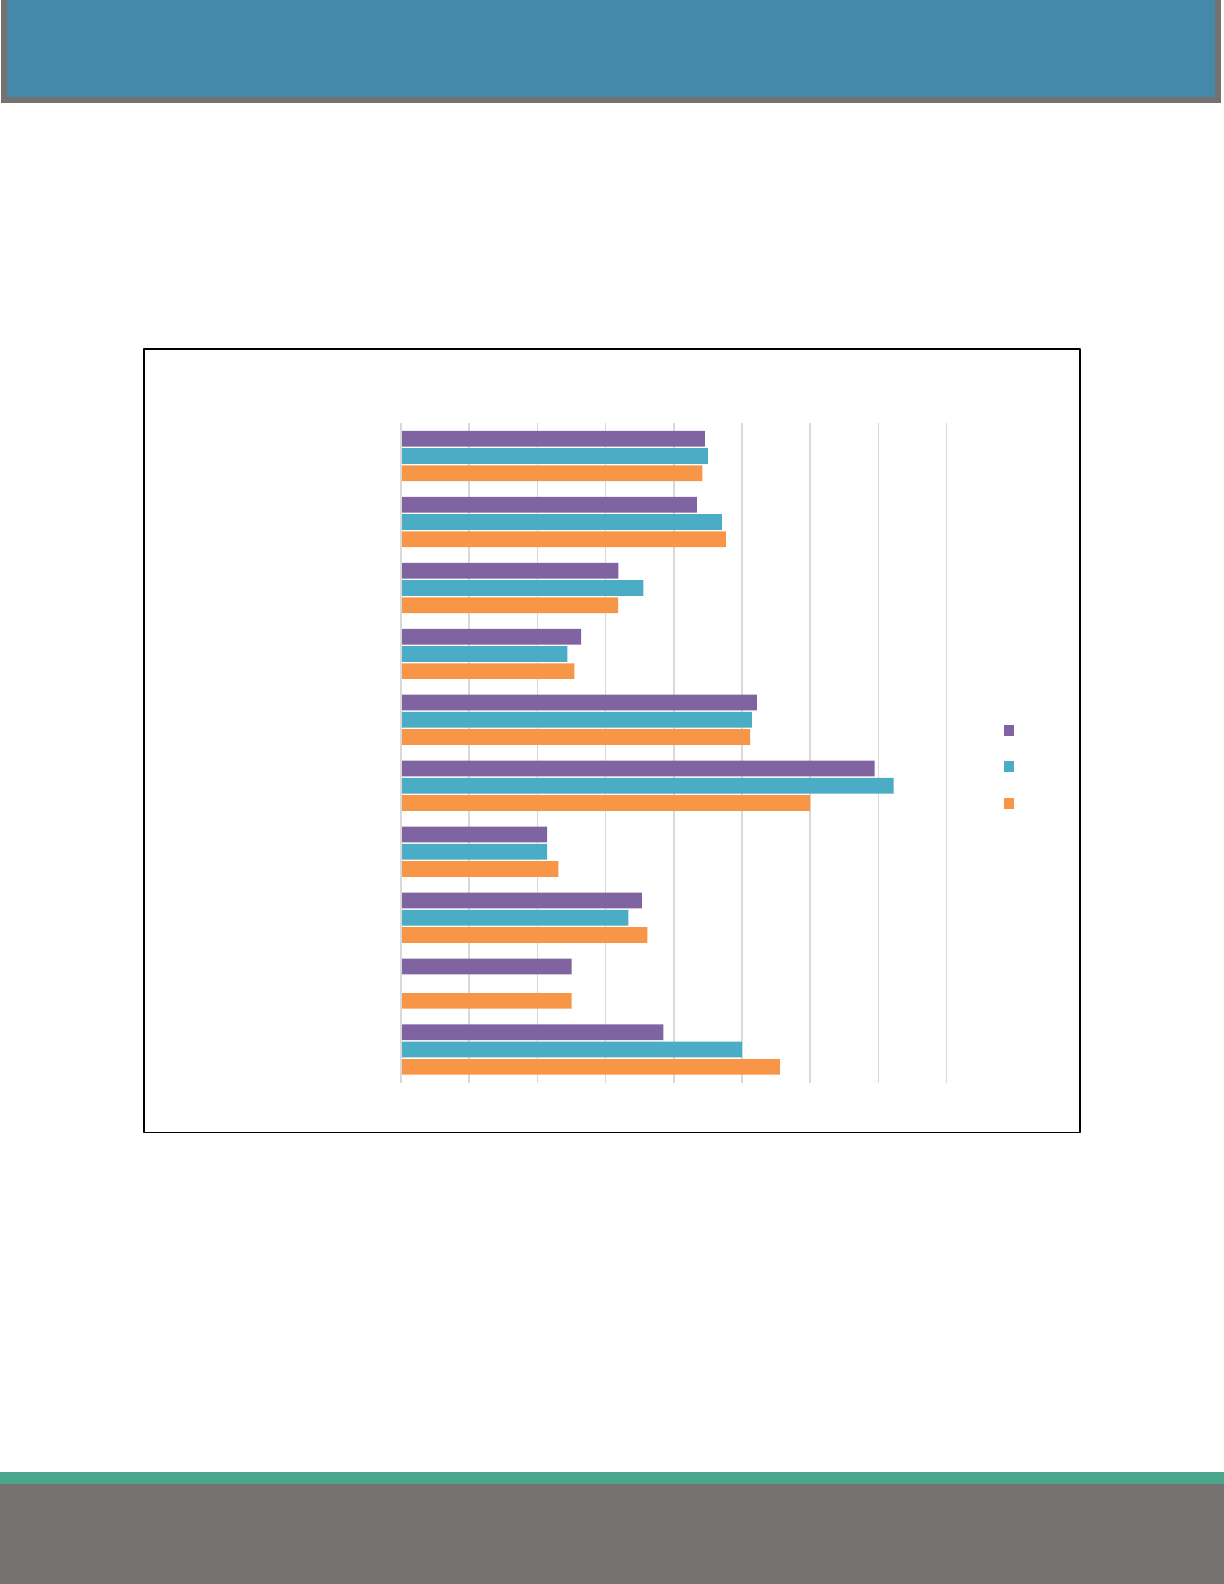
58
COST SAVINGS
2022HEALTHINSURANCEREPORT
SPOUSAL RESTRICTIONS
Over 44% of employers who completed the survey reported having a spousal stipulation for employees
whose spouses have other means of acquiring medical coverage.
Figure 21 highlights the percentage of employers with a spousal restriction by jurisdiction.
Figure 21
38.5%
25.0%
35.3%
21.4%
69.4%
52.2%
26.4%
31.9%
43.4%
44.6%
0.0% 10.0% 20.0% 30.0% 40.0% 50.0% 60.0% 70.0% 80.0%
RegionalTransitAuthorities
PortAuthorities
MetroHousingAuthorities
FireDistricts
Colleges&Universities
SchoolDistricts&ESCs
Townships
Cities
Counties
STATEWIDE
SpousalRestrictionsbyJurisdiction
2022
2021
2020
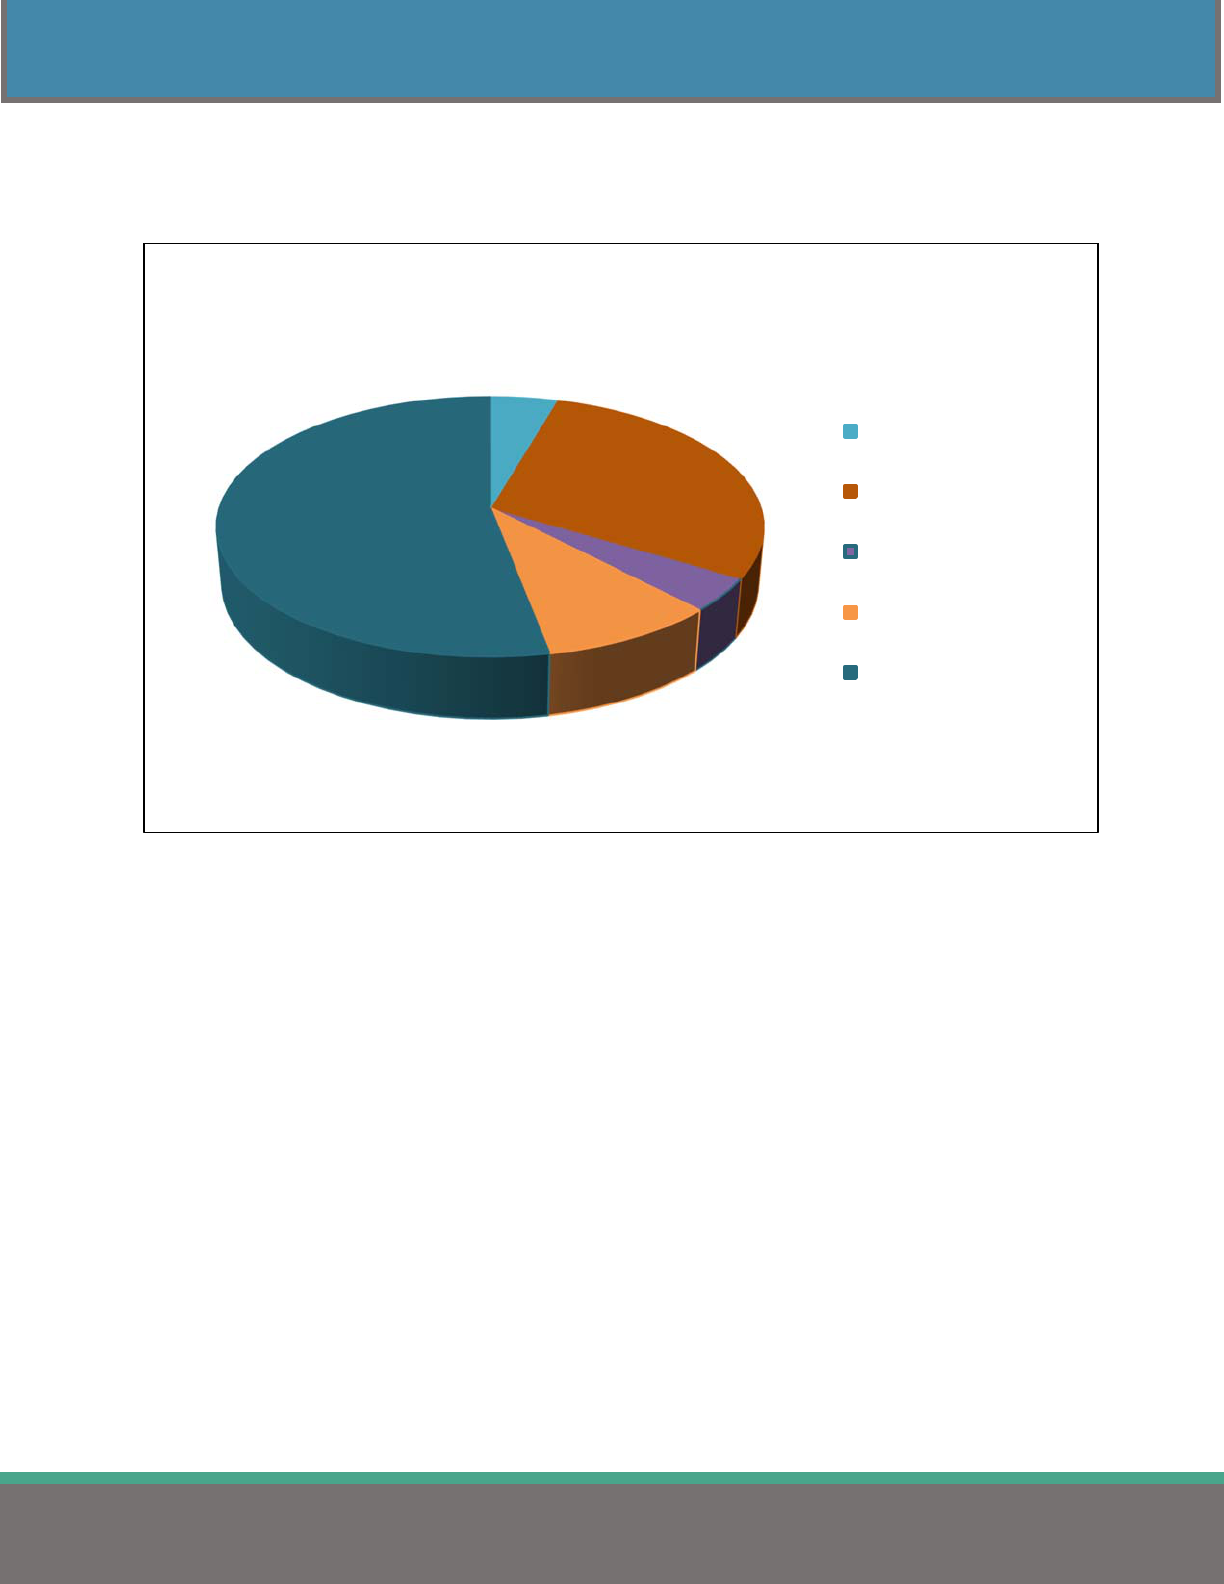
59
COST SAVINGS
2022HEALTHINSURANCEREPORT
Figure 22 illustrates the frequency of each type of spousal restriction.
Figure 22
29.1% of employers with spousal restrictions stipulate that if an employee’s spouse has medical
coverage available through their employer, the spouse must use their employer’s insurance as
their primary form of coverage.
4.5%
29.1%
4.2%
9.2%
53.0%
FrequencyofTypesofSpousalRestrictions
Incentiveoffered
Requirementtotakeother
insuranceasprimary
PenaltyCharged
NotEligible
NoRestrictions
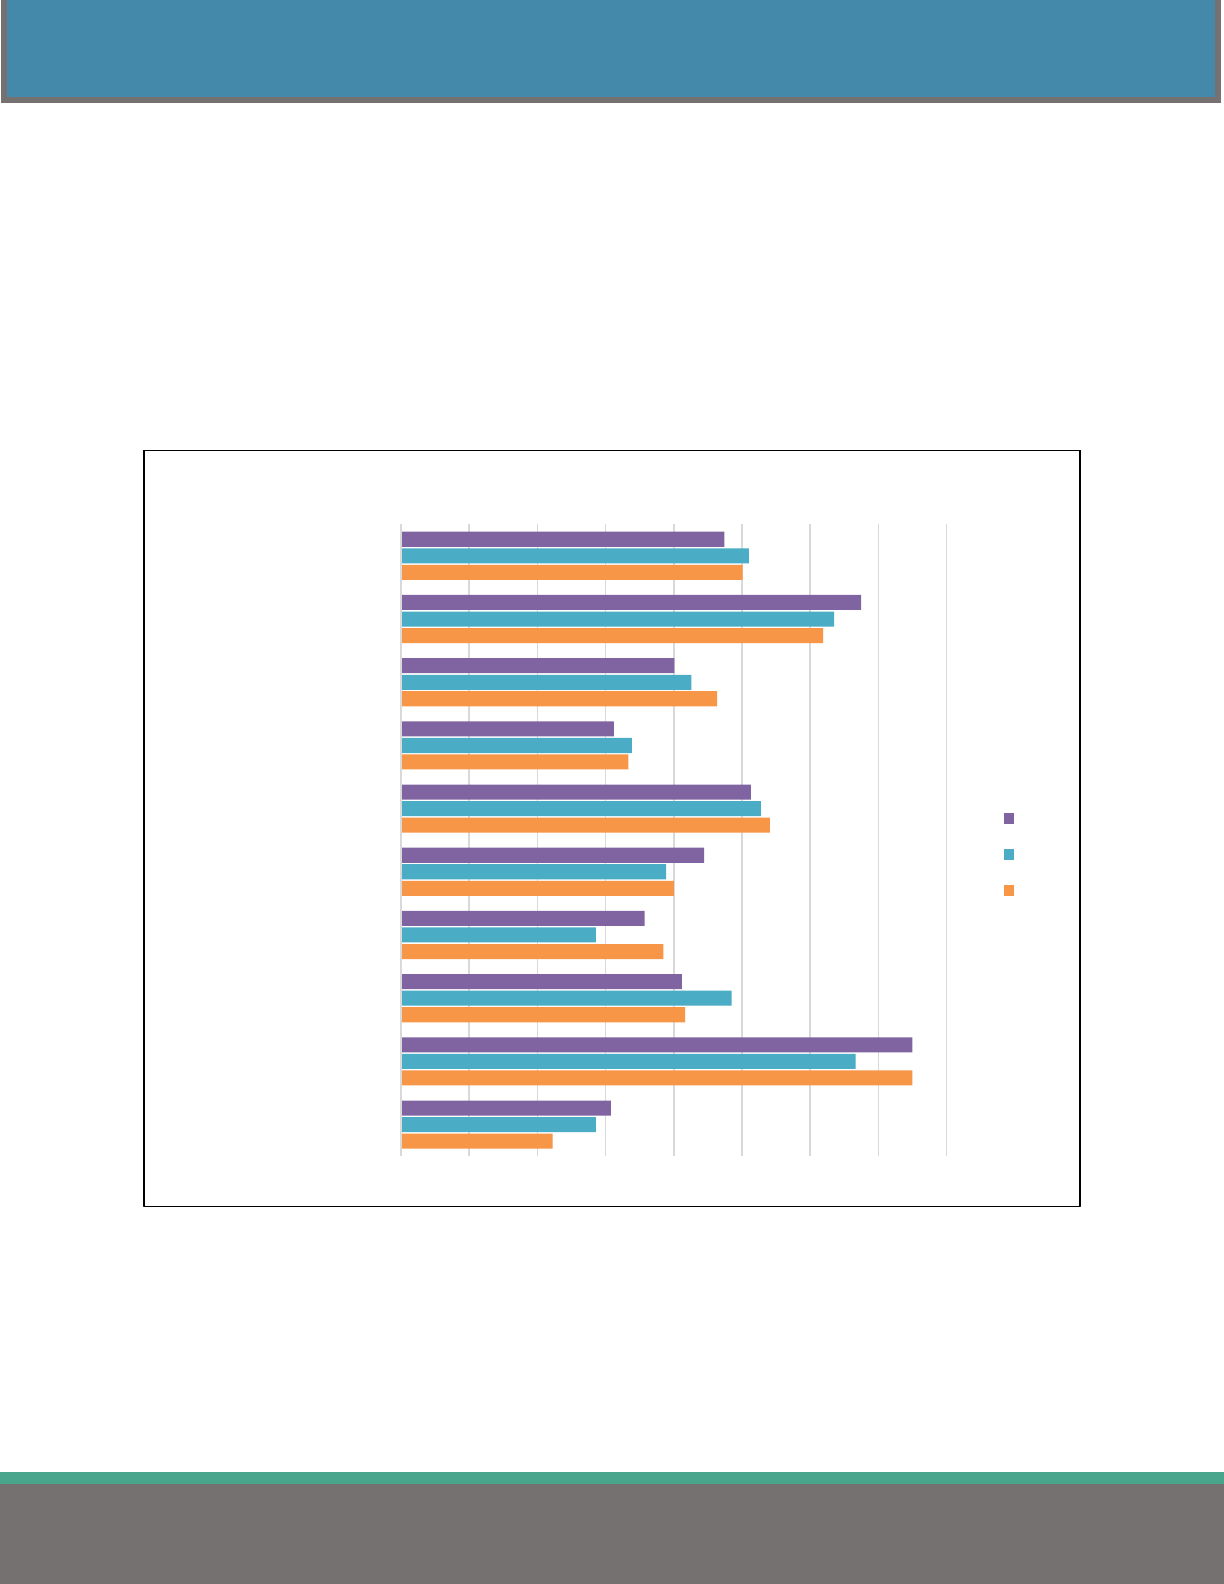
60
COST SAVINGS
2022HEALTHINSURANCEREPORT
DEPENDENT ELIGIBILITY AUDIT
Dependent Eligibility Audits (DEAs) identify individuals who do not qualify for the employer-offered
medical plan. The purpose of a DEA is to identify persons enrolled on the employer’s medical plan who
are no longer eligible for coverage. Examples include adult children no longer in school, full-time
students older than the maximum age allowed by the plan, ex-spouses, and other relatives not eligible for
coverage.
Figure 23 illustrates the number of employers by jurisdiction who have conducted a dependent eligibility
audit in the past three years.
Figure 23
Statewide, the percent of employers reporting that their organization conducted a dependent
eligibility audit sometime over the past three years decreased by 3.6% from last year’s survey.
30.8%
75.0%
41.2%
35.7%
44.4%
51.3%
31.2%
40.1%
67.5%
47.4%
0.0% 10.0% 20.0% 30.0% 40.0% 50.0% 60.0% 70.0% 80.0%
RegionalTransitAuthorities
PortAuthorities
MetroHousingAuthorities
FireDistricts
Colleges&Universities
SchoolDistricts&ESCs
Townships
Cities
Counties
STATEWIDE
PercentofEmployerswithDependentEligibilityAudit
2022
2021
2020
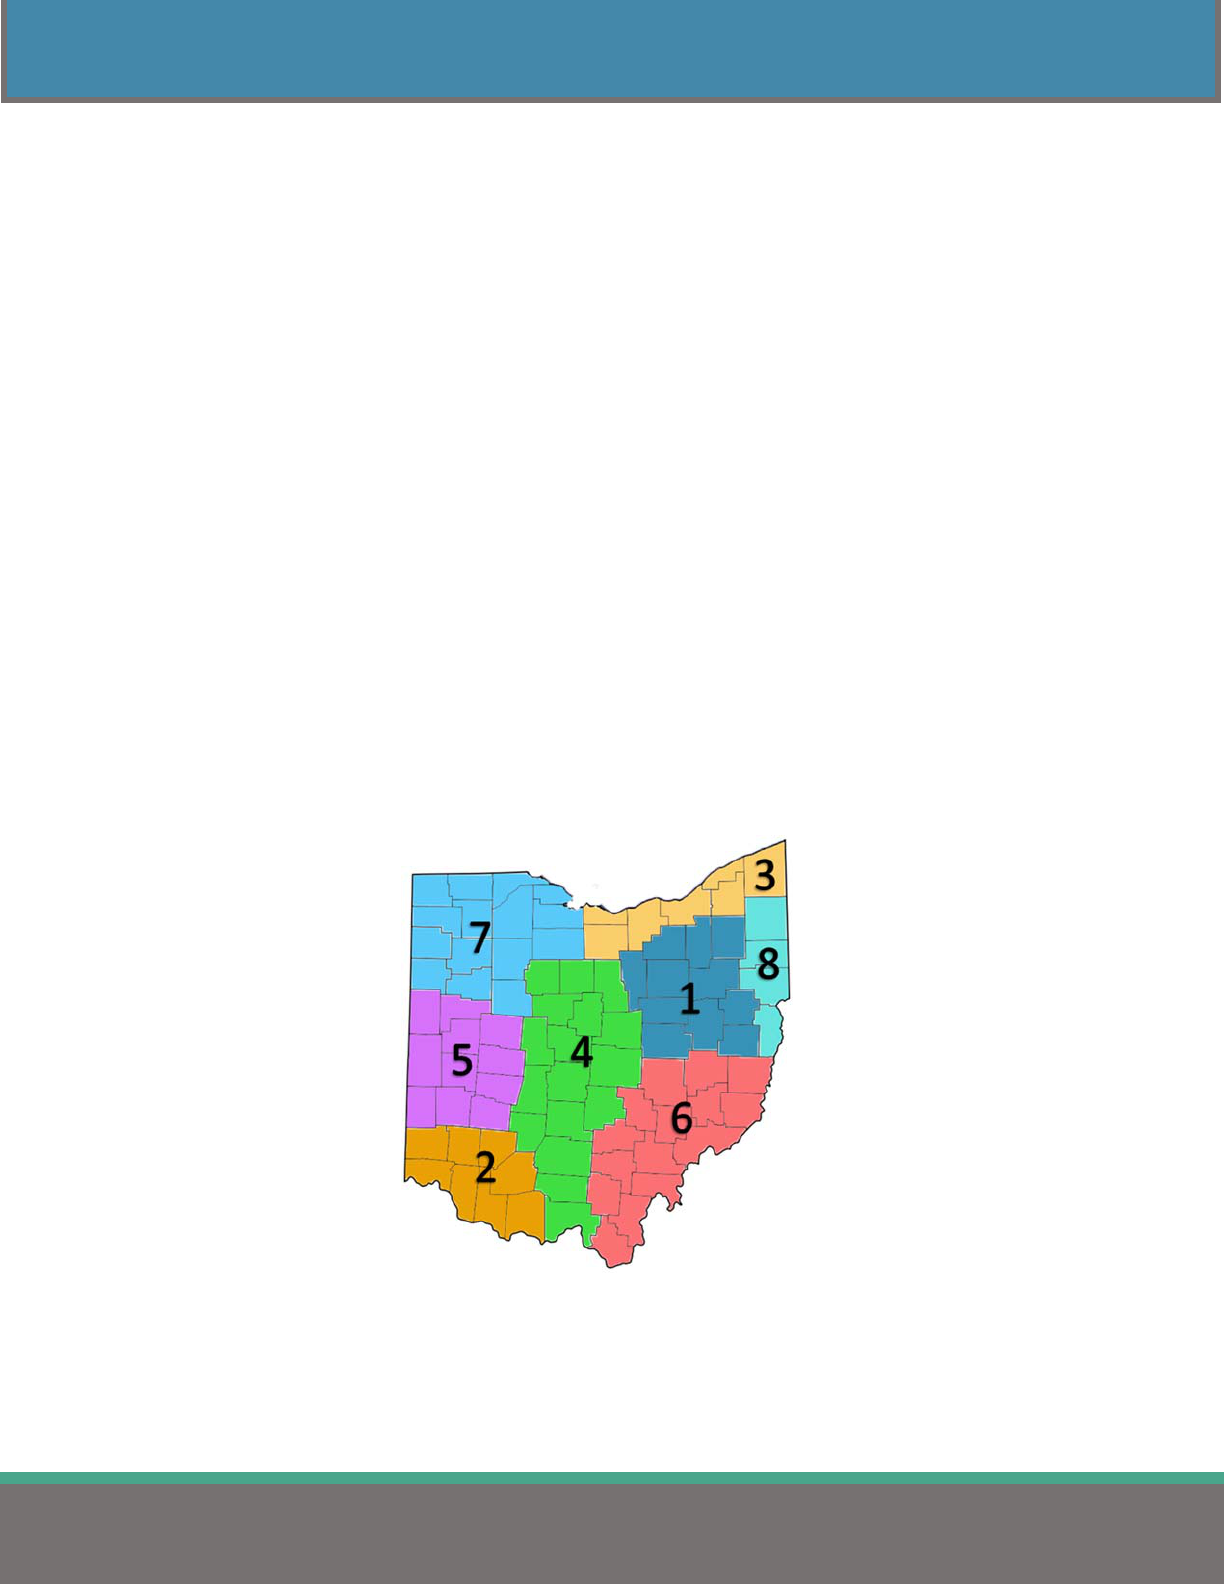
61
DEFINITIONS
2022HEALTHINSURANCEREPORT
DEFINITIONS
• Each Region consists of several geographically proximate counties. The county groupings, which
SERB’s Bureau of Mediation originally developed for the purpose of developing fact finder and
conciliation panels, are as follows:
1 - Akron/Canton: Ashland, Carroll, Coshocton, Harrison, Holmes, Medina, Portage, Stark,
Summit, Tuscarawas & Wayne.
2 - Cincinnati: Adams, Brown, Butler, Clermont, Clinton, Hamilton, Highland & Warren.
3 - Cleveland: Ashtabula, Cuyahoga, Erie, Geauga, Huron, Lake, & Lorain.
4 - Columbus: Crawford, Delaware, Fairfield, Fayette, Franklin, Knox, Licking, Madison,
Marion, Morrow, Pickaway, Pike, Richland, Ross, Scioto, Union, & Wyandot.
5 - Dayton: Auglaize, Champaign, Clark, Darke, Greene, Logan, Mercer, Miami, Montgomery,
Preble, & Shelby.
6 - Southeast Ohio: Athens, Belmont, Gallia, Guernsey, Hocking, Jackson, Lawrence, Meigs,
Monroe, Morgan, Muskingum, Noble, Perry, Vinton, & Washington.
7 - Toledo: Allen, Defiance, Fulton, Hancock, Hardin, Henry, Lucas, Ottawa, Paulding, Putnam,
Sandusky, Seneca, Van Wert, Williams, & Wood.
8 - Warren-Youngstown: Columbiana, Jefferson, Mahoning, & Trumbull.

62
DEFINITIONS
2022HEALTHINSURANCEREPORT
• Employees Covered refers to the total number of employees the employer has on staff eligible for
medical coverage.
• Exclusive Provider Organization (EPO): “An Exclusive Provider Organization Plan is a managed
care plan where services are covered only if you go to doctors, specialists, or hospitals in the plan’s
network (except in an emergency).” (Health Insurance Marketplace.
https://www.healthcare.gov/glossary/exclusive-provider-organization-EPO-plan. Retrieved on July
16, 2022.)
• High Deductible Health Plan (HDHP): “A High Deductible Health Plan is a plan with a higher
deductible than a traditional insurance plan. The monthly premium is usually lower, but you pay more
health care costs yourself before the insurance company starts to pay its share (your deductible). A
high deductible plan (HDHP) can be combined with a health savings account (HSA), allowing you to
pay for certain medical expenses with money free from federal taxes.
For 2022, the IRS defines a high deductible health plan as any plan with a deductible of at least
$1,400 for individual or $2,800 for family coverage. An HDHP’s total yearly out-of-pocket expenses
(including deductibles, copayments, and coinsurance) can’t be more than $7,050 for an individual or
$14,100 for a family. (This limit doesn't apply to out-of-network services.)” (Health Insurance
Marketplace. https://www.healthcare.gov/glossary/high-deductible-health-plan/. Retrieved on July 16,
2022.)
• Health Maintenance Organization (HMO): “ Health Maintenance Organization is a type of health
insurance plan that usually limits coverage to care from doctors who work for or contract with the
HMO. It generally won't cover out-of-network care except in an emergency. An HMO may require
you to live or work in its service area to be eligible for coverage. HMOs often provide integrated care
and focus on prevention and wellness.” (Health Insurance Marketplace.
https://www.healthcare.gov/glossary/health-maintenance-organization-HMO/. Retrieved on July 16,
2022.)
• Point of Service (POS): “A point-of-service plan is a type of managed care plan that is a hybrid of
HMO and PPO plans. Like an HMO, participants designate an in-network physician to be their
primary care provider. But like a PPO, patients may go outside of the provider network for health care
services. When patients venture out of the network, they’ll have to pay most of the cost unless the
primary care provider has made a referral to the out-of-network provider. Then the medical plan will
pick up the tab.” (Small Business Majority. https://healthcoverageguide.org/reference-
guide/coverage-types/point-of-service-plan-pos/. Retrieved on July 16, 2022.)
• Preferred Provider Organization (PPO): “A Preferred Provider Organization is a type of health
plan that contracts with medical providers, such as hospitals and doctors, to create a network of
participating providers. You pay less if you use providers that
belong to the plan’s network. You can
use doctors, hospitals, and providers outside of the network for an additional cost.” (Health Insurance
Marketplace. https://www.healthcare.gov/glossary/preferred-provider-organization-PPO/. Retrieved
on July 16, 2022.)
• Health Savings Account (HSA): “A health savings account is a tax-exempt trust or custodial
account you set up with a qualified HSA trustee to pay or reimburse certain medical expenses you
incur. You must be an eligible individual to qualify for an HSA.” (Internal Revenue Service.
https://www.irs.gov/publications/p969/index.html. Retrieved on July 16, 2022.)

63
DEFINITIONS
2022HEALTHINSURANCEREPORT
• Health Reimbursement Account (HRA): “A Health Reimbursement Account is an arrangement that
is funded solely by an employer, and that reimburses an employee for medical care expenses (as
defined under Code § 213(d)) incurred by the employee, or his spouse, dependents, and any children
who, as of the end of the taxable year, have not attained age 27, up to a maximum dollar amount for a
coverage period. IRS Notice 2002-45, 2002-02 C.B. 93; Revenue Ruling 2002-41, 2002-2 C.B. 75.
This reimbursement is excludable from the employee’s income. Amounts that remain at the end of the
year generally can be used to reimburse expenses incurred in later years.” (Internal Revenue Service.
https://www.irs.gov/pub/irs-drop/n-13-54.pdf. Retrieved on July 16, 2022.)

64
DEFINITIONS
2022HEALTHINSURANCEREPORT
State Employment Relations Board
65 East State Street, 12
th
Floor
Columbus, OH 43215-4213
(614) 644-8573 (Main) | (614) 466-3074 (Fax)
https://serb.ohio.gov
