`
State Employment
Relations Board
HEALTH
INSURANCE
THE COST OF HEALTH INSURANCE
IN OHIO’S PUBLIC SECTOR

i
2023 HEALTH INSURANCE REPORT
Contents
WELCOME .................................................................................................................................... 1
REVISION NOTES .................................................................................................................... 1
SURVEY BACKGROUND ....................................................................................................... 2
SURVEY METHODS ................................................................................................................ 2
SURVEY RESPONSE RATE .................................................................................................... 3
MEDICAL INSURANCE – OVERVIEW ..................................................................................... 4
MEDICAL PLAN TYPES OFFERED ....................................................................................... 4
MEDICAL PREMIUM INCREASES COMPARED TO SALARY INCREASES .................. 5
MEDICAL PREMIUM INCREASES COMPARED TO INFLATION RATES ...................... 6
MEDICAL INSURANCE – ALL PLAN TYPES .......................................................................... 7
MEDICAL PREMIUMS ............................................................................................................ 7
EMPLOYER & EMPLOYEE SHARE OF MEDICAL PREMIUM ....................................... 11
TOTAL MONTHLY MEDICAL PREMIUMS BY PLAN TYPE .......................................... 14
FULLY-INSURED VS SELF-INSURED MEDICAL PLANS ............................................... 15
NETWORK DEDUCTIBLES .................................................................................................. 17
NON-NETWORK DEDUCTIBLES ........................................................................................ 19
COPAY AND COINSURANCE .............................................................................................. 21
OUT-OF-POCKET MAXIMUMS ........................................................................................... 23
MEDICAL INSURANCE – PPO PLANS ................................................................................... 25
PPO PREMIUMS ..................................................................................................................... 25
EMPLOYER & EMPLOYEE SHARE OF MEDICAL PREMIUM ....................................... 27
NETWORK DEDUCTIBLES .................................................................................................. 29
NON-NETWORK DEDUCTIBLES ........................................................................................ 31
OUT-OF-POCKET MAXIMUMS ........................................................................................... 32
MEDICAL INSURANCE – HDHPs ............................................................................................ 34
HDHP PREMIUMS .................................................................................................................. 34
EMPLOYER & EMPLOYEE SHARE OF MEDICAL PREMIUM ....................................... 36
NETWORK DEDUCTIBLES .................................................................................................. 38
NON-NETWORK DEDUCTIBLES ........................................................................................ 40
OUT-OF-POCKET MAXIMUMS ........................................................................................... 41
HEALTH SAVINGS ACCOUNT ............................................................................................ 43
PRESCRIPTION INSURANCE ................................................................................................... 44
PRESCRIPTION CARVE-OUT PREMIUMS......................................................................... 44

ii
2023 HEALTH INSURANCE REPORT
PRESCRIPTION COPAYS/COINSURANCE – ALL PLAN TYPES .................................... 45
DENTAL INSURANCE ............................................................................................................... 46
DENTAL CARVE-OUT PREMIUMS..................................................................................... 46
DENTAL MAXIMUM BENEFIT – ALL PLAN TYPES ....................................................... 47
DENTAL COMPOSITE RATES ............................................................................................. 49
VISION INSURANCE ................................................................................................................. 50
VISION CARVE-OUT PREMIUMS ....................................................................................... 50
VISION COMPOSITE RATES ................................................................................................ 51
LIFE INSURANCE ...................................................................................................................... 52
COST SAVINGS .......................................................................................................................... 53
CONSORTIUMS ...................................................................................................................... 53
WORKSITE WELLNESS PROGRAMS ................................................................................. 55
OPT-OUT INCENTIVES ......................................................................................................... 57
SPOUSAL RESTRICTIONS.................................................................................................... 58
DEPENDENT ELIGIBILITY AUDIT ..................................................................................... 60
DEFINITIONS .............................................................................................................................. 61

1
2023 HEALTH INSURANCE REPORT
WELCOME
WELCOME
The State Employment Relations Board (SERB) is pleased to present the Cost of Health Insurance in
Ohio’s Public Sector – 2023 Edition. This report provides a detailed look at trends in employer-sponsored
health coverage, including premiums, employee contributions, cost-sharing provisions, wellness
programs, and other aspects of health insurance for public entities in the State of Ohio. Thank you for
choosing SERB as your source of trusted information.
REVISION NOTES
The report format mirrors last year’s format with minor adjustments. Several years ago, the report was
updated to improve usability and make room for many new tables and figures. The overall goal of the
expansion was to provide a more detailed insurance report that included an in-depth analysis of the data at
the medical plan level. The insurance report was also expanded to offer a clear view of the employer and
employee contribution amounts towards the medical premium.
This venture involved a significant update to the insurance survey tool, a complete redesign of the
insurance report, and a thorough review and verification of the medical plan data submitted.
The report contains the following sections:
• Welcome
• Medical Insurance Overview
• Medical Insurance – All Plan Types
• Medical Insurance – PPO Plans
• Medical Insurance – HDHPs
• Prescription Insurance
• Dental Insurance
• Vision Insurance
• Life Insurance
• Cost Savings
• Definitions

2
2023 HEALTH INSURANCE REPORT
WELCOME
SURVEY BACKGROUND
The State Employment Relations Board (SERB), as mandated by section 4117.02 of the Ohio Revised
Code, is pleased to present the Annual Report on the Cost of Health Insurance in Ohio’s Public Sector
(2023 Edition). In its 31
st
year, this survey aims to collect data on various aspects of health insurance,
plan design, and cost for government entities. Our goal is to provide statistics that may be useful for both
the employer and employee organizations to promote orderly and constructive labor relationships between
public employers and their employees. This survey findings report provides a detailed look at employer-
offered health coverage for medical, prescription, dental, vision, and life insurance plans. The survey
collected information on various topics, including premiums, employer/employee contributions, plan
deductibles and out-of-pocket maximums, coinsurance, plan design, eligibility, wellness programs, and
other medical plan benefits.
SURVEY METHODS
The 2023 Health Insurance Survey was created and dispersed using Novi Survey, an online survey tool.
SERB emailed or mailed 1,346 links of the survey to public sector employers across the state during
January, requesting completion of the survey by March 2023. The target survey population included:
Government
Schools
Colleges/Universities
Special Districts
• State • School Districts (City, Local, Exempted Village) • Community Colleges • Fire Districts
• Counties • Joint Vocational Schools & Career Centers • State Colleges • Metro Housing Authorities
• Cities • Educational Service Centers (ESCs) • State Universities • Port Authorities
• Townships
• Regional Transit Authorities
This year SERB received 1,253 completed surveys that captured data from 1,993 health insurance plans
available to public sector employees in Ohio. All benefit information throughout this report includes
single and family coverage types. Please remember that the data collected represents public sector health
insurance plans that were in effect on January 1, 2023.
The survey instrument collects data from up to three medical and prescription plans per employer and a
single dental, vision, and life insurance plan. If employers offer more insurance plans than the survey can
collect, the employer reported the three insurance plans with the highest number of employees
participating.
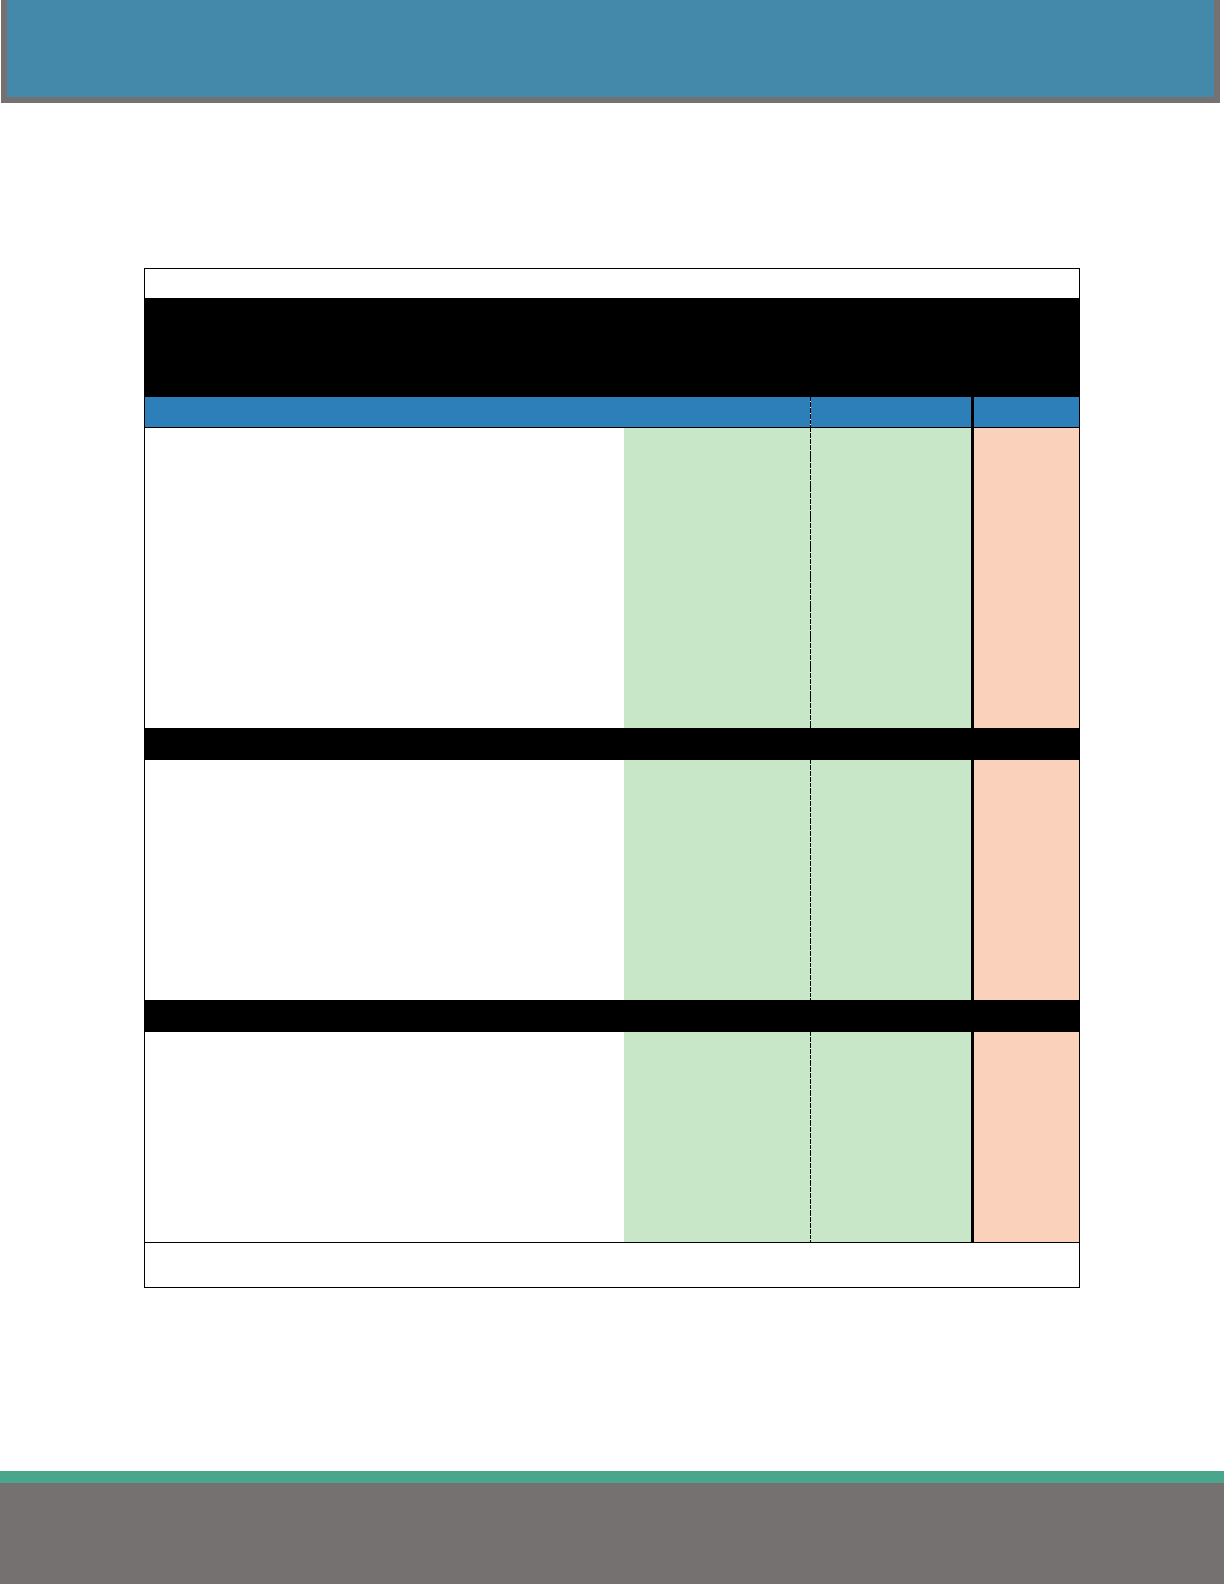
Table 1 displays the quantity of health insurance plans collected during the survey. The insurance plan
data appears in various formats throughout this report.
Table 1
Reported Number of Insurance Plans Offered Statewide
Medical
Prescription
Dental
Vision
Life
STATEWIDE
1,993
1,966
1,205
1,099
1,195
Note: Plans offered will vary depending on the response rate.
3
2023 HEALTH INSURANCE REPORT
WELCOME
SURVEY RESPONSE RATE
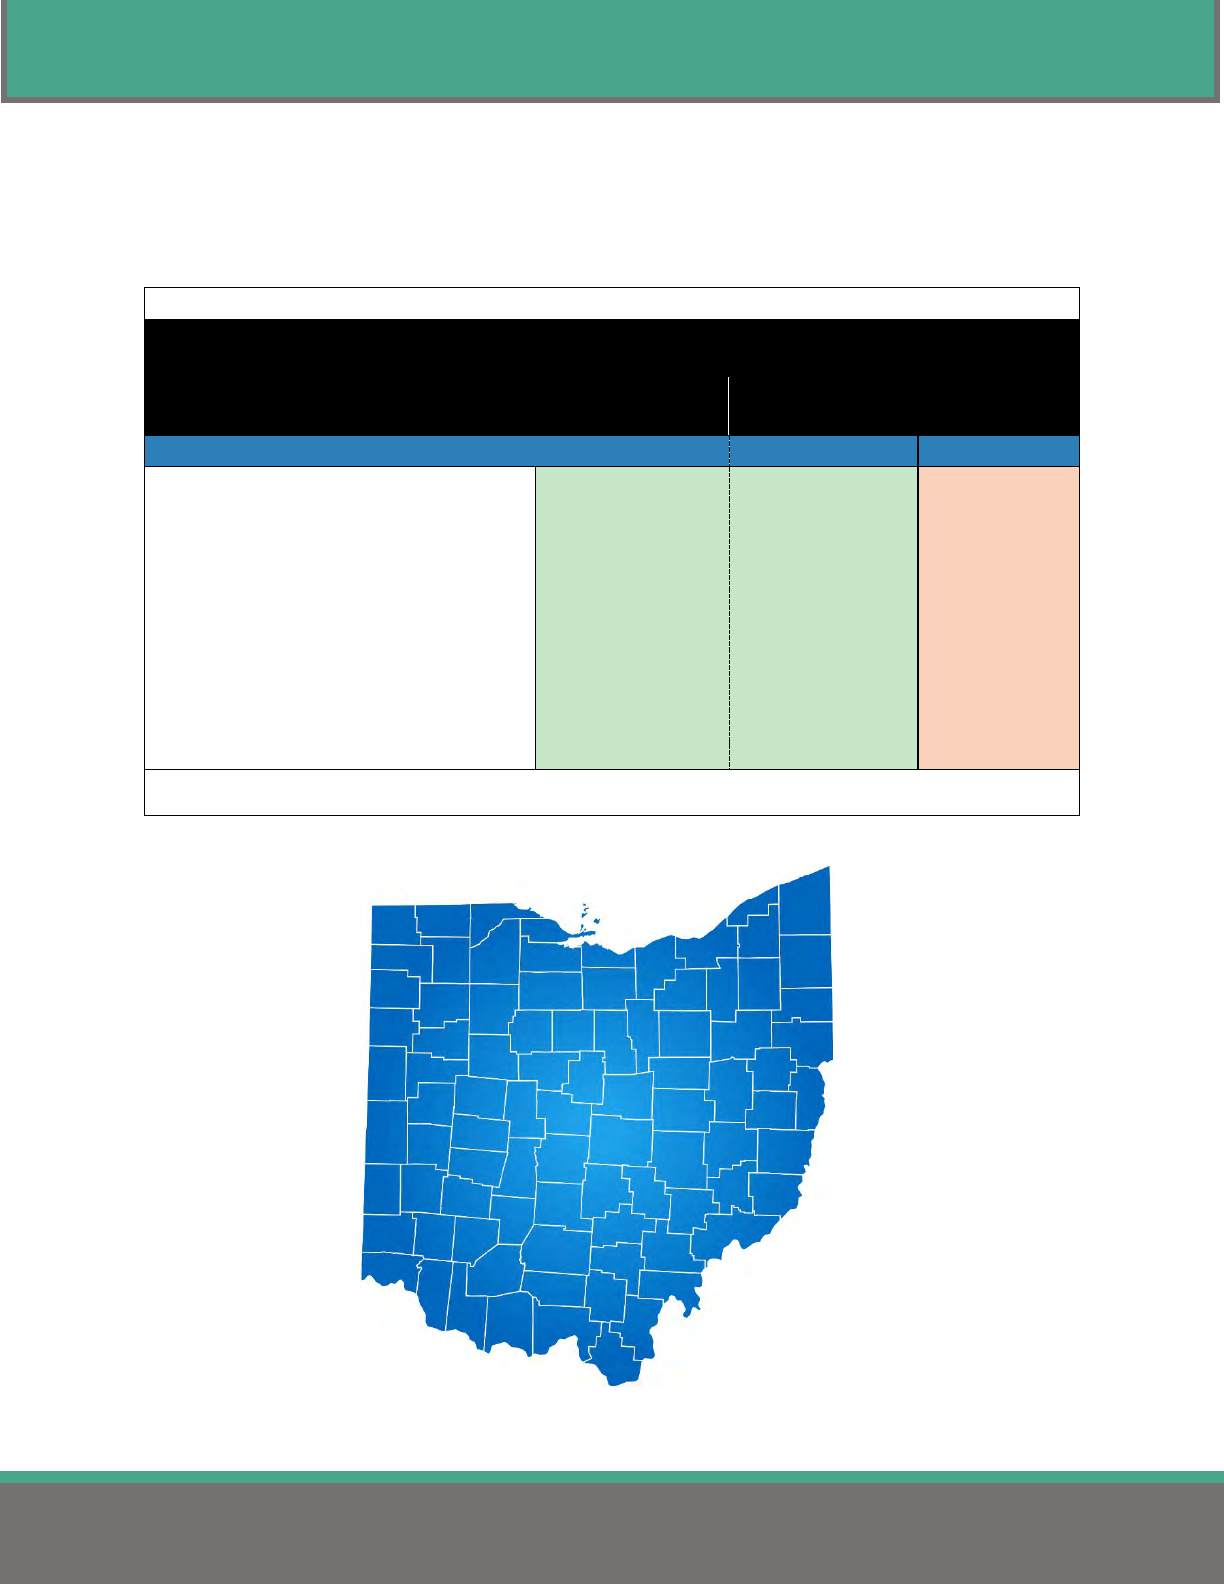
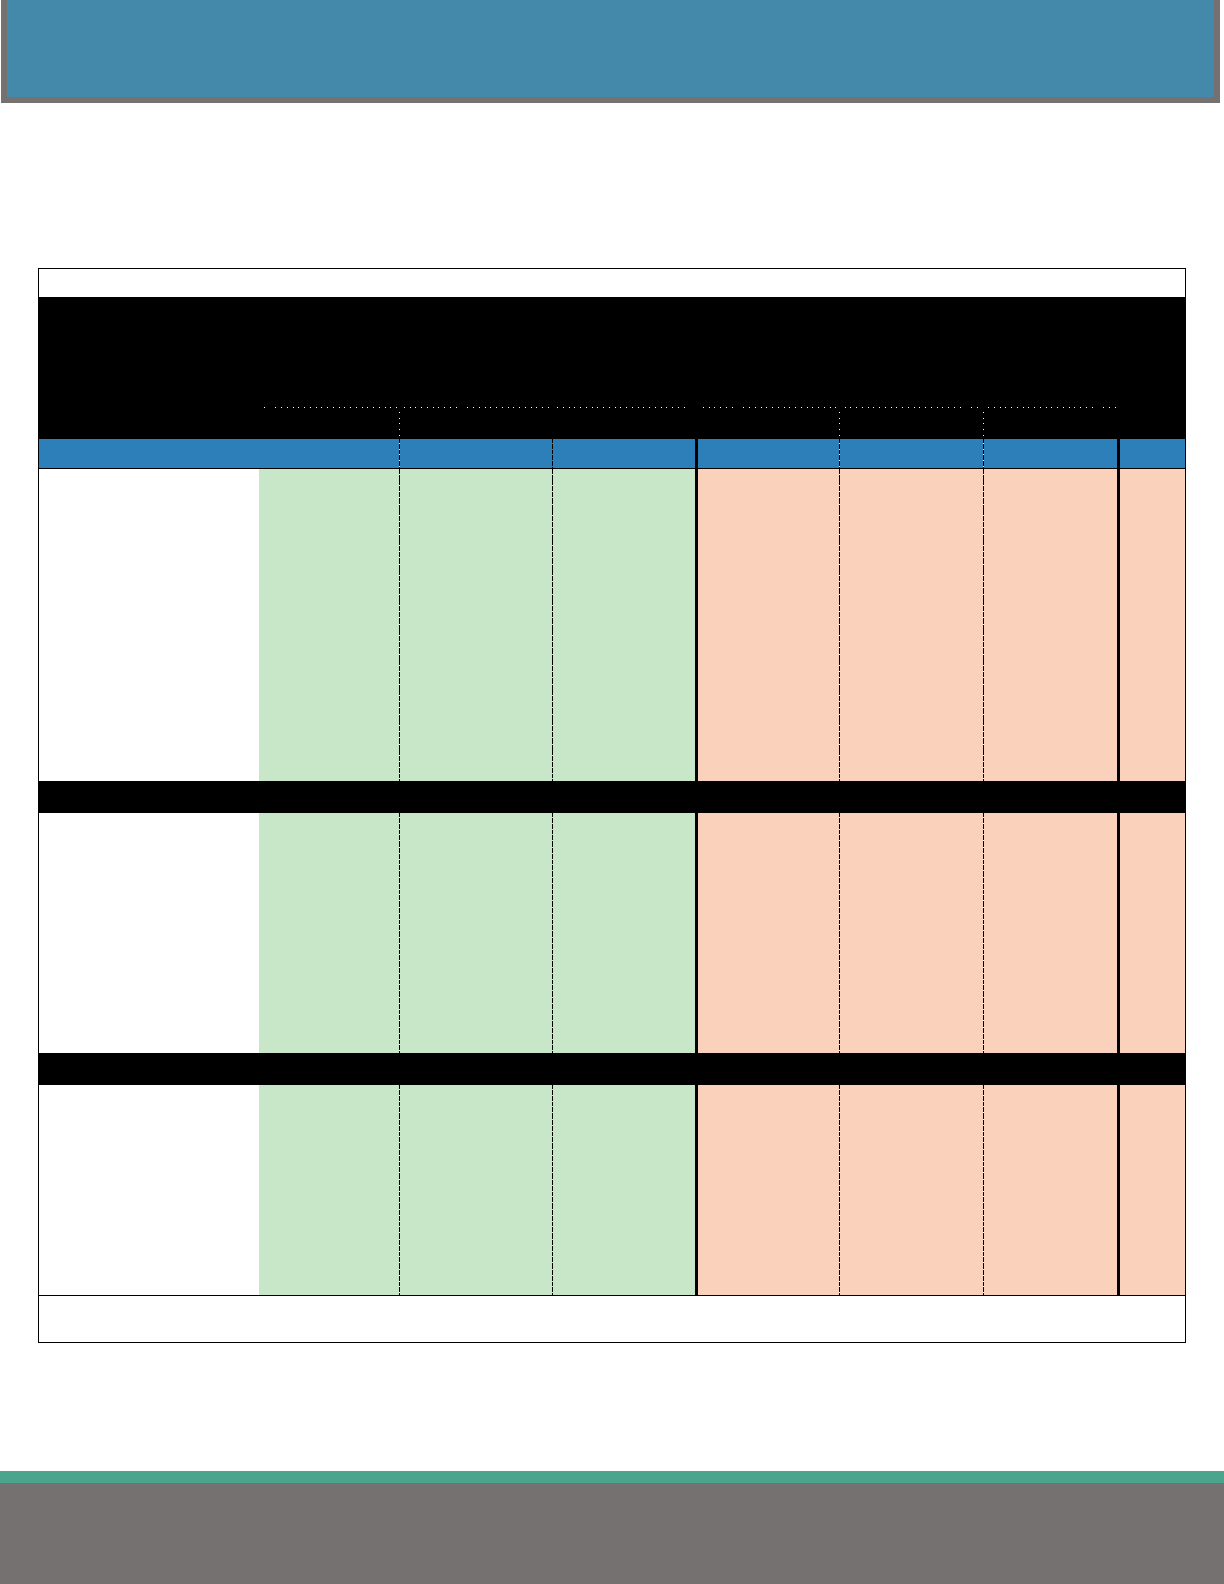
Table 2 displays the percent of public sector employers that completed and returned surveys for 2023 by
jurisdiction. This year’s response rate was 91.5%. Fifteen employers indicated that they do not offer
medical insurance. These employers have been omitted from all tables, except Table 2, in this report.
Table 2
Survey Response Rate
by Jurisdiction
Comparison Group
Surveys Sent
Surveys Completed
Response Rate
STATEWIDE
1,346
1,253
93.1%
State of Ohio 1 1 100.0%
Counties 88 85 96.6%
Cities
257
234
91.1%
Townships
169
137
81.1%
School Districts & ESCs
709
687
96.9%
Colleges & Universities
37
36
97.3%
Fire Districts 25 22 88.0%
Metro Housing Authorities 40 36 90.0%
Port Authorities 5 4 80.0%
Regional Transit Authorities 15 11 73.3%
Note: The number of surveys completed includes submissions from employers that do not offer insurance.
Note: Fifteen employers stated they do not offer medical insurance.

4
2023 HEALTH INSURANCE REPORT
MEDICAL INSURANCE – OVERVIEW
MEDICAL INSURANCE – OVERVIEW
MEDICAL PLAN TYPES OFFERED
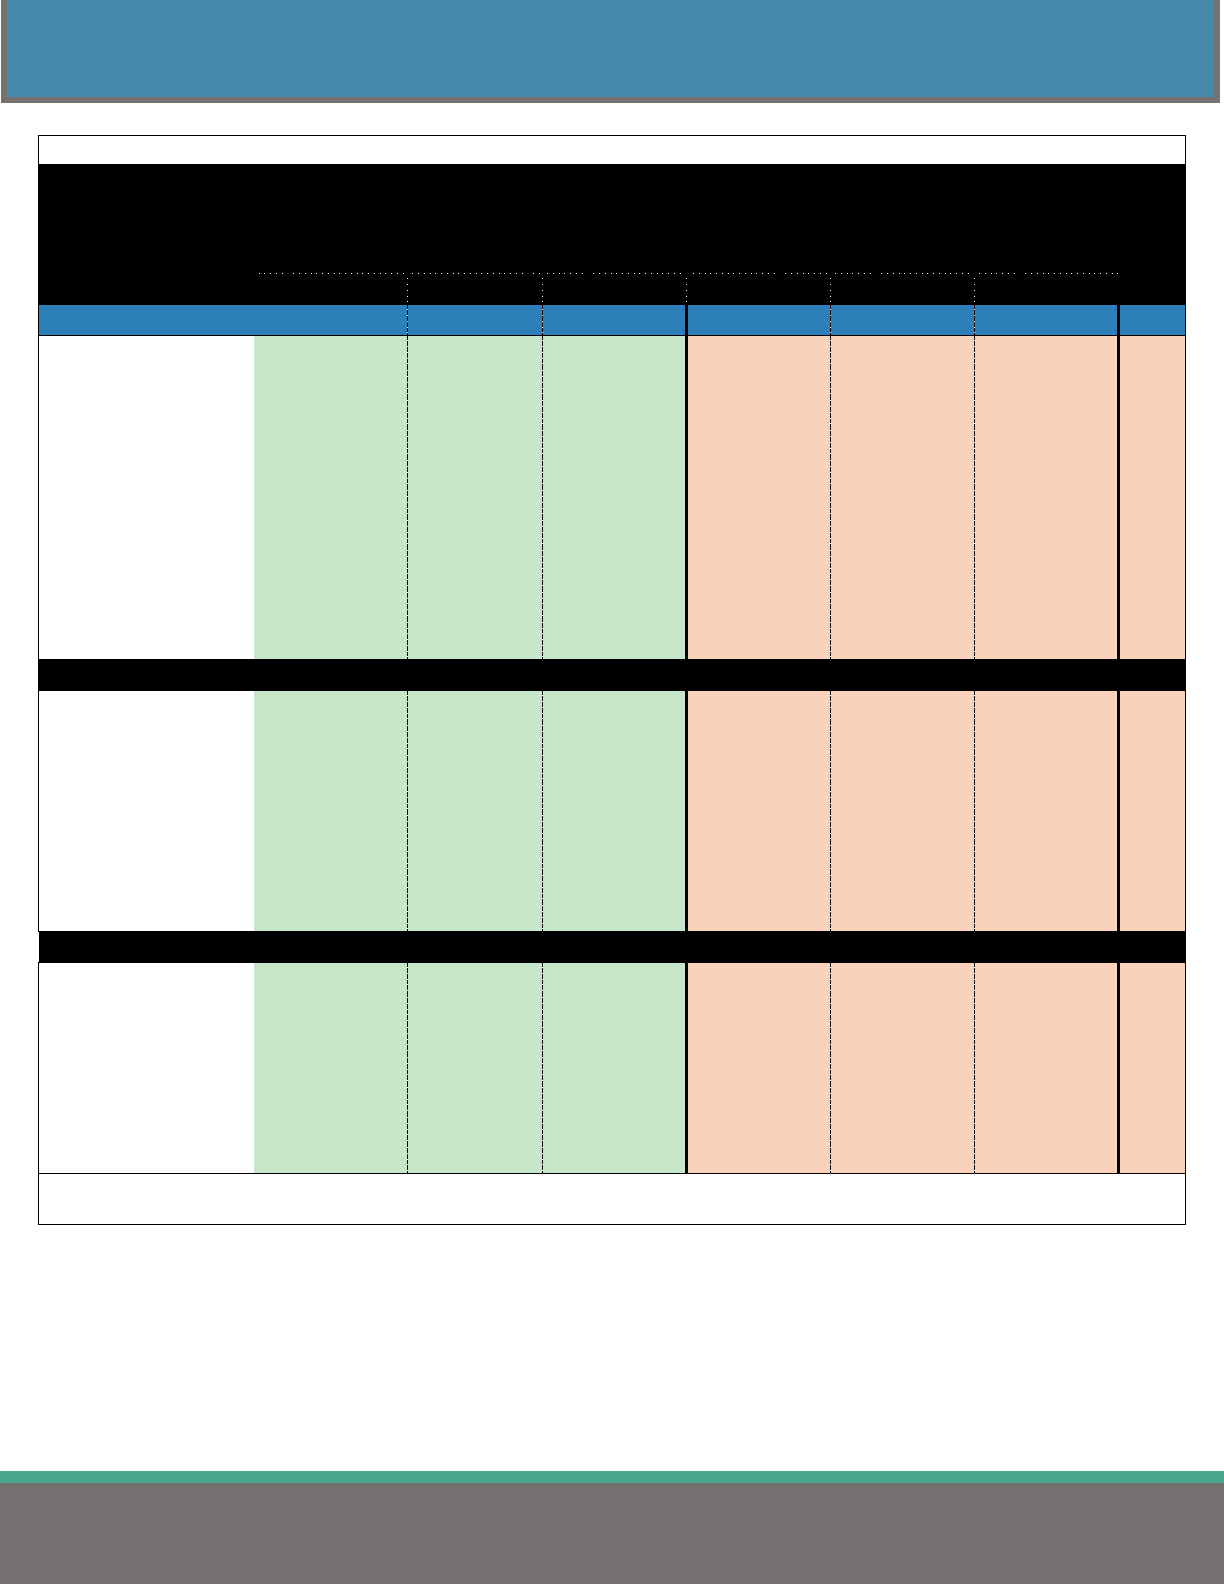
Table 3 displays the percentage of plan types offered by jurisdiction. Many employers offer more than
one type of medical plan to their employees. Therefore, the number of plans (n = 1,993) reported exceeds
the number of surveyed employers. The survey collected information for the following medical plan
types: Exclusive Provider Organization (EPO), Preferred Provider Organization (PPO), Point of Service
(POS), Health Maintenance Organization (HMO), and High Deductible Health Plan (HDHP). PPOs and
HDHPs are the two most utilized medical plan types.
Table 3
Percentage of Plan Types Offered
by Jurisdiction
Comparison Group
EPO
PPO
POS
HMO
HDHP
n
STATEWIDE
0.6%
49.7%
1.1%
1.5%
47.1%
1,993
State of Ohio 0.0% 66.7% 0.0% 0.0% 33.3% 3
Counties 2.0% 53.0% 3.3% 2.0% 39.7% 151
Cities 0.5% 46.0% 1.6% 1.9% 50.0% 372
Townships 0.0% 25.9% 1.3% 1.3% 71.5% 151
School Districts & ESCs 0.3% 55.0% 0.6% 1.3% 42.8% 1,146
Colleges & Universities 4.1% 43.1% 0.0% 1.4% 51.4% 74
Fire Districts 0.0% 15.8% 0.0% 0.0% 84.2% 19
Metro Housing Authorities 0.0% 42.0% 2.0% 2.0% 54.0% 50
Port Authorities 0.0% 20.0% 0.0% 0.0% 80.0% 5
Regional Transit Authorities 4.5% 54.6% 0.0% 4.5% 36.4% 22
NUMBER OF PLANS (n)
12
991
21
30
939
Note: Plan Types - EPO: Exclusive Provider Organization; PPO: Preferred Provider Organization; POS: Point of Service;
HMO: Health Maintenance Organization; HDHP: High Deductible Health Plan.
Note: n: number of plans.
5
2023 HEALTH INSURANCE REPORT
MEDICAL INSURANCE – OVERVIEW
MEDICAL PREMIUM INCREASES COMPARED TO SALARY INCREASES
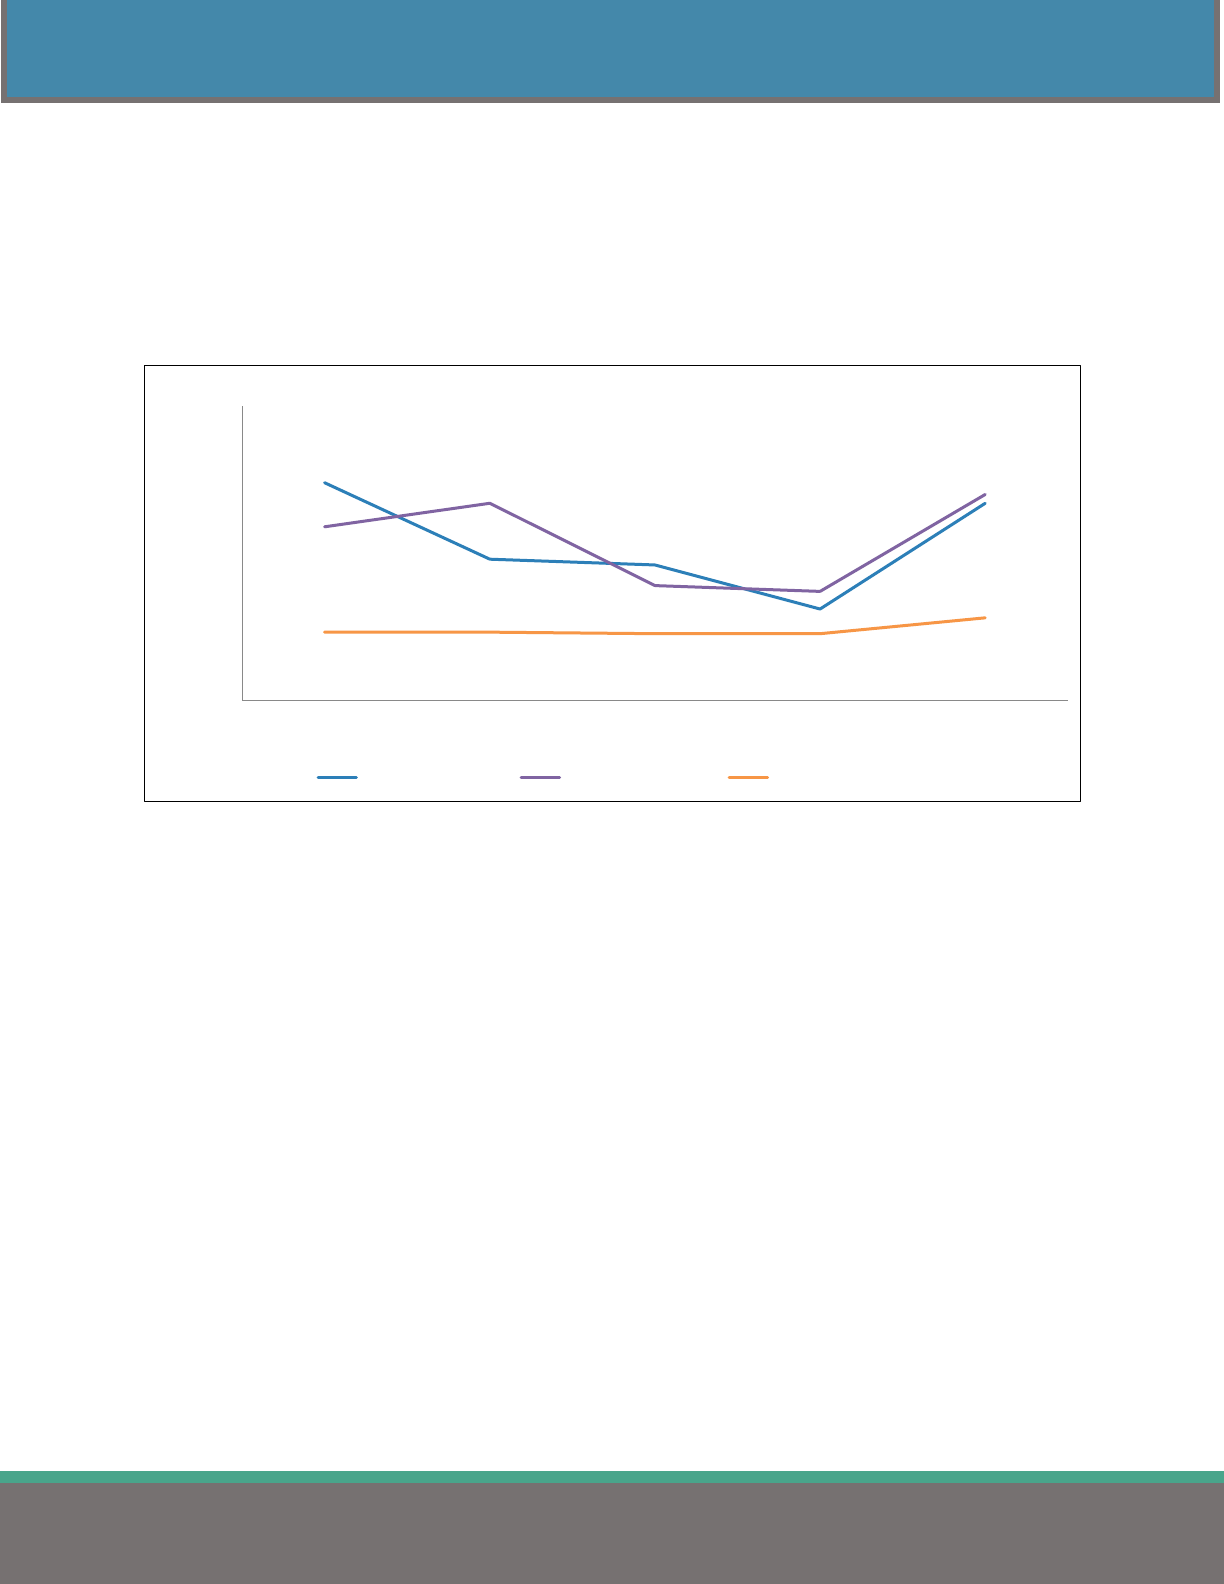
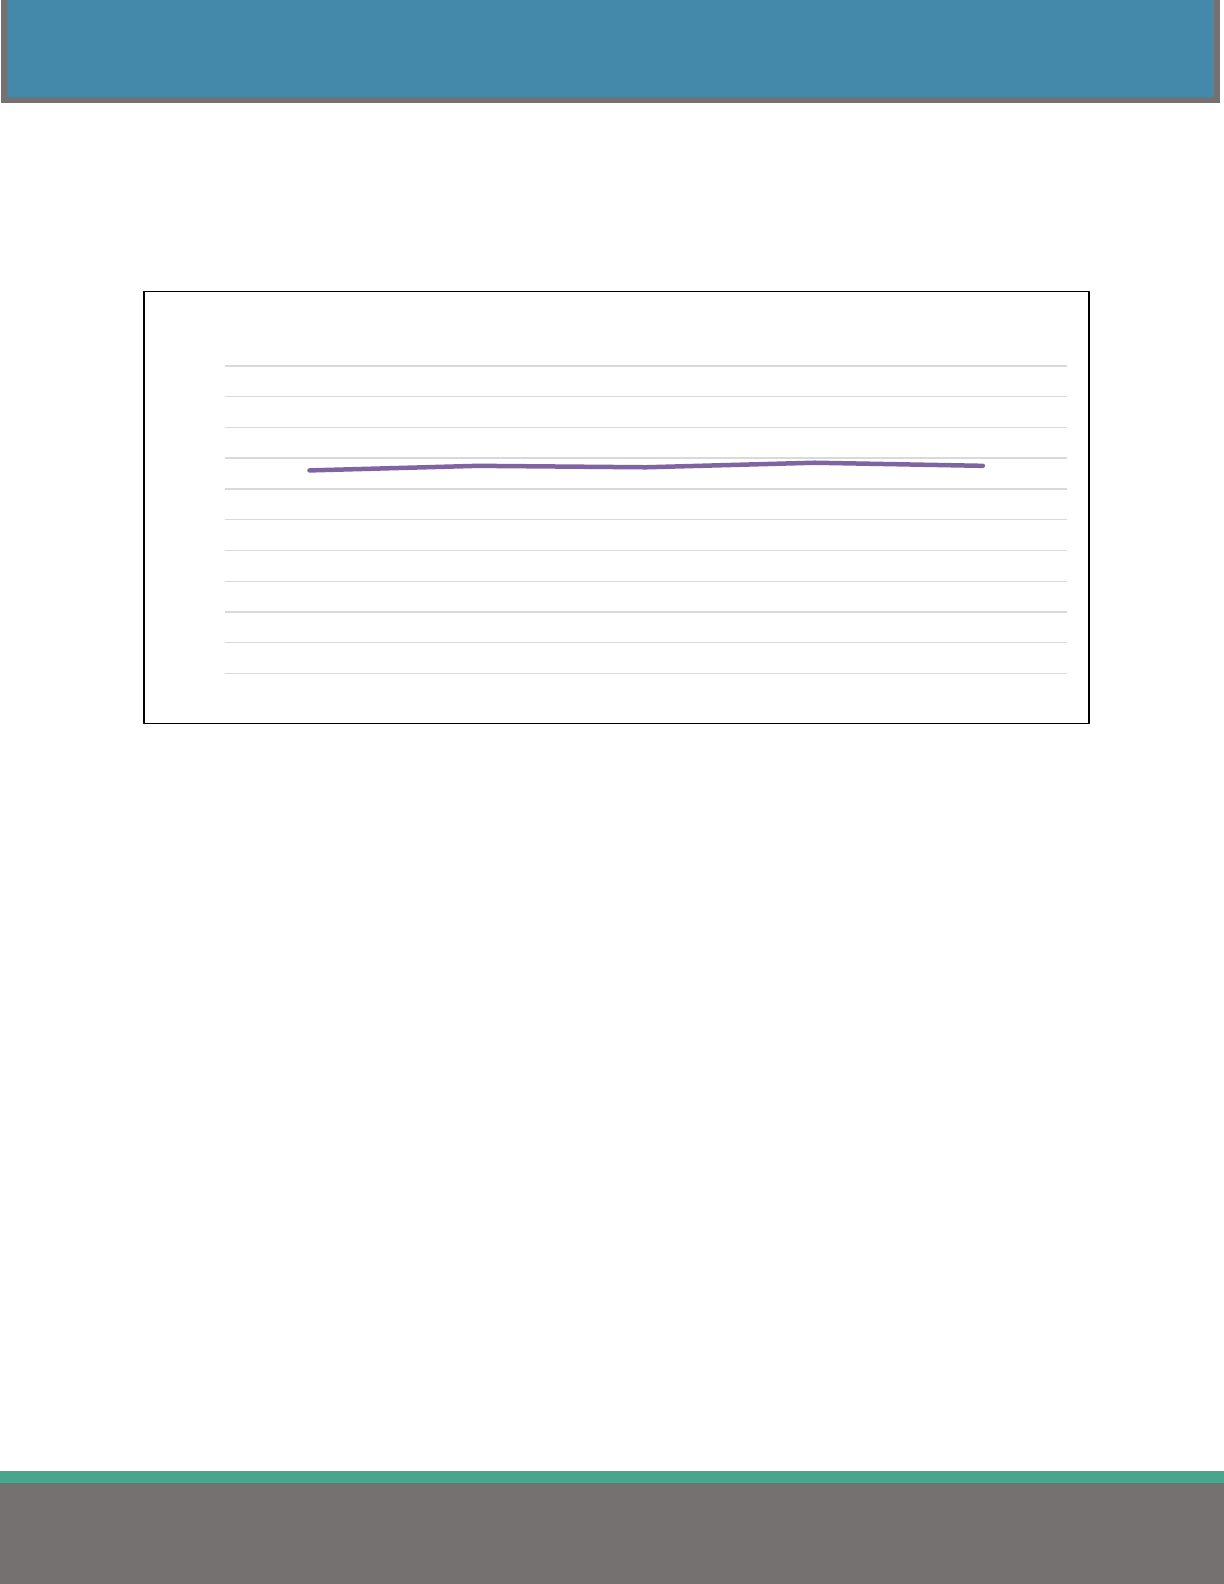
Figure 1 graphs the percent change in single and family medical premiums compared to the average
negotiated wage increase for public employees from SERB’s Annual Wage Settlement report. The
relatively flat line represents the average wage increases for public sector employees over the past five
years, ranging between 2.3% and 2.8%. Comparatively, medical insurance premiums have risen at a
higher rate.
Figure 1
7.4%
4.8%
4.6%
3.1%
6.7%
5.9%
6.7%
3.9%
3.7%
7.0%
2.3%
2.3%
2.3% 2.3%
2.8%
0%
2%
4%
6%
8%
10%
2019 2020 2021 2022 2023
Percent Increase
Statewide Annual Percent Increases in Medical Premiums
vs. Average Wage Increases
Single Premium Family Premium Average Wage Increase
6
2023 HEALTH INSURANCE REPORT
MEDICAL INSURANCE – OVERVIEW
MEDICAL PREMIUM INCREASES COMPARED TO INFLATION RATES
Table 4 compares the annual percent change in public sector medical premiums over the past ten years to
the overall national inflation and medical care inflation rates provided by the United States Bureau of
Labor Statistics. Premium rates for medical insurance in the State of Ohio increased at a higher
percentage rate than the overall national inflation and medical care inflation rates this past year.
Table 4
Annual Percent Change in Medical Care Costs,
Inflation, and Medical Care Inflation Rates
Statewide Public Sector
National
Year
Single Premium
Family Premium
n
Inflation Rate
Medical Care
2013
2.8%
2.3%
1,552
1.7%
3.2%
2014
5.0%
4.5%
1,598
1.5%
2.0%
2015
4.4%
4.3%
1,694
0.8%
3.0%
2016
1.6%
2.3%
1,753
0.7%
2.6%
2017
4.7%
4.6%
1,809
2.1%
4.1%
2018
4.6%
4.2%
1,863
2.1%
1.8%
2019
7.4%
5.9%
2,009
1.9%
2.0%
2020
4.8%
6.7%
1,952
2.3%
4.6%
2021
4.6%
3.9%
2,067
1.4%
1.8%
2022
3.1%
3.7%
2,046
7.0%
2.2%
2023
6.7%
7.0%
1,993
6.5%
4.0%
Note: National; includes both public and private sector employers nationwide.
Note: United States Bureau of Labor Statistics, Consumer Price Index, December 2022
https://www.bls.gov/news.release/archives/cpi_01122023.pdf
Note: n: number of plans.

7
2023 HEALTH INSURANCE REPORT
MEDICAL INSURANCE – ALL PLAN TYPES
MEDICAL INSURANCE – ALL PLAN TYPES
MEDICAL PREMIUMS
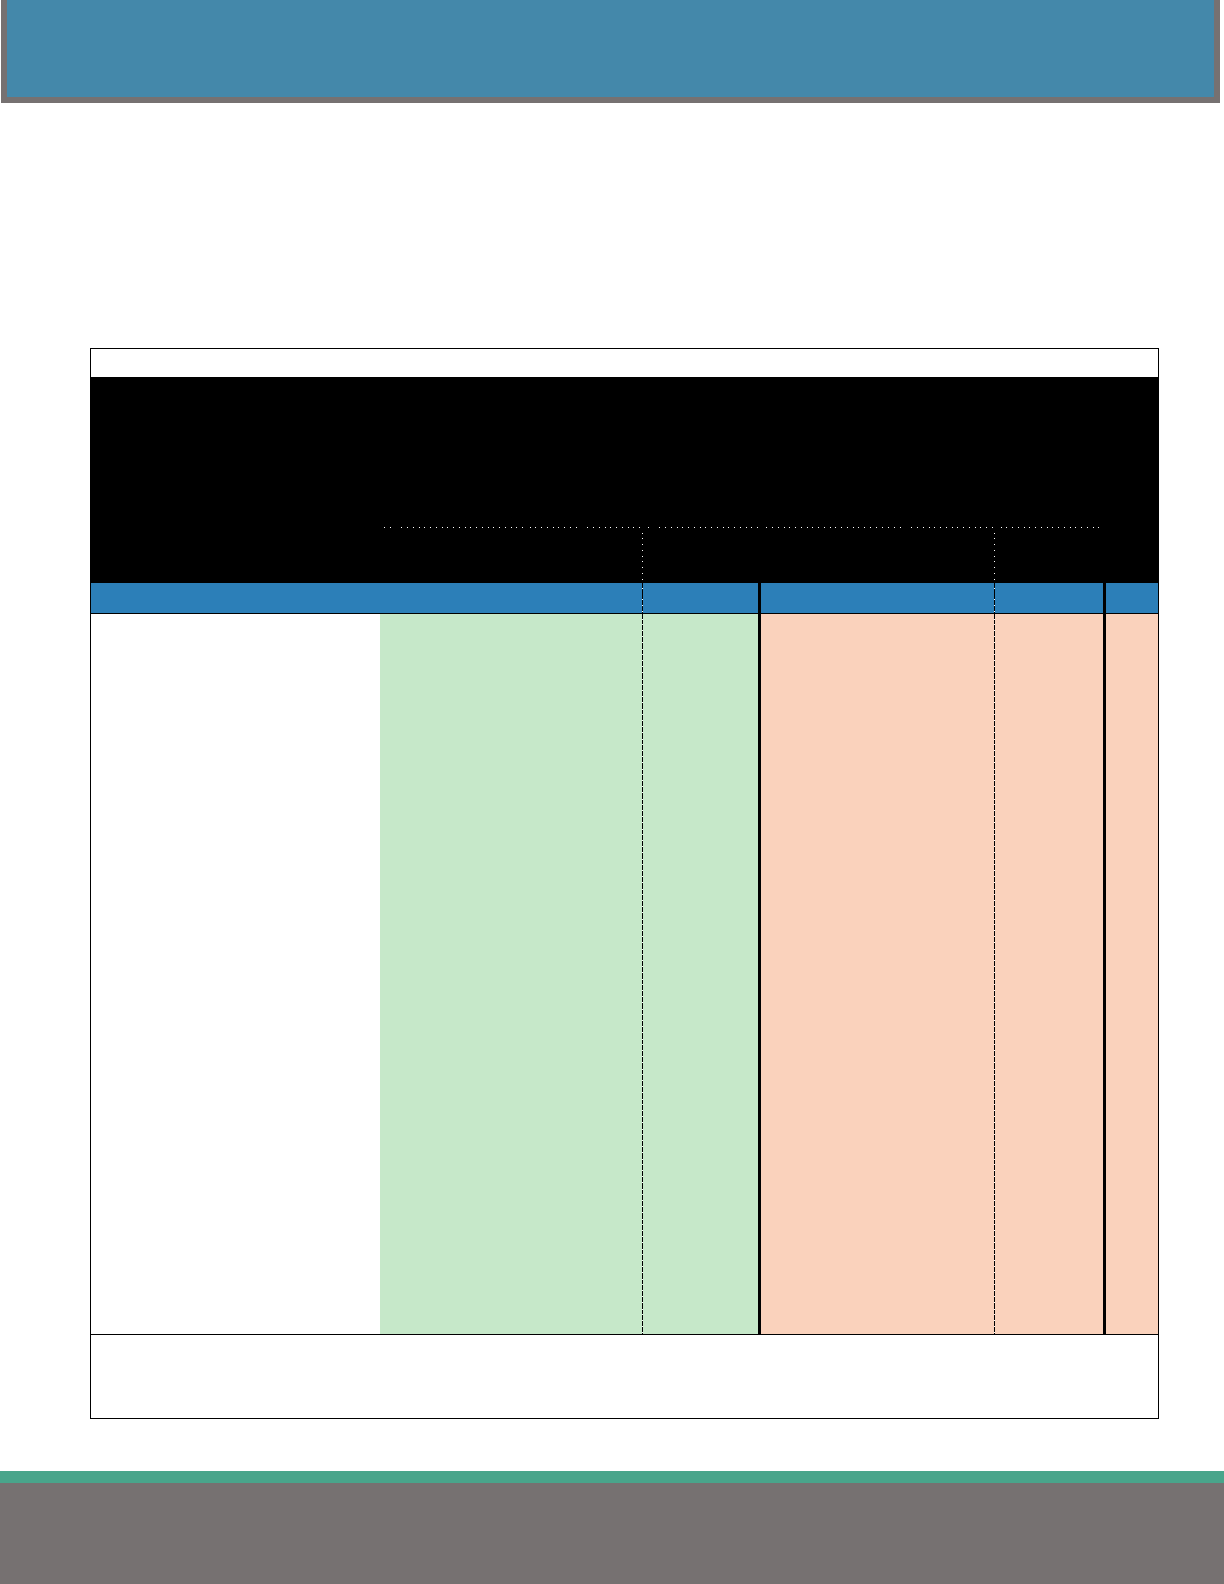
Table 5 breaks down the average medical premiums and the contribution amounts shared by the employer
and the employee. These averages include the costs of prescription, dental, and vision coverages when
included with the medical premiums. Averages presented in all tables in this report are not weighted,
meaning each reporting jurisdiction counts as one, regardless of size.
Table 5
Average Monthly Employer & Employee Contributions
Towards Medical Premium
(All Medical Plan Types)
Single
Family
Comparison Group
Employer
Share
Employee
Share
Total
Employer
Share
Employee
Share
Total
n
STATEWIDE $ 710.80 $ 103.13 $ 813.93 $ 1,854.48 $ 294.68 $ 2,149.16 1,993
State of Ohio $ 669.67 $ 90.33 $ 760.00 $ 1,896.33 $ 266.67 $ 2,163.00 3
Counties $ 702.38 $ 103.29 $ 805.67 $ 1,892.24 $ 305.03 $ 2,197.27 151
Less than 50,000 $ 725.79 $ 107.78 $ 833.57 $ 1,946.44 $ 327.51 $ 2,273.95 57
50,000 - 149,999 $ 686.38 $ 106.98 $ 793.36 $ 1,908.55 $ 315.40 $ 2,223.95 54
150,000 or more $ 691.22 $ 92.04 $ 783.26 $ 1,794.33 $ 259.57 $ 2,053.90 40
Cities $ 726.00 $ 92.23 $ 818.23 $ 1,993.65 $ 258.74 $ 2,252.39 372
Less than 25,000 $ 719.60 $ 89.45 $ 809.05 $ 1,997.25 $ 256.98 $ 2,254.23 267
25,000 - 99,999 $ 744.04 $ 100.16 $ 844.20 $ 2,025.63 $ 266.95 $ 2,292.58 96
100,000 or more $ 726.74 $ 91.37 $ 818.11 $ 1,563.50 $ 225.07 $ 1,788.57 9
Townships $ 752.88 $ 67.14 $ 820.02 $ 2,005.46 $ 196.09 $ 2,201.55 151
Less than 10,000 $ 777.57 $ 55.96 $ 833.53 $ 2,064.90 $ 162.94 $ 2,227.84 75
10,000 - 29,999 $ 787.73 $ 75.07 $ 862.80 $ 2,040.59 $ 206.92 $ 2,247.51 54
30,000 or more $ 600.07 $ 83.52 $ 683.59 $ 1,742.98 $ 271.94 $ 2,014.92 22
School Districts & ESCs $ 706.30 $ 110.80 $ 817.10 $ 1,780.25 $ 314.08 $ 2,094.33 1,146
Less than 1,000 $ 711.78 $ 104.56 $ 816.34 $ 1,819.91 $ 287.09 $ 2,107.00 301
1,000 - 2,499 $ 713.75 $ 114.29 $ 828.04 $ 1,798.56 $ 313.67 $ 2,112.23 461
2,500 - 9,999 $ 679.23 $ 107.52 $ 786.75 $ 1,709.34 $ 306.48 $ 2,015.82 266
10,000 or more $ 722.12 $ 116.43 $ 838.55 $ 1,758.29 $ 453.07 $ 2,211.36 32
Educational Svc Centers $ 724.75 $ 122.46 $ 847.21 $ 1,770.73 $ 382.49 $ 2,153.22 86
Colleges & Universities $ 668.89 $ 118.44 $ 787.33 $ 1,877.56 $ 357.03 $ 2,234.59 74
Fire Districts $ 519.98 $ 61.43 $ 581.41 $ 1,574.77 $ 199.32 $ 1,774.09 19
Metro Housing Authorities $ 761.29 $ 103.02 $ 864.31 $ 2,137.87 $ 318.01 $ 2,455.88 50
Port Authorities $ 572.10 $ 78.93 $ 651.03 $ 1,689.55 $ 233.75 $ 1,923.30 5
Regional Transit Authorities $ 719.64 $ 102.34 $ 821.98 $ 1,798.40 $ 278.72 $ 2,077.12 22
Note: Rows formatted with bold font include all medical plans reported for the comparison group.
Note: Includes plans where employees contribute $0 to the medical premium.
Note: Includes plans where the medical premium includes the cost of prescription and dental.
Note: n: number of plans
8
2023 HEALTH INSURANCE REPORT
MEDICAL INSURANCE – ALL PLAN TYPES
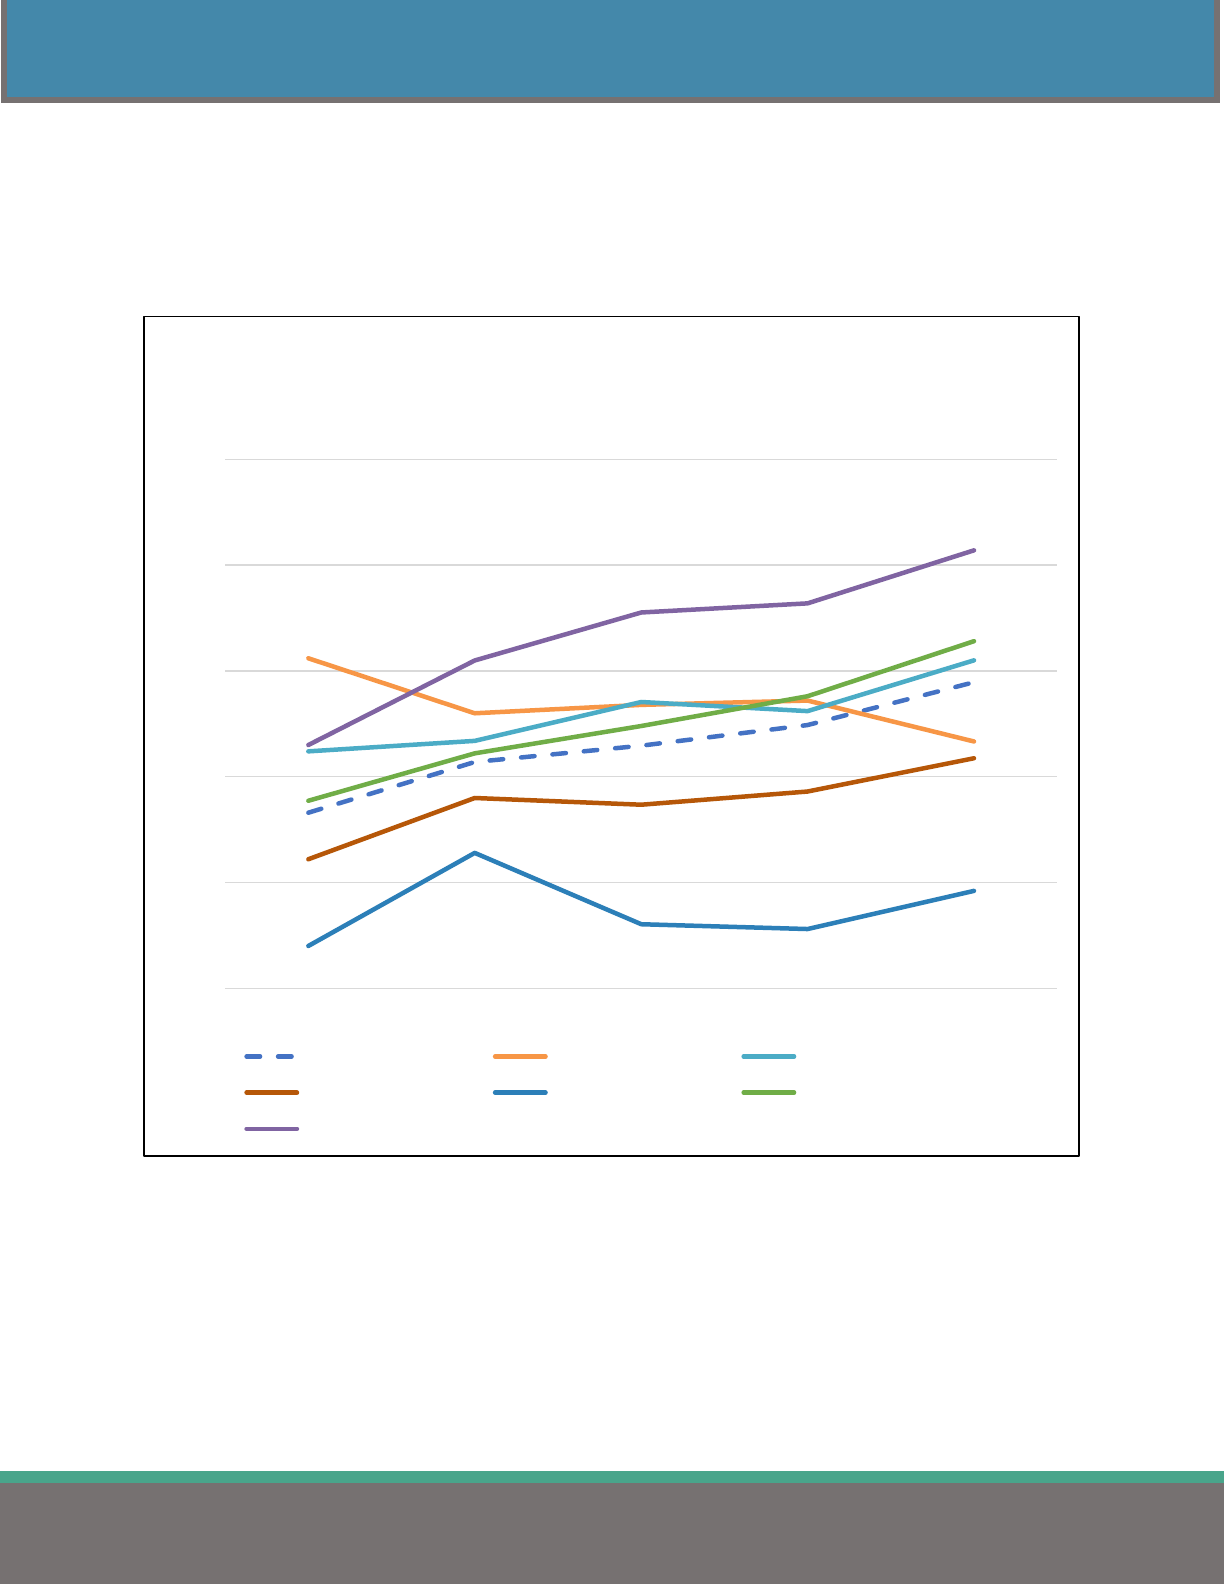
Figure 2 displays the average monthly employee contribution to family premiums in Table 5 over the past
five years. The chart illustrates that monthly family contributions have continued to increase over the last
few years while the employee percent contribution towards the premium remains almost unchanged, as
described in Figure 4 on page 12.
Figure 2
The statewide average, represented by the dotted line, shows that the employee contribution
towards the family premium increased by $62.00 or 26.4% over the last five years (2019-2023).
$150
$200
$250
$300
$350
$400
2019 2020 2021 2022 2023
Average Monthly Employee Contribution
Towards Family Medical Premium
(All Medical Plan Types)
Statewide Average State of Ohio Counties
Cities Townships School Districts & ESC
Colleges & Universities
9
2023 HEALTH INSURANCE REPORT
MEDICAL INSURANCE – ALL PLAN TYPES
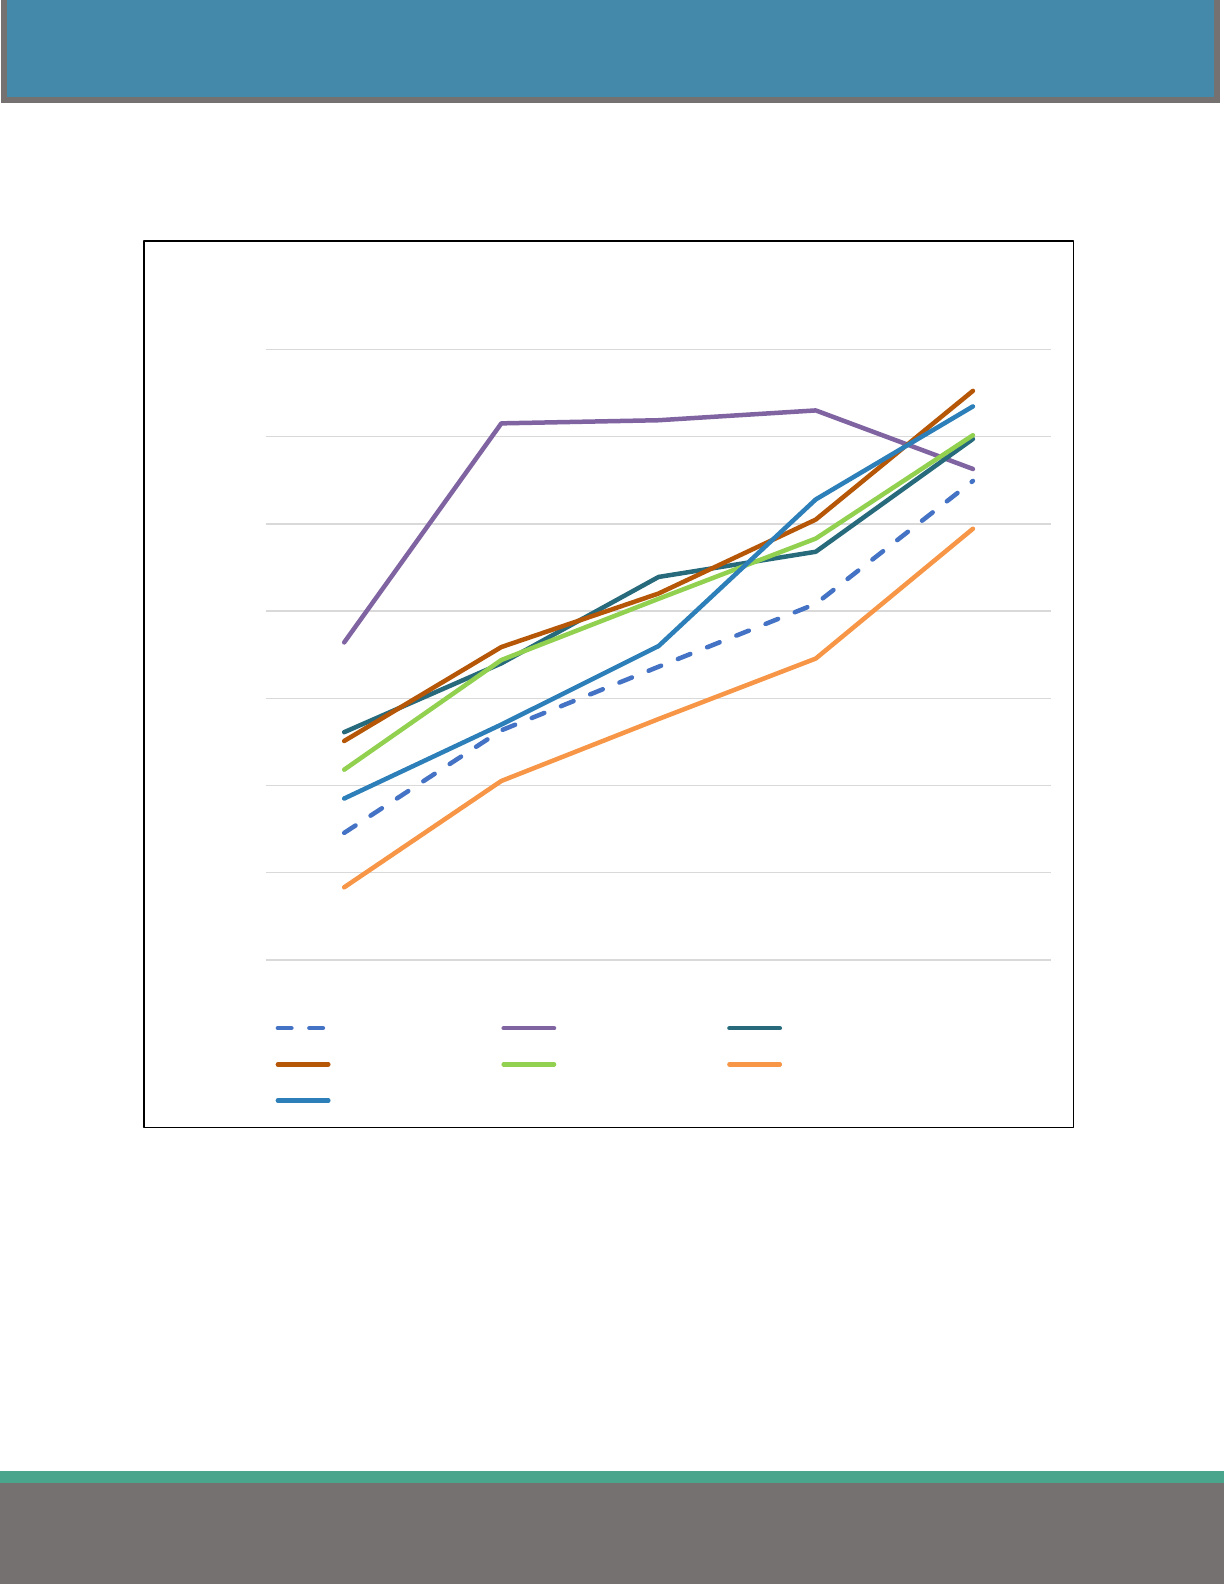
Figure 3 displays the statewide total monthly family premium in Table 5 over the past five years by
jurisdiction.
Figure 3
The statewide average, represented by the dotted line, shows that the family premium increased by
$403.44 or 23.1% over the last five years (2019-2023).
$1,600.00
$1,700.00
$1,800.00
$1,900.00
$2,000.00
$2,100.00
$2,200.00
$2,300.00
2019 2020 2021 2022 2023
Average Total Monthly Family Premium by Jurisdiction
(All Medical Plan Types)
Statewide State of Ohio County
City Township School Districts
College/Universities
10
2023 HEALTH INSURANCE REPORT
MEDICAL INSURANCE – ALL PLAN TYPES
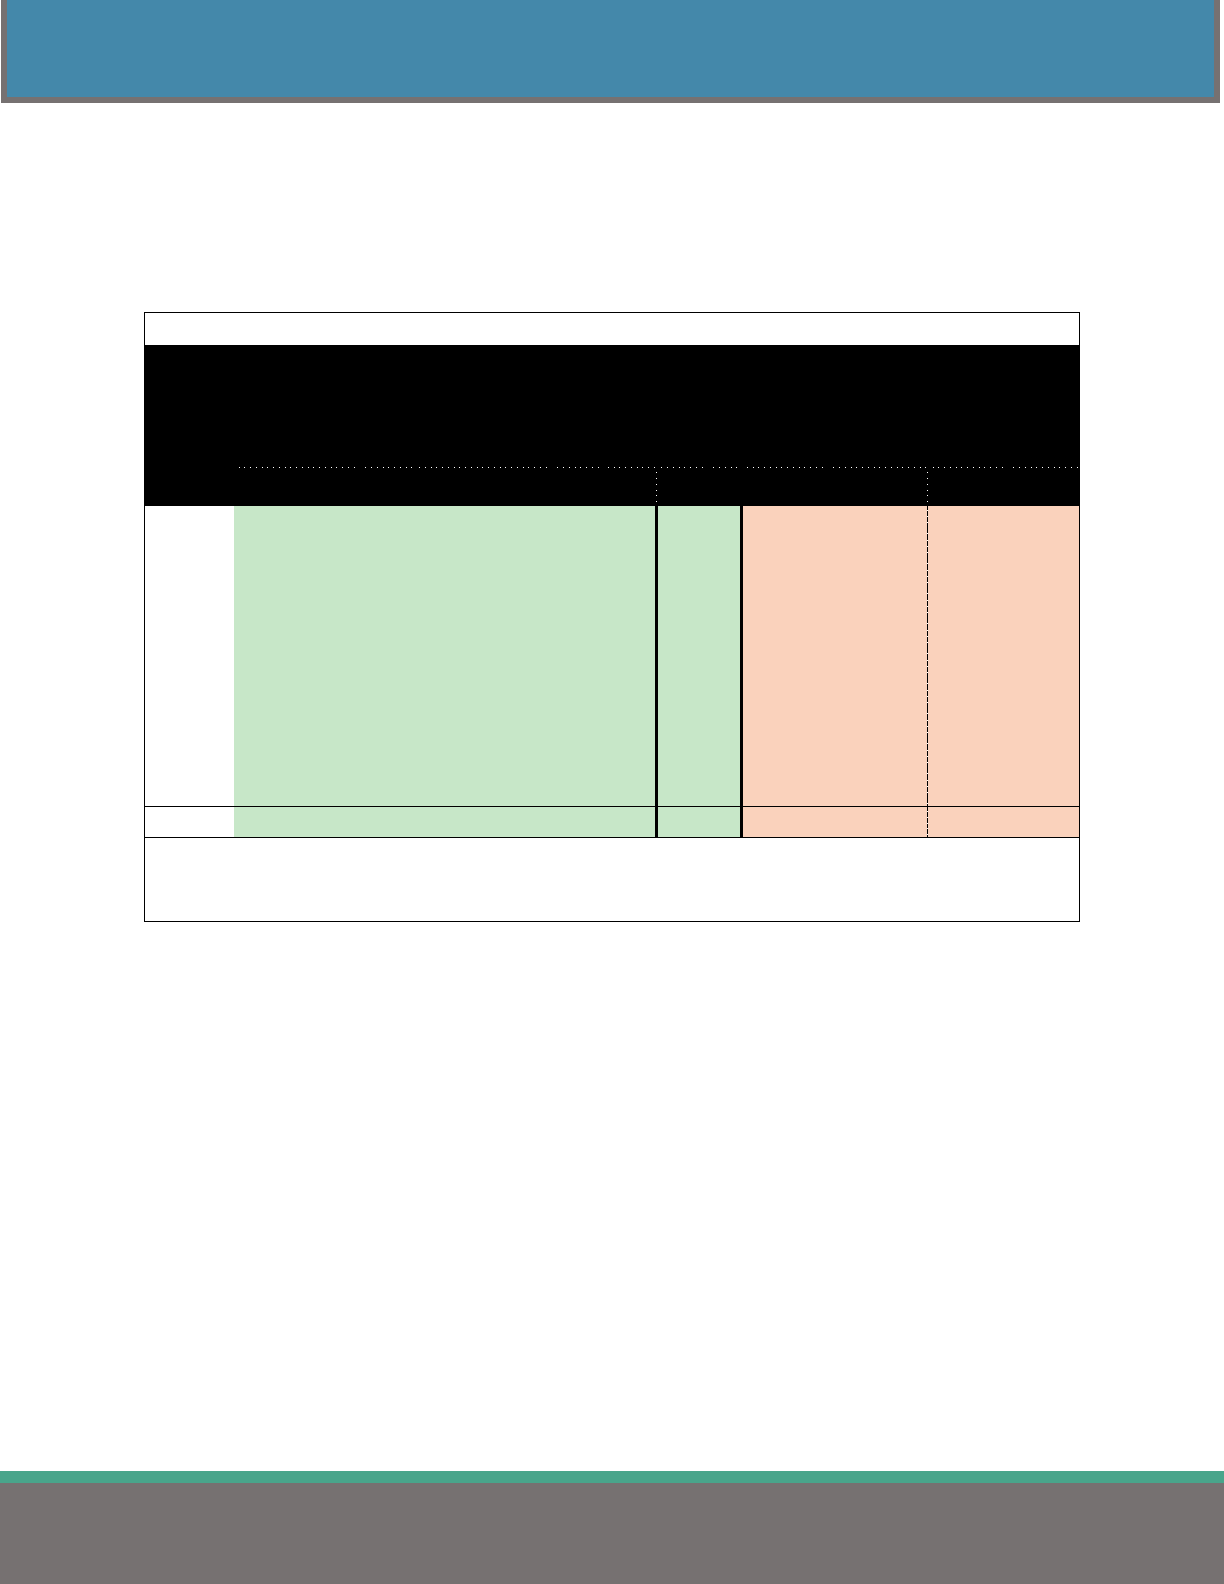
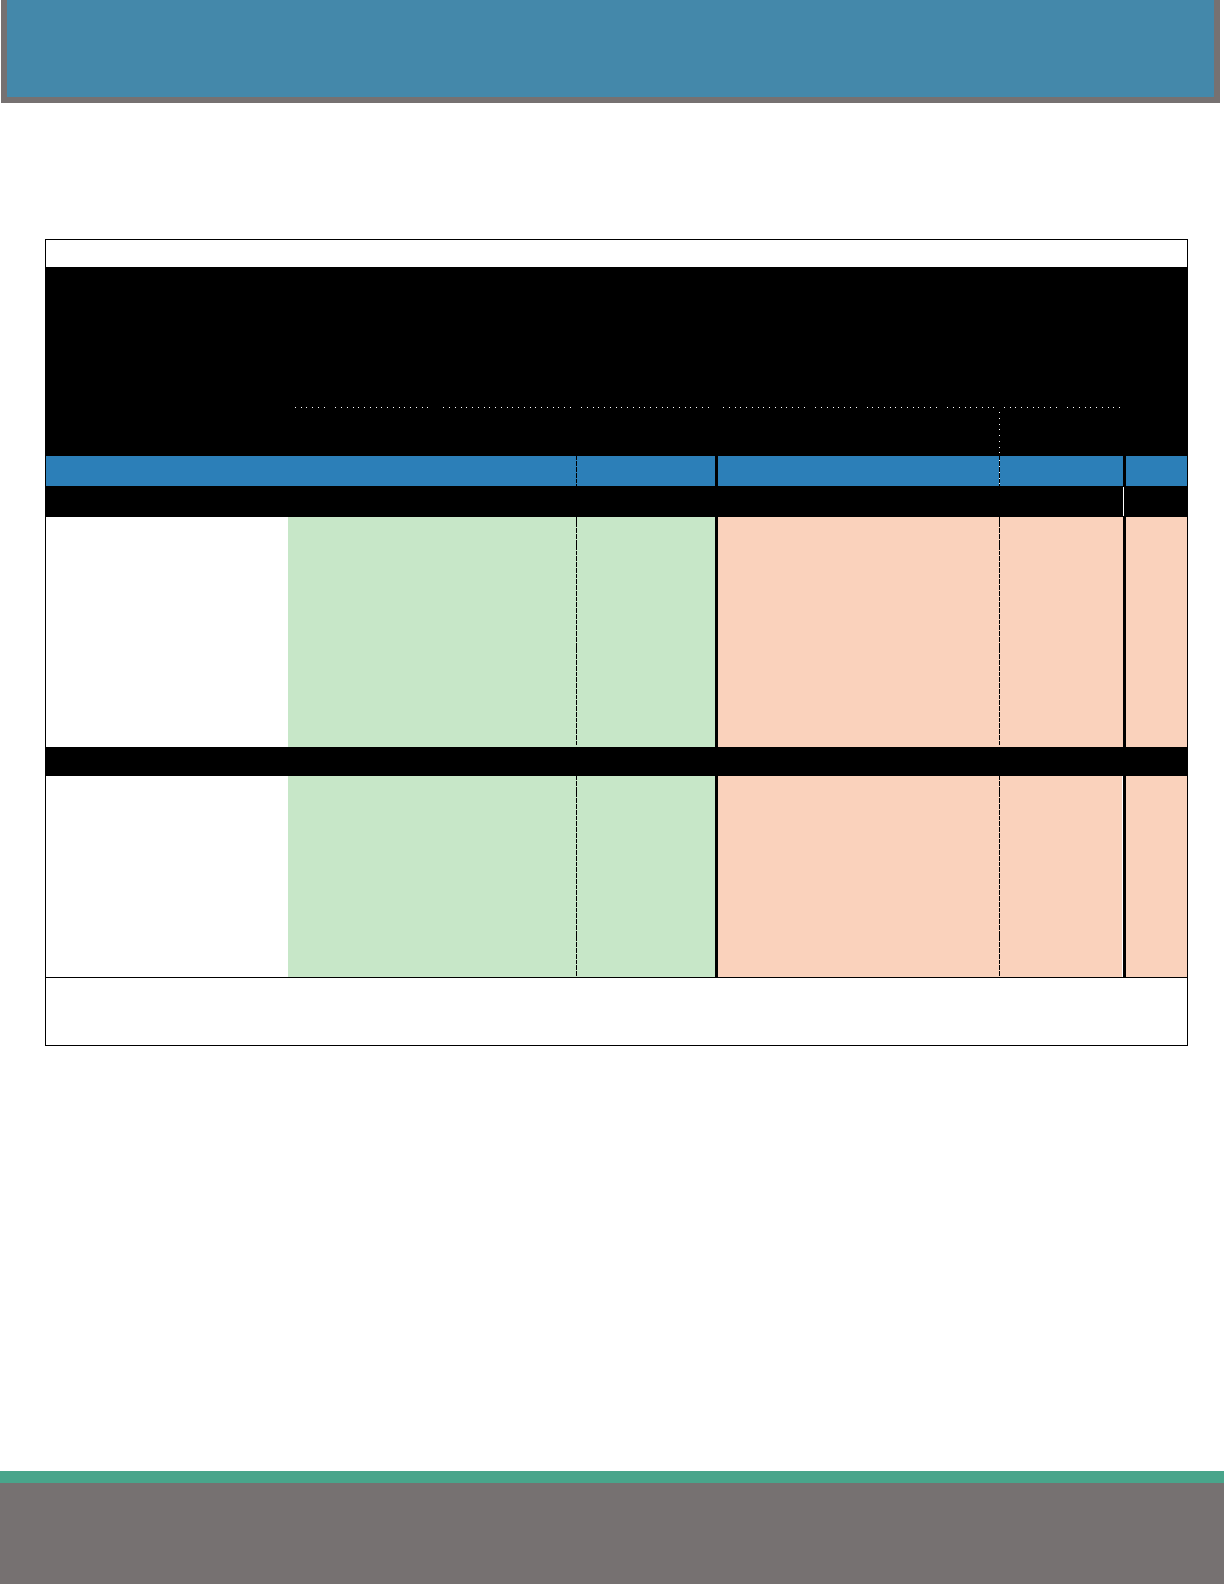
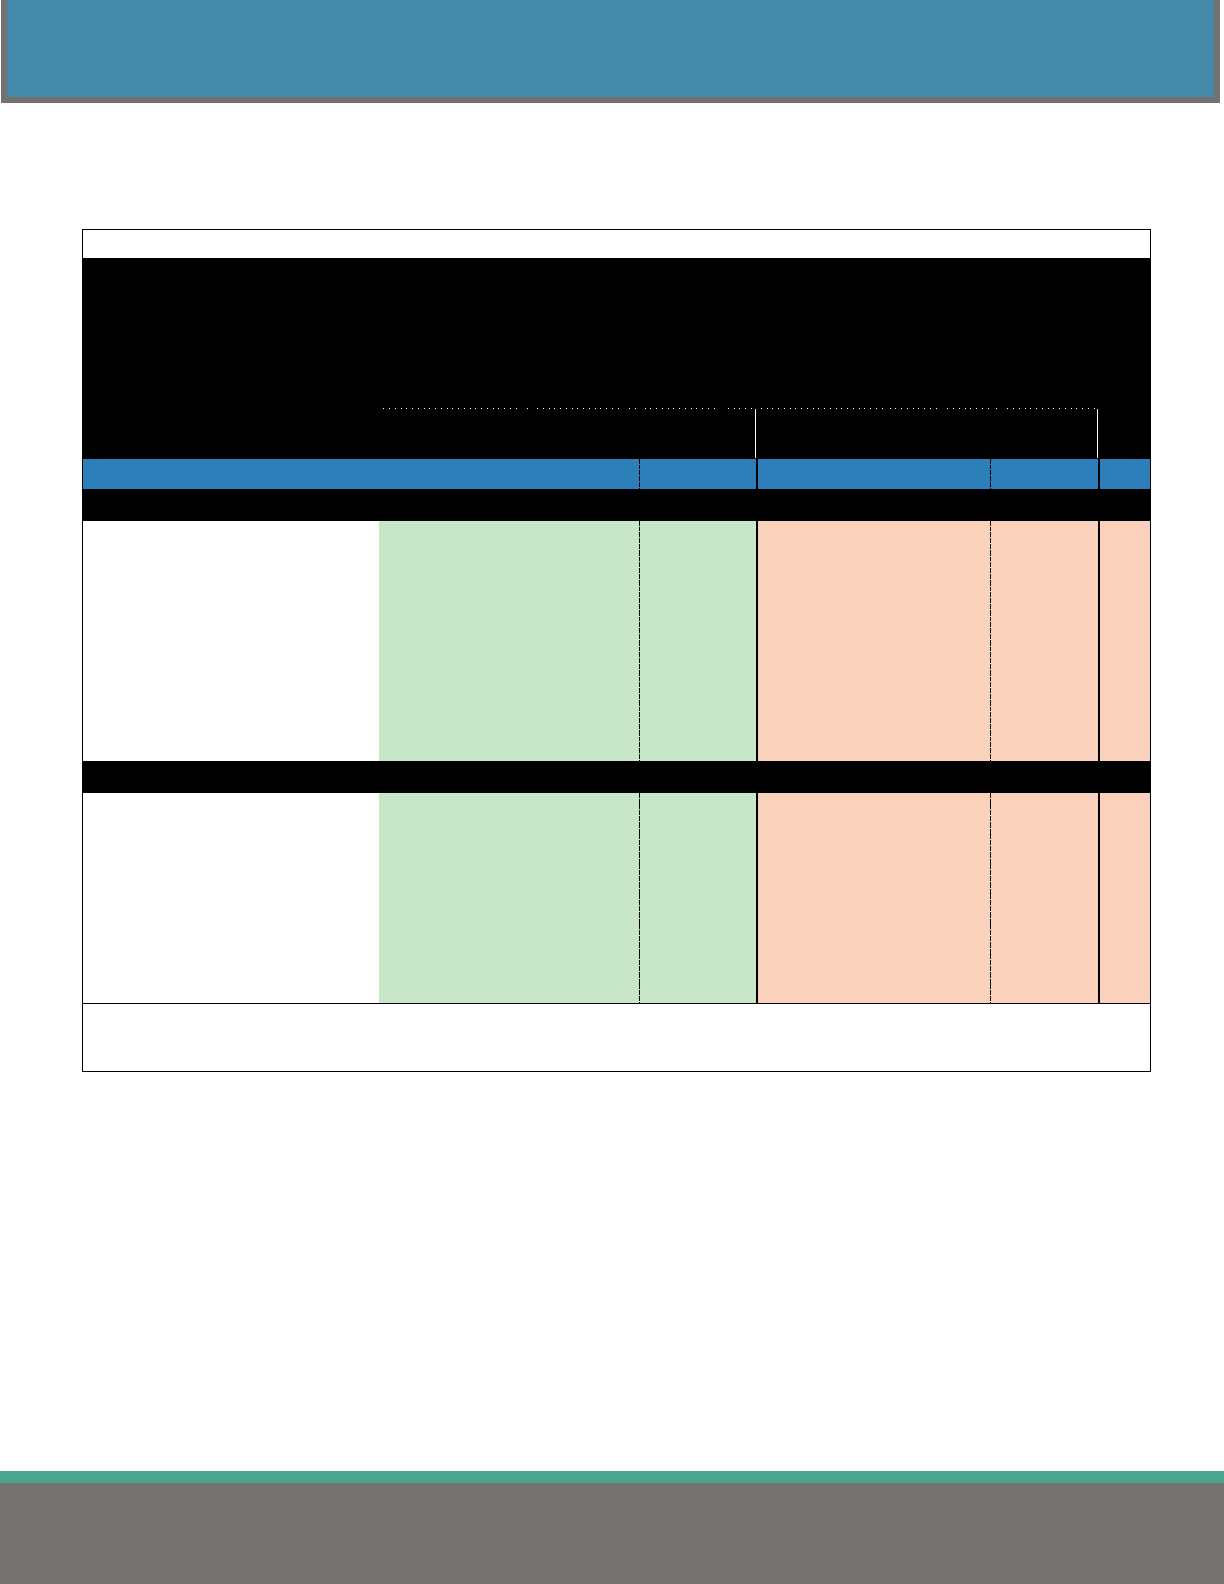
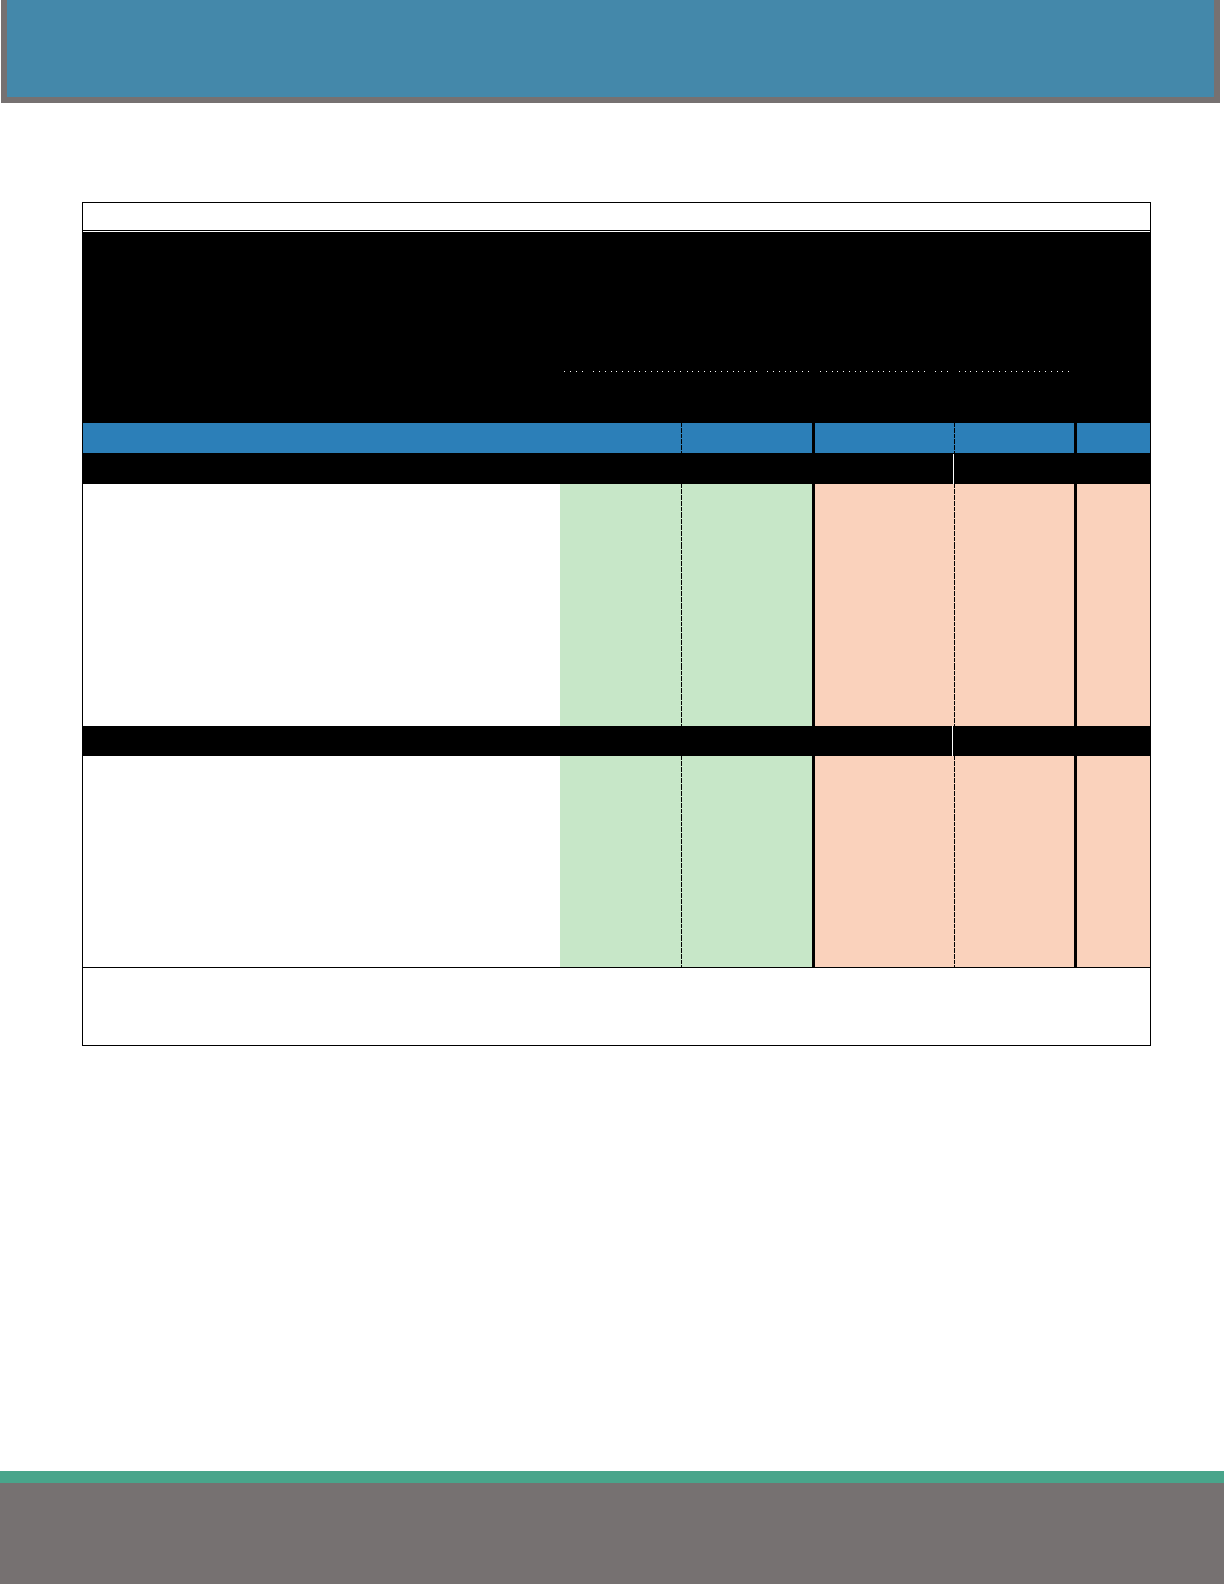
Table 6 organizes the same data in Table 5 by region and by the number of employees covered. These
averages include the costs of prescription, dental, and vision coverages when included with the medical
premiums. A breakdown of the regions is on page 61.
Table 6
Average Monthly Employer & Employee Contributions
Towards Medical Premium by Region
(All Medical Plan Types)
Single
Family
Comparison Group
Employer
Share
Employee
Share
Total
Employer
Share
Employee
Share
Total
n
STATEWIDE $ 710.80
$ 103.13
$ 813.93 $ 1,854.48 $ 294.68 $ 2,149.16 1,993
REGION
1 - Akron/Canton $ 699.61
$ 96.55
$ 796.16 $ 1,846.37 $ 250.97 $ 2,097.34 230
2 - Cincinnati $ 650.16
$ 101.14
$ 751.30 $ 1,731.11 $ 298.61 $ 2,029.72 222
3 - Cleveland $ 683.15
$ 88.70
$ 771.85 $ 1,787.72 $ 228.55 $ 2,016.27 344
4 - Columbus $ 768.12
$ 117.39
$ 885.51 $ 1,949.34 $ 356.27 $ 2,305.61 354
5 - Dayton $ 691.61
$ 125.04
$ 816.65 $ 1,865.64 $ 361.70 $ 2,227.34 263
6 - Southeast Ohio $ 819.99
$ 110.52
$ 930.51 $ 2,017.59 $ 337.60 $ 2,355.19 167
7 - Toledo $ 675.85
$ 99.52
$ 775.37 $ 1,785.33 $ 291.58 $ 2,076.91 278
8 - Warren/Youngstown $ 724.05
$ 73.43
$ 797.48 $ 1,906.88 $ 191.46 $ 2,098.34 135
EMPLOYEES COVERED
1 - 49 $ 739.39
$ 86.54
$ 825.93
$ 1,981.95 $ 260.35 $ 2,242.30
333
50 - 99 $ 710.24
$ 95.19
$ 805.43
$ 1,896.47 $ 264.04 $ 2,160.51
334
100 - 149 $ 709.06
$ 104.51
$ 813.57
$ 1,837.11 $ 287.25 $ 2,124.36
388
150 - 249 $ 719.35
$ 115.18
$ 834.53
$ 1,847.94 $ 321.64 $ 2,169.58
415
250 - 499 $ 704.79
$ 103.81
$ 808.60
$ 1,813.05 $ 296.86 $ 2,109.91
298
500 - 999 $ 669.09
$ 117.11
$ 786.20
$ 1,707.28 $ 343.74 $ 2,051.02
133
1,000 or more $ 662.08
$ 106.73
$ 768.81
$ 1,716.50 $ 353.40 $ 2,069.90
92
Note: Includes plans where employees contribute $0 to the medical premium.
Note: Includes plans where the medical premium includes the cost of prescription and dental.
Note: n: number of plans.
11
2023 HEALTH INSURANCE REPORT
MEDICAL INSURANCE – ALL PLAN TYPES
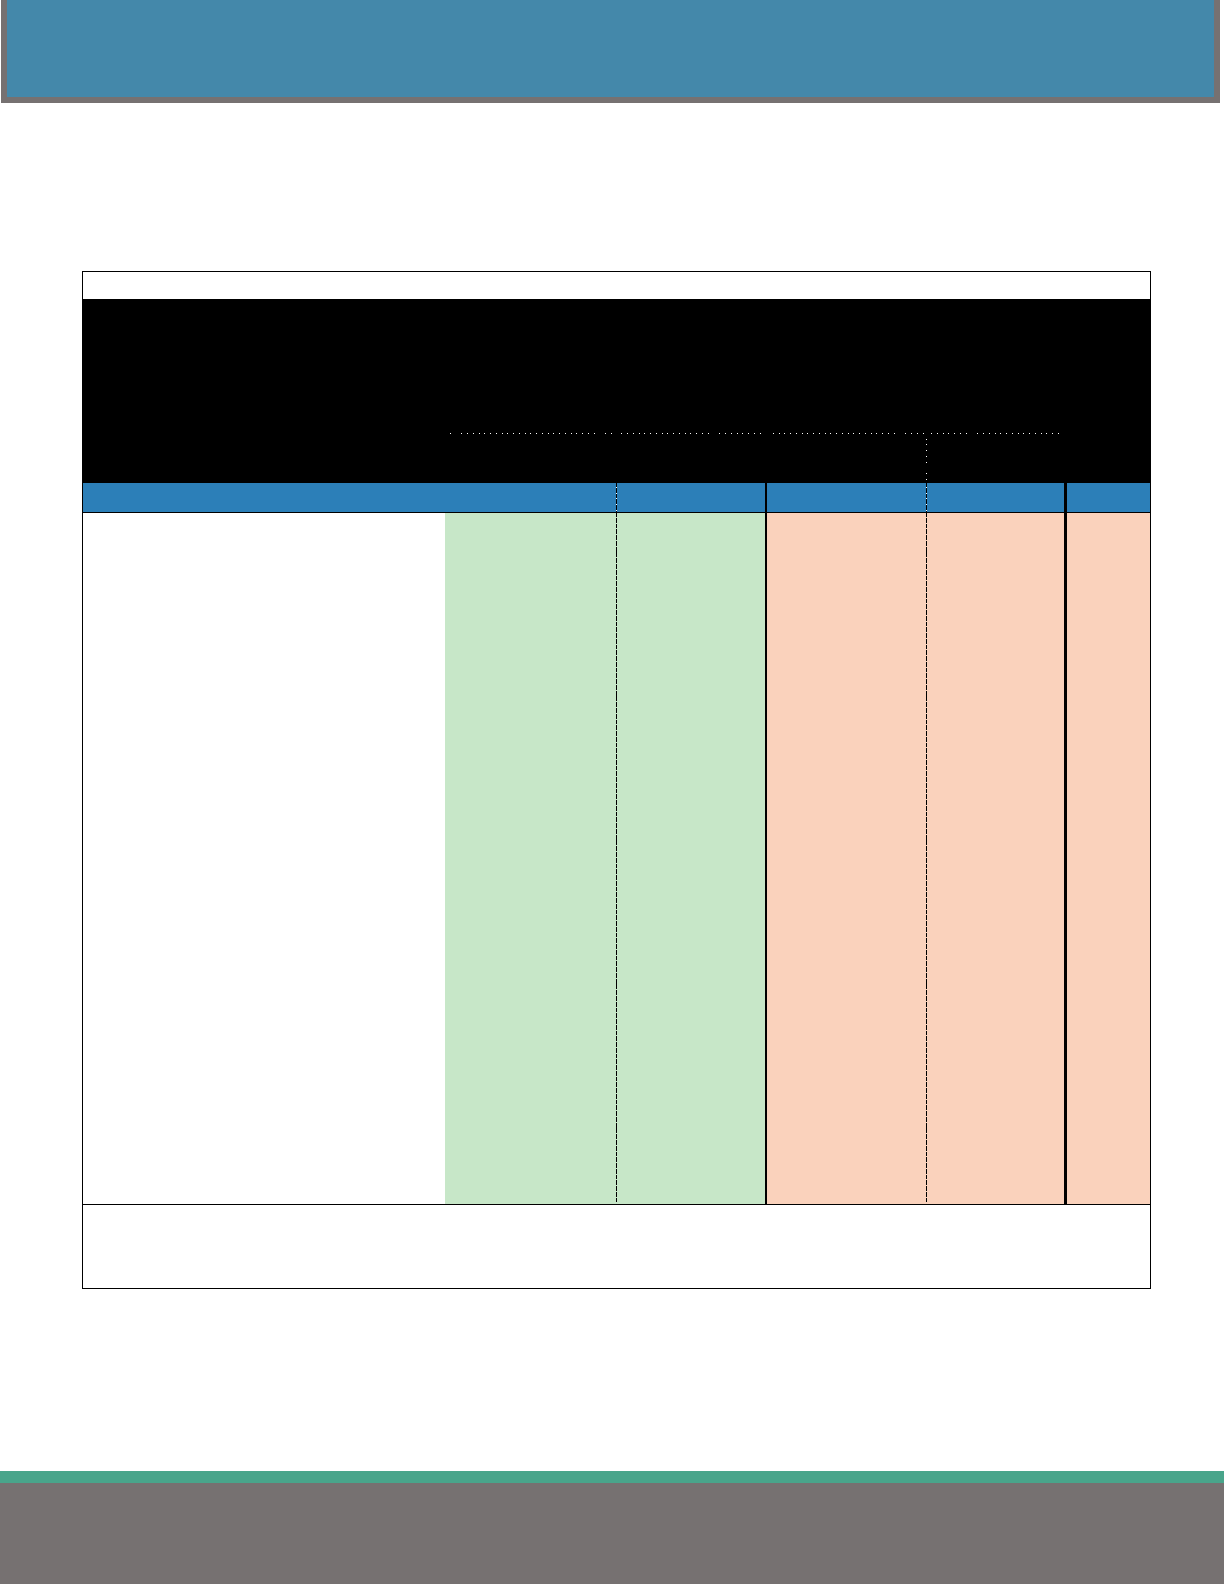
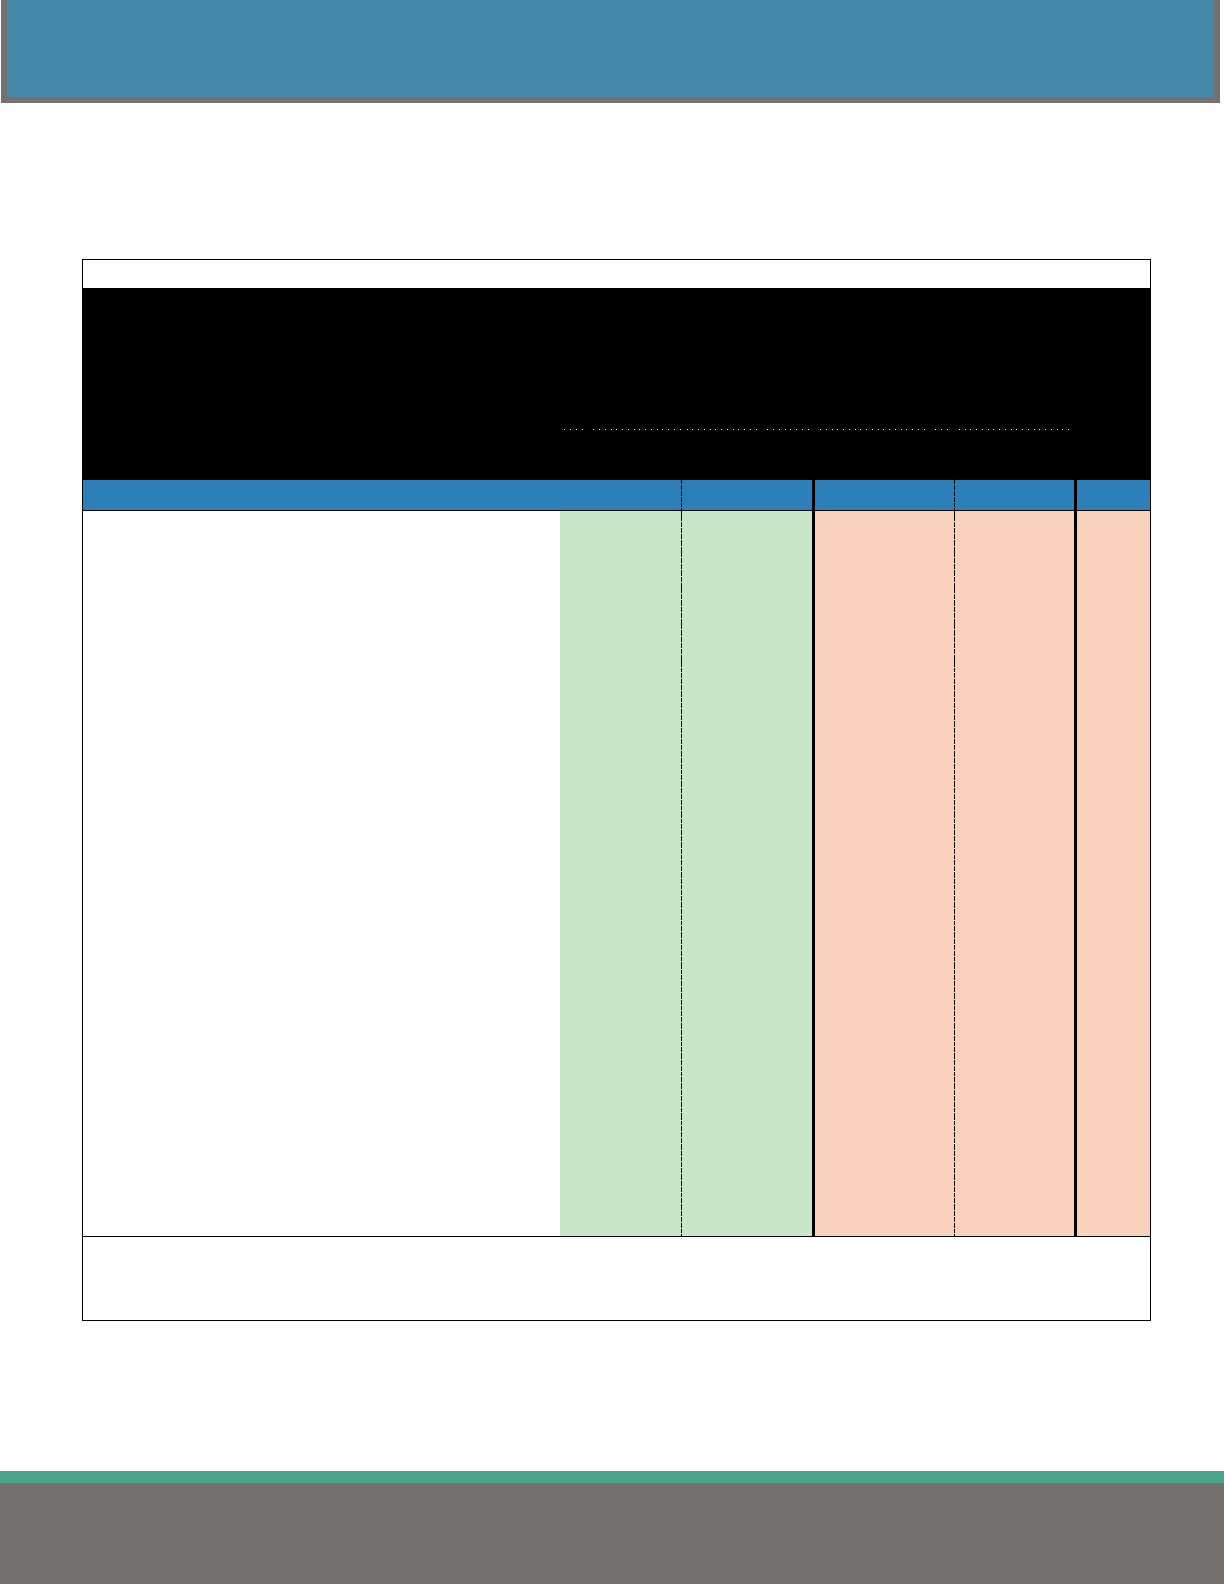
EMPLOYER & EMPLOYEE SHARE OF MEDICAL PREMIUM
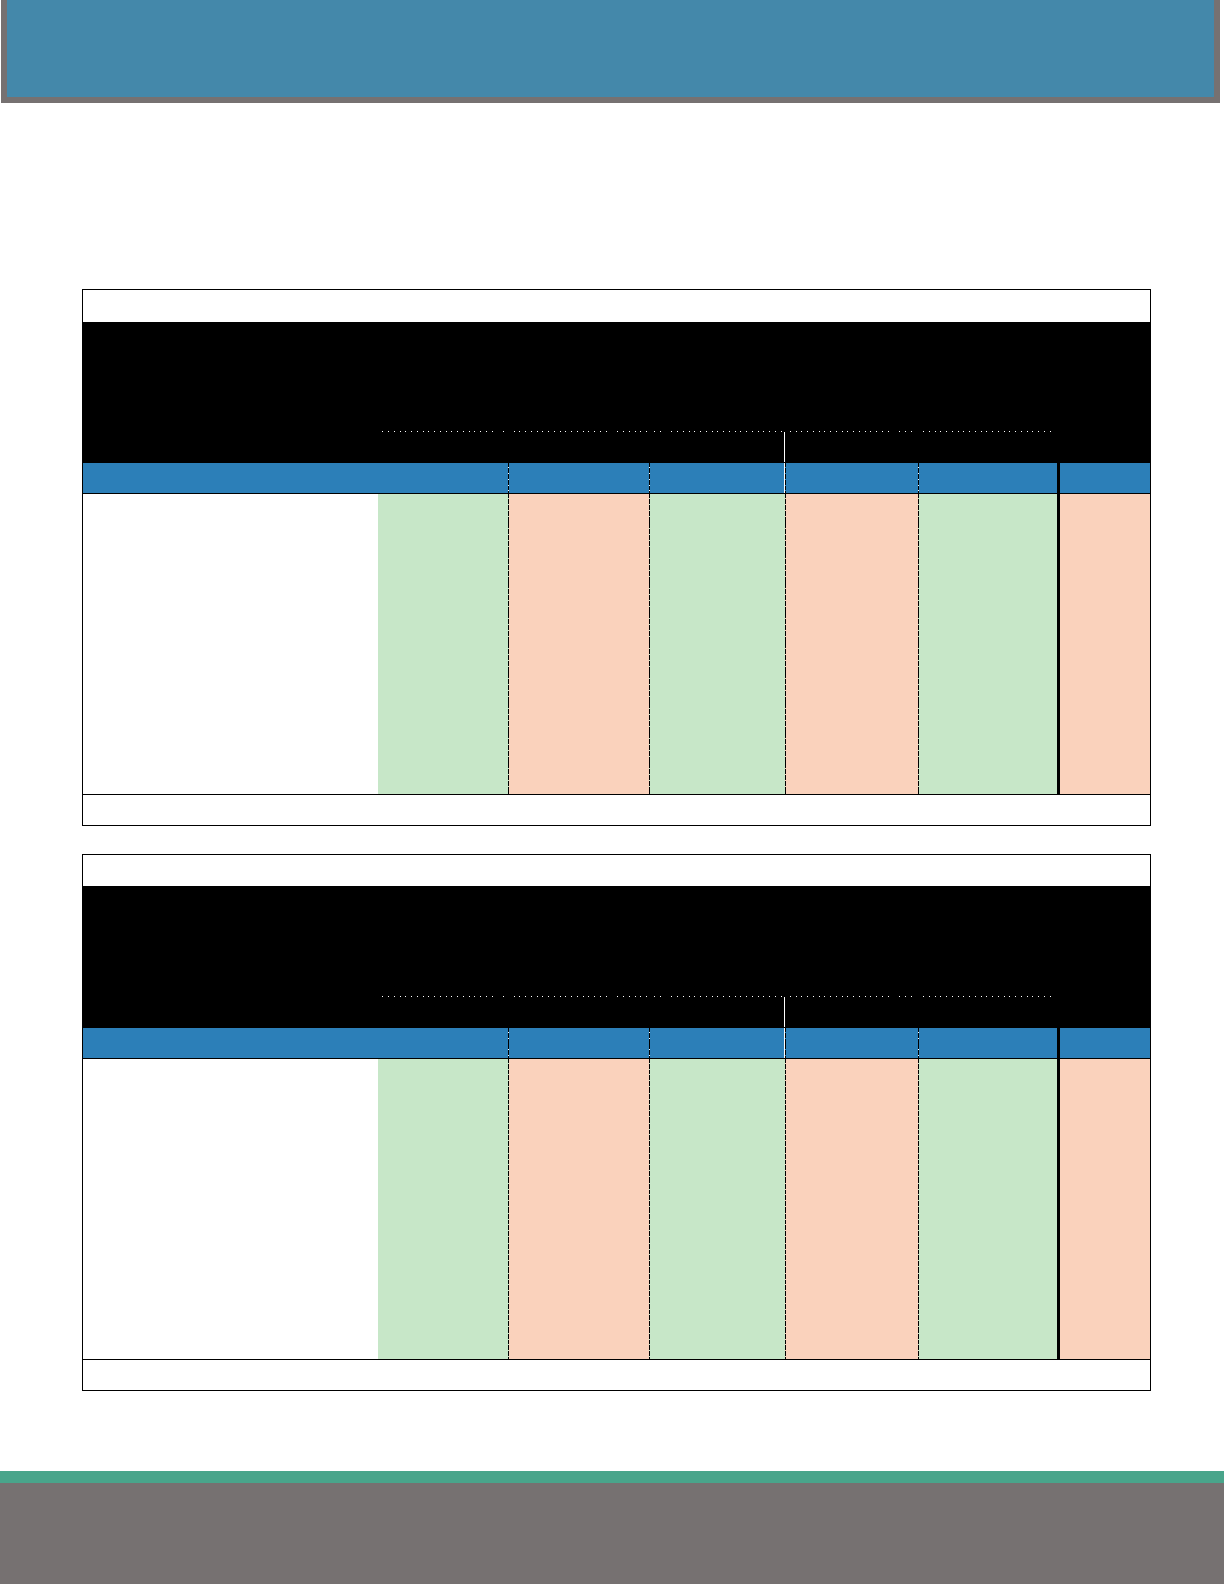
Table 7 displays the employer and employee share of the medical premium for single and family plans by
jurisdiction. This data corresponds with the data displayed in Table 5.
Table 7
Employer & Employee Cost Sharing Percentage
Towards Medical Premium
(All Medical Plan Types)
Single
Family
Comparison Group
Employer
Share
Employee
Share
Employer
Share
Employee
Share
n
STATEWIDE
87.4%
12.6%
86.5%
13.5%
1,993
State of Ohio
88.1%
11.9%
87.6%
12.4%
3
Counties 87.2% 12.8% 86.4% 13.6% 151
Less than 50,000
86.9%
13.1%
85.8%
14.2%
57
50,000 - 149,999
86.7%
13.3%
86.1%
13.9%
54
150,000 or more 88.4% 11.6% 87.8% 12.2% 40
Cities
88.7%
11.3%
88.4%
11.6%
372
Less than 25,000 88.8% 11.2% 88.4% 11.6% 267
25,000 - 99,999
88.3%
11.7%
88.5%
11.5%
96
100,000 or more
88.5%
11.5%
86.4%
13.6%
9
Townships 91.5% 8.5% 91.5% 8.5% 151
Less than 10,000
92.5%
7.5%
93.3%
6.7%
75
10,000 - 29,999 91.4% 8.6% 91.0% 9.0% 54
30,000 or more
88.6%
11.4%
87.2%
12.8%
22
School Districts & ESCs
86.7%
13.3%
85.4%
14.6%
1,146
Less than 1,000 87.5% 12.5% 86.8% 13.2% 301
1,000 - 2,499
86.4%
13.6%
85.5%
14.5%
461
2,500 - 9,999 86.6% 13.4% 85.2% 14.8% 266
10,000 or more
86.1%
13.9%
80.4%
19.6%
32
Educational Svc Centers
85.7%
14.3%
82.7%
17.3%
86
Colleges & Universities 85.1% 14.9% 84.1% 15.9% 74
Fire Districts
89.6%
10.4%
88.9%
11.1%
19
Metro Housing Authorities 88.1% 11.9% 87.2% 12.8% 50
Port Authorities
87.9%
12.1%
87.9%
12.1%
5
Regional Transit Authorities
86.9%
13.1%
86.9%
13.1%
22
Note: Rows formatted with bold font include all medical plans reported for the comparison group.
Note: Includes plans where employees contribute $0 to the medical premium.
Note: Includes plans where the medical premium includes the cost of prescription and dental.
Note: n: number of plans
12
2023 HEALTH INSURANCE REPORT
MEDICAL INSURANCE – ALL PLAN TYPES
Figure 4 displays the statewide average percentages of the employee’s contribution toward the family
medical premium, found in Table 7, over the past five years. While medical premiums continue to rise, the
employee’s share of the premium cost has changed very little. The reported 2023 percent share is 13.5%,
which mirrors prior years.
Figure 4
13.2%
13.5%
13.4%
13.7%
13.5%
0.0%
2.0%
4.0%
6.0%
8.0%
10.0%
12.0%
14.0%
16.0%
18.0%
20.0%
2019 2020 2021 2022 2023
Statewide Family Premium Employee Percent Share
13
2023 HEALTH INSURANCE REPORT
MEDICAL INSURANCE – ALL PLAN TYPES
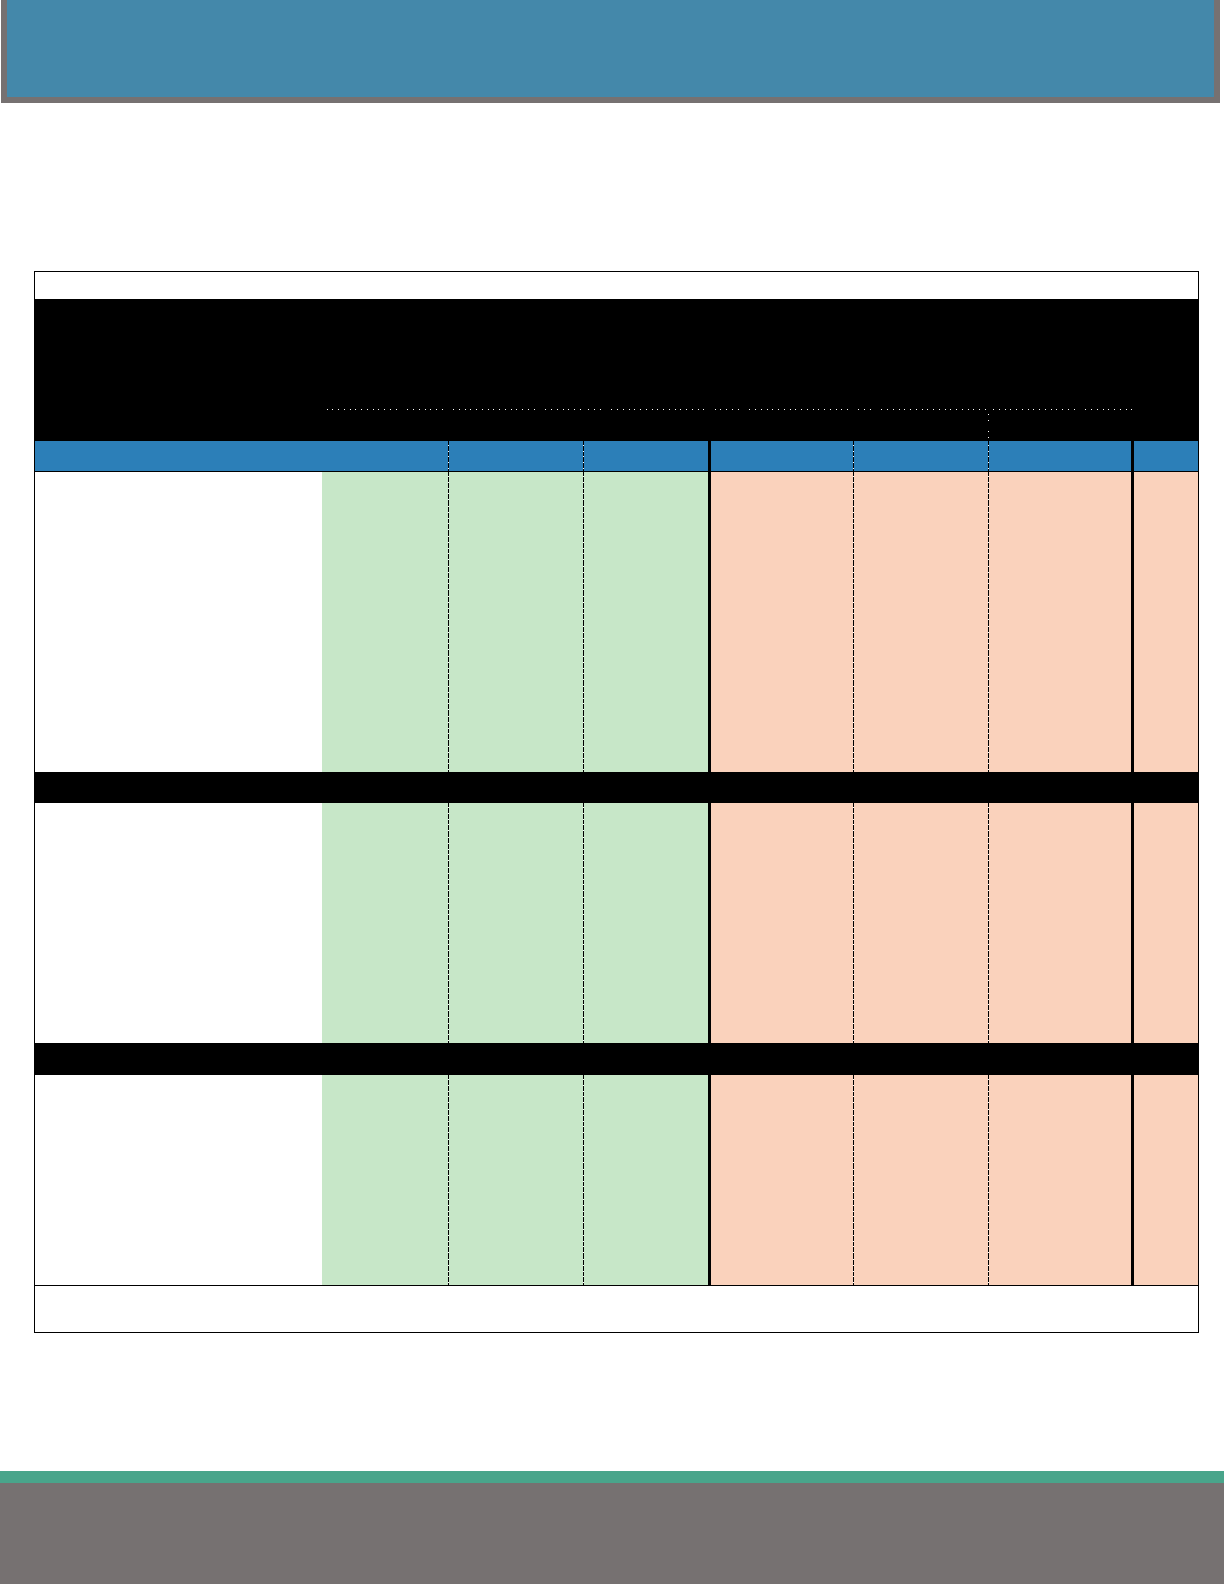
Table 8 is a continuation of Table 7 and breaks down the employer and employee percent share costs by
region and number of employees covered. This data corresponds with the data displayed in Table 6.
Table 8
Employer & Employee Cost Sharing Percentage
Towards Medical Premium by Region
(All Medical Plan Types)
Single
Family
Comparison Group
Employer
Share
Employee
Share
Employer
Share
Employee
Share
n
STATEWIDE
87.4%
12.6%
86.5%
13.5%
1,993
REGION
1 - Akron/Canton 88.0% 12.0% 88.3% 11.7% 230
2 - Cincinnati
86.5%
13.5%
85.1%
14.9%
222
3 - Cleveland 88.5% 11.5% 88.7% 11.3% 344
4 - Columbus
86.7%
13.3%
84.6%
15.4%
354
5 - Dayton
85.0%
15.0%
84.1%
15.9%
263
6 - Southeast Ohio 88.0% 12.0% 85.8% 14.2% 167
7 - Toledo
87.6%
12.4%
86.5%
13.5%
278
8 - Warren/Youngstown 90.9% 9.1% 91.1% 8.9% 135
EMPLOYEES COVERED
1 - 49 89.3% 10.7% 88.7% 11.3% 333
50 - 99
88.2%
11.8%
87.7%
12.3%
334
100 - 149
87.4%
12.6%
86.9%
13.1%
388
150 - 249
86.5%
13.5%
85.5%
14.5%
415
250 - 499 87.4% 12.6% 86.2% 13.8% 298
500 - 999
85.3%
14.7%
83.6%
16.4%
133
1,000 or more
86.0%
14.0%
83.3%
16.7%
92
Note: Includes plans where employees contribute $0 to the medical premium.
Note: Includes plans where the medical premium includes the cost of prescription and dental.
Note: n: number of plans.

14
2023 HEALTH INSURANCE REPORT
MEDICAL INSURANCE – ALL PLAN TYPES
TOTAL MONTHLY MEDICAL PREMIUMS BY PLAN TYPE
Table 9 highlights the average costs of single and family plans related to specific plan types.
Table 9
Average Total Monthly Premium by Plan Type
Single
Family
n
ALL PLANS
$ 813.80
$ 2,148.00
1,993
EPO
$ 872.56
$ 2,090.23
12
PPO
$ 869.62
$ 2,236.49
991
POS
$ 779.63
$ 2,114.75
21
HMO
$ 731.94
$ 1,987.56
30
HDHP
$ 756.90
$ 2,059.94
939
Note: Includes plans where employees contribute $0 to the medical premium.
Note: Includes plans where the medical premium includes the cost of prescription and dental.
Note: n: number of plans.
The average total monthly premium for the “All Plans” category increased $51.05 for single and
$139.79 for family compared to last year’s report.
15
2023 HEALTH INSURANCE REPORT
MEDICAL INSURANCE – ALL PLAN TYPES
FULLY-INSURED VS SELF-INSURED MEDICAL PLANS
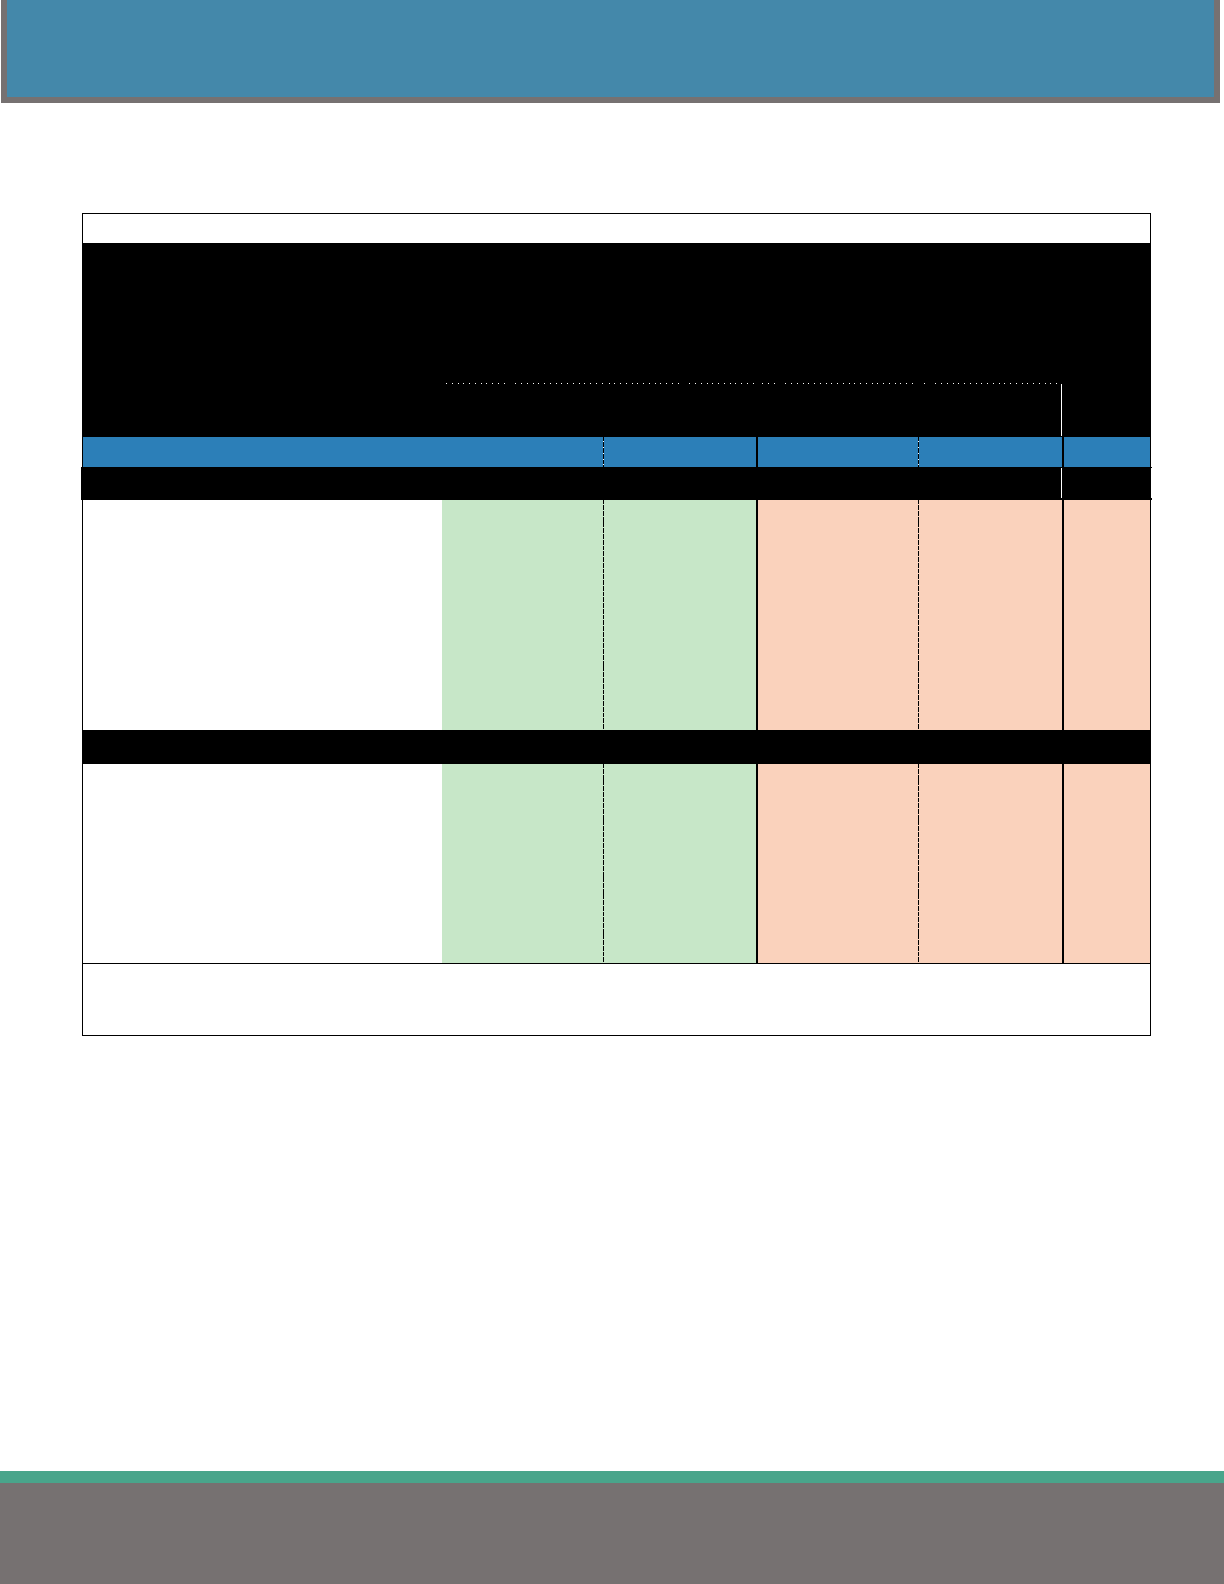
Tables 10 and 11 compare the annual cost of fully-insured medical plans to self-insured plans. The data
presented includes all plan types reported. The primary difference between the fully-insured and self-
insured health insurance plans is who assumes all the risks. With a fully-insured health insurance plan, the
risk falls on the insurance company. In a self-insured health insurance plan, most of the risk falls on the
employer.
Table 10
Statewide Average Annual Cost Per Year by Funding Type
(SINGLE)
Comparison Group
2019
2020
2021
2022
2023
n
Fully-Insured $ 8,124 $ 8,466 $ 8,922 $ 9,106 $ 9,570 447
Self-Insured $ 8,097 $ 8,496 $ 8,873 $ 9,165 $ 9,815 1,546
Note: n: number of plans.
The average annual cost for single plans rose 5.1% for fully-insured plans and 7.1% for self-
insured plans.
Table 11
Statewide Average Annual Cost Per Year by Funding Type
(FAMILY)
Comparison Group
2019
2020
2021
2022
2023
n
Fully-Insured $ 21,997 $ 23,571 $ 24,080 $ 24,940 $ 26,299 447
Self-Insured $ 20,685 $ 22,002 $ 23,009 $ 23,878 $ 25,614 1,546
Note: n: number of plans.
The average annual cost for family plans rose 5.4% for fully-insured plans and 7.3% for self-
insured plans.
16
2023 HEALTH INSURANCE REPORT
MEDICAL INSURANCE – ALL PLAN TYPES
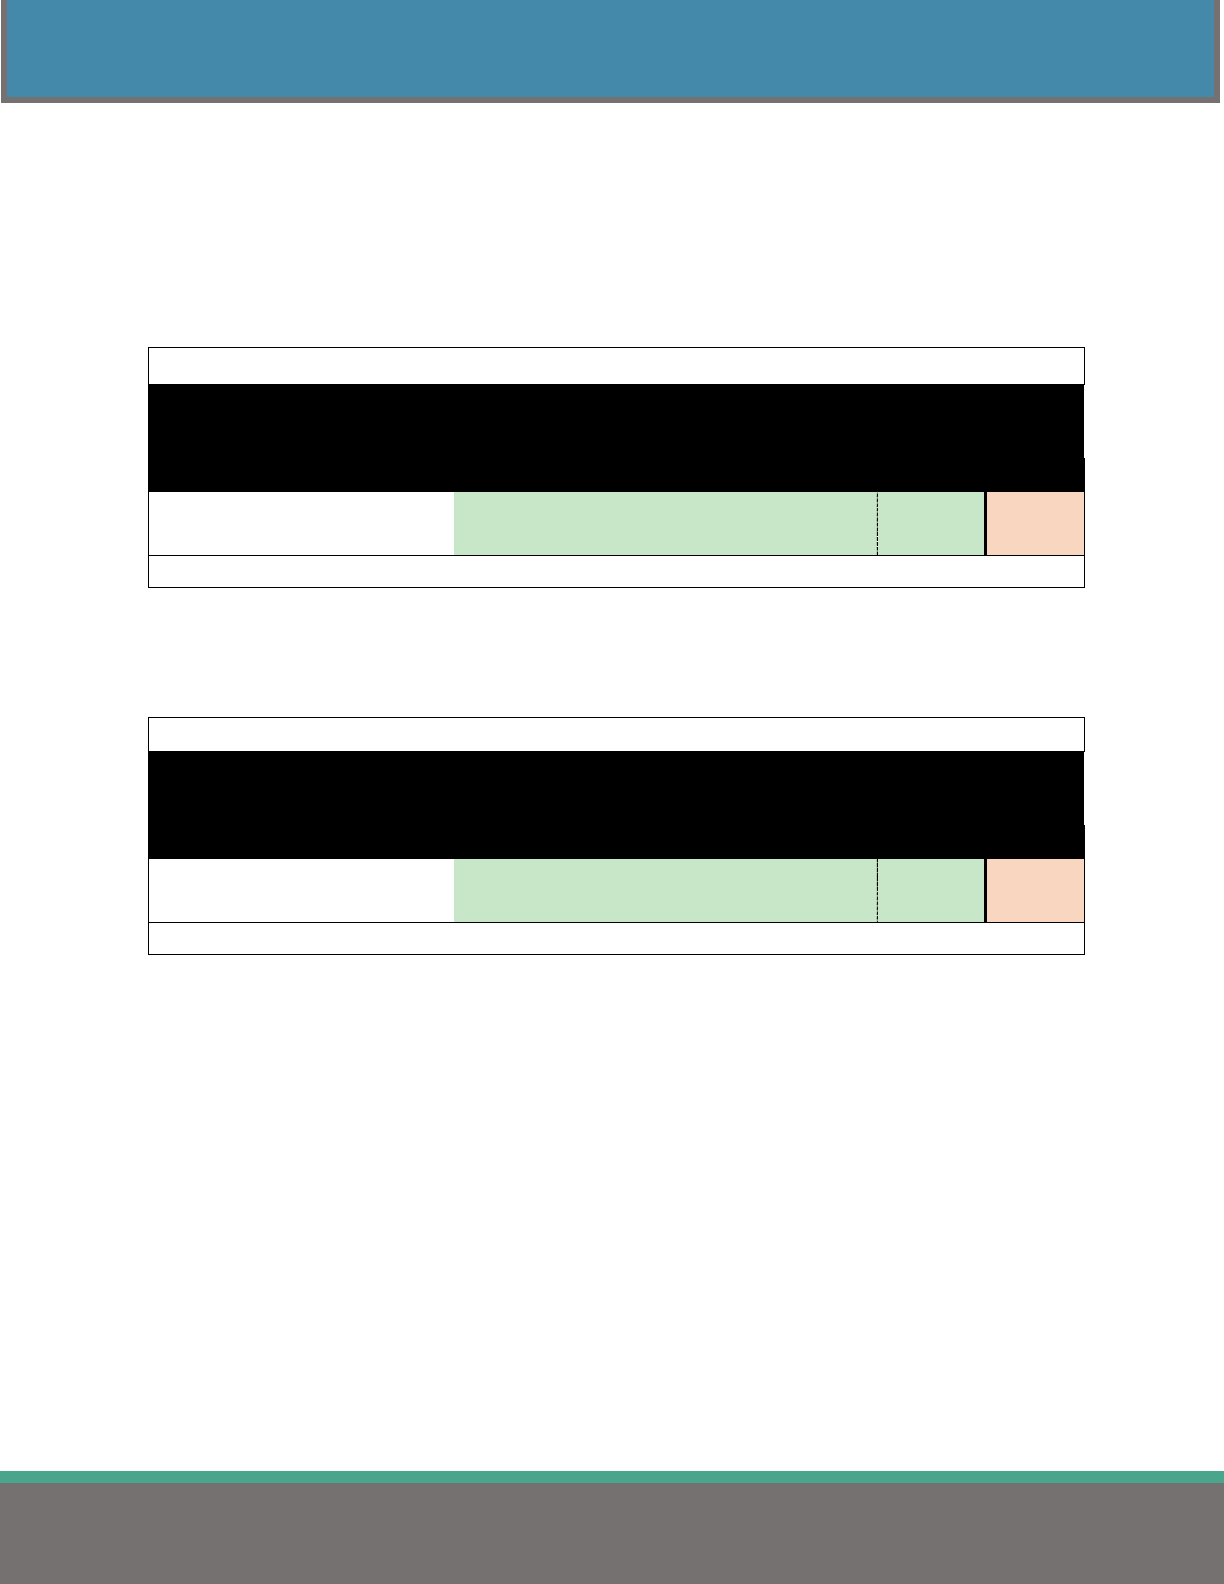
Figures 5 and 6 display the average statewide cost per employee per year for fully-insured and self-insured
medical plans found in Tables 10 and 11 (located on page 15).
Figure 5
Figure 6
$8,000.00
$8,500.00
$9,000.00
$9,500.00
$10,000.00
2019 2020 2021 2022 2023
Statewide Average Annual Cost Per Single Plan Per Year
by Funding Type
Fully-Insured Self-Insured
$20,000.00
$21,000.00
$22,000.00
$23,000.00
$24,000.00
$25,000.00
$26,000.00
$27,000.00
2019 2020 2021 2022 2023
Statewide Average Annual Cost Per Family Plan Per Year
by Funding Type
Fully-Insured Self-Insured
17
2023 HEALTH INSURANCE REPORT
MEDICAL INSURANCE – ALL PLAN TYPES
NETWORK DEDUCTIBLES
Table 12 shows the average deductibles for jurisdictions, regions, and the number of employees covered.
The rising number of High Deductible Health Plans significantly impacts the average deductible.
Table 12
Average In-Network Deductible Amount
(All Plan Types)
Comparison Group
Single
Family
n
STATEWIDE
$ 1,665
$ 3,286
1,993
State of Ohio
$ 933
$ 1,867
3
Counties $ 1,296 $ 2,600
151
Cities
$ 1,665
$ 3,326
372
Townships
$ 2,850
$ 5,713
151
School Districts & ESCs $ 1,522 $ 3,000
1,146
Colleges & Universities
$ 1,825
$ 3,392
74
Fire Districts $ 2,839 $ 5,679
19
Metro Housing Authorities
$ 2,018
$ 3,900
50
Port Authorities
$ 2,380
$ 3,660
5
Regional Transit Authorities $ 1,102 $ 2,227
22
REGION
1 - Akron/Canton $ 1,003 $ 2,052
230
2 - Cincinnati
$ 1,941
$ 3,881
222
3 - Cleveland
$ 1,466
$ 2,853
344
4 - Columbus $ 1,904 $ 3,740
354
5 - Dayton
$ 1,907
$ 3,797
263
6 - Southeast Ohio $ 1,640 $ 3,292
167
7 - Toledo
$ 1,899
$ 3,650
278
8 - Warren/Youngstown
$ 1,293
$ 2,583
135
EMPLOYEES COVERED
1 - 49
$ 2,290
$ 4,560
333
50 - 99 $ 1,719 $ 3,410
334
100 - 149
$ 1,573
$ 3,094
388
150 - 249
$ 1,543
$ 3,032
415
250 - 499 $ 1,416 $ 2,774
298
500 - 999
$ 1,552
$ 3,069
133
1,000 or more
$ 1,095
$ 2,173
92
Note: Average deductible amounts include plans where employees contribute $0 to the annual deductible.
Note: n: number of plans.
18
2023 HEALTH INSURANCE REPORT
MEDICAL INSURANCE – ALL PLAN TYPES
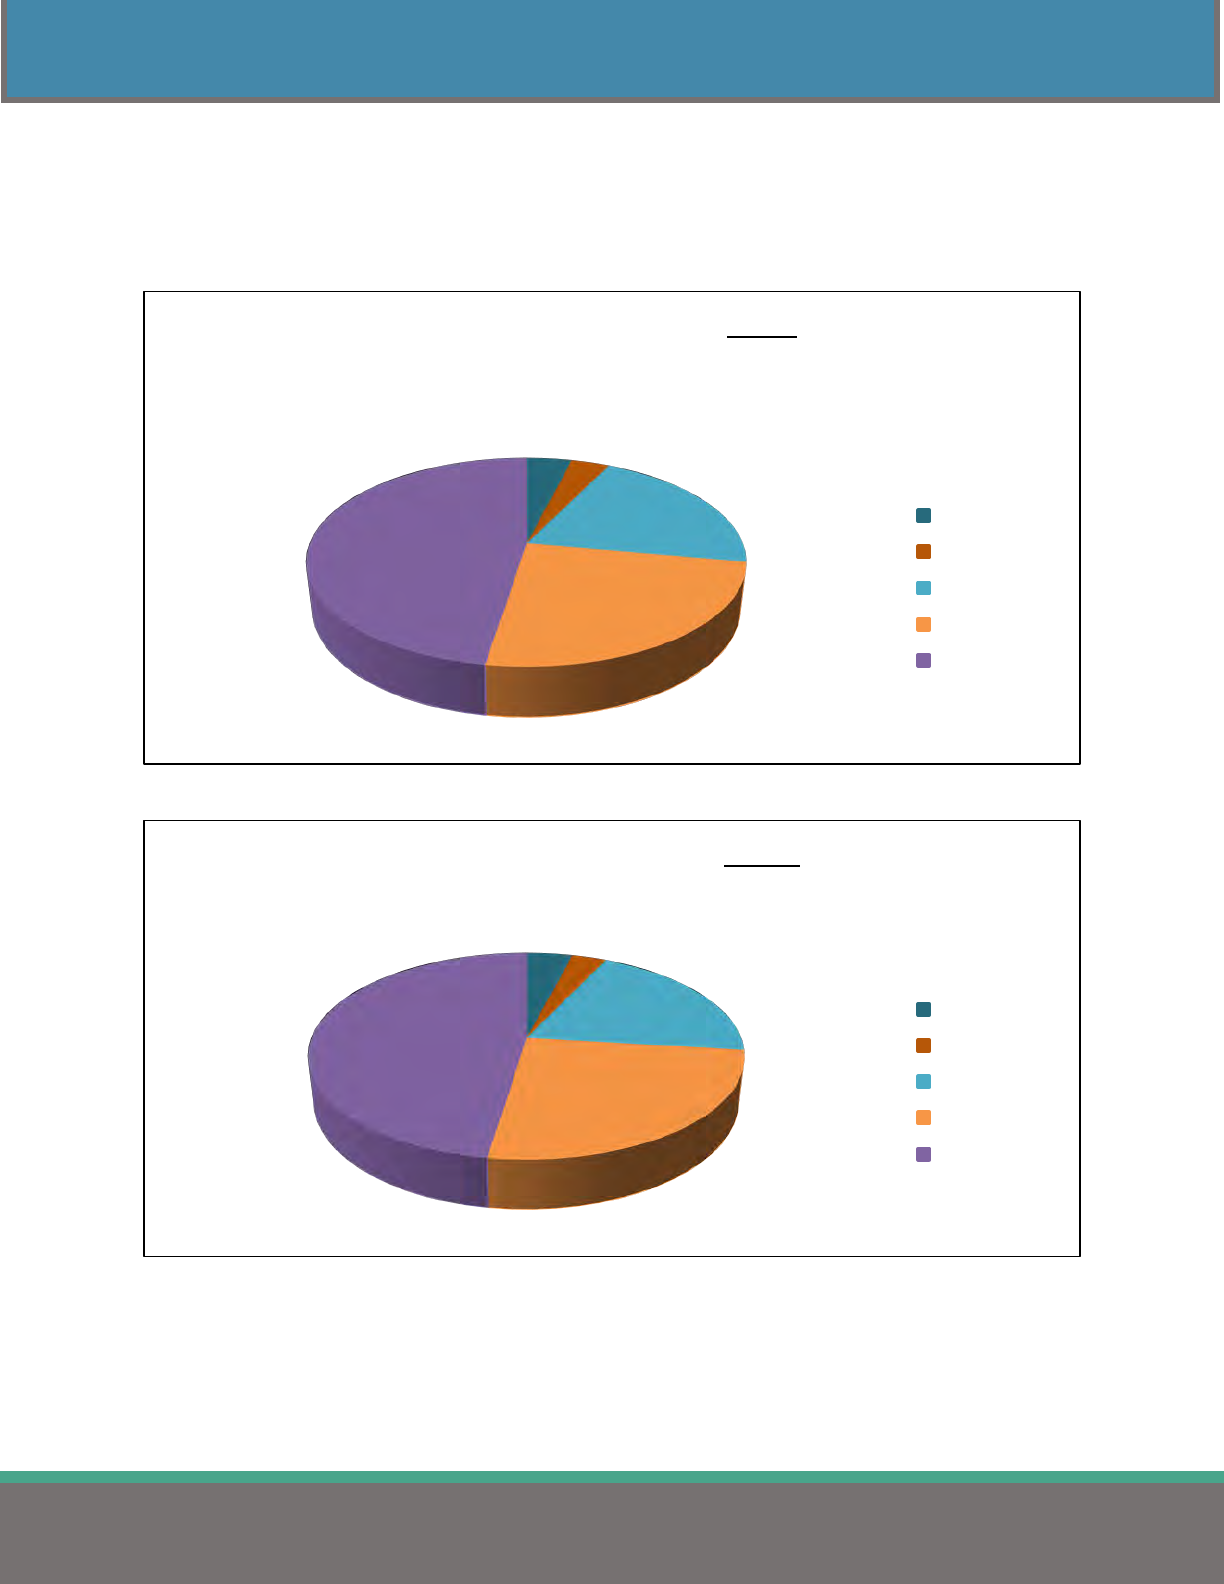
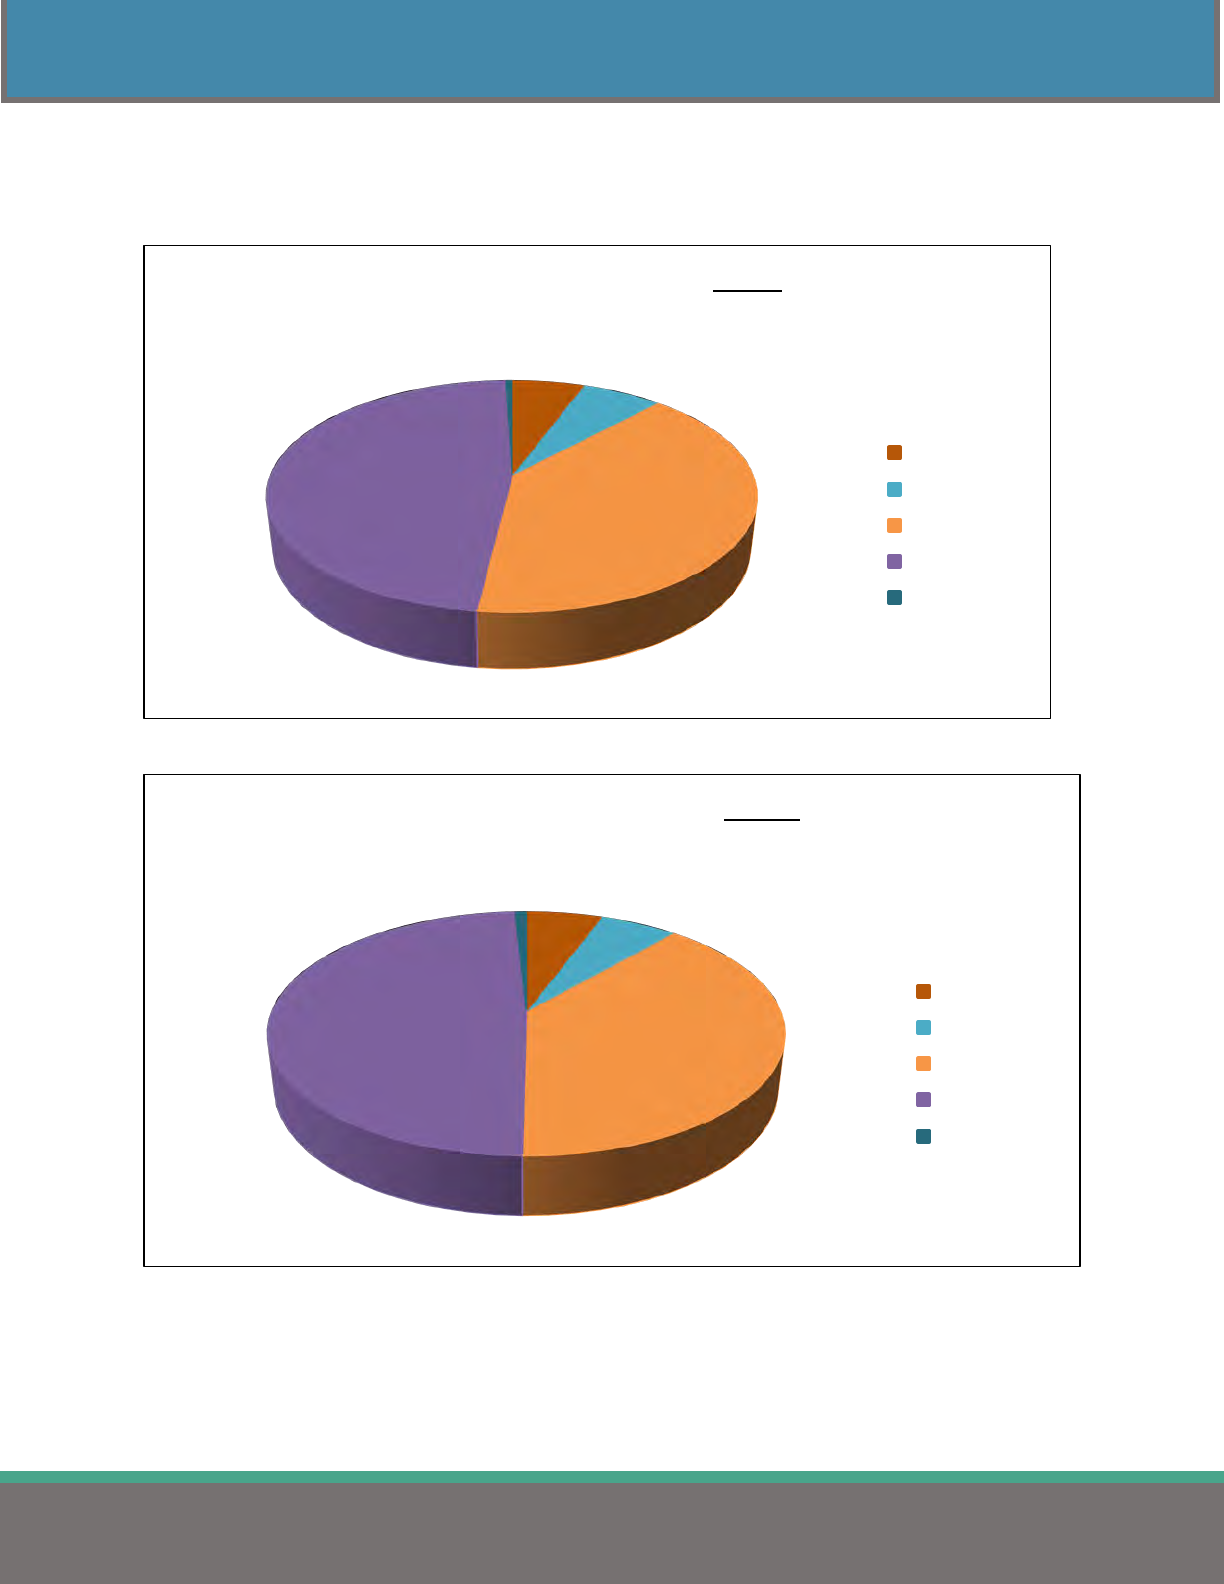
Figures 7 and 8 show the percent of plans in each deductible category for single and family coverage
displayed in Table 12. Each chart's highest category represents those plans eligible for a Health Savings
Account (HSA). Deductibles must be at least $1,400 for single and $2,800 for family coverage to qualify
for an HSA.
Figure 7
Figure 8
4.0%
3.2%
20.6%
24.7%
47.5%
Deductible Categories for Single
In-Network Medical Coverage
$0
$1-$124
$125-$499
$500-$1,399
$1,400 or more
4.0%
3.0%
20.0%
25.4%
47.6%
Deductible Categories for Family
In-Network Medical Coverage
$0
$1-$249
$250-$899
$900-$2,799
$2,800 or more

19
2023 HEALTH INSURANCE REPORT
MEDICAL INSURANCE – ALL PLAN TYPES
NON-NETWORK DEDUCTIBLES
Table 13 shows the average non-network deductibles for jurisdictions, regions, and the number of
employees covered.
Table 13
Average Non-Network Deductible Amount
(All Plan Types)
Comparison Group
Single
Family
n
STATEWIDE $ 3,335
$ 6,601
1,993
State of Ohio $ 1,867
$ 3,733
3
Counties
$ 2,701
$ 5,421
151
Cities
$ 3,558
$ 7,099
372
Townships $ 6,452
$ 12,993
151
School Districts & ESCs
$ 2,773
$ 5,484
1,146
Colleges & Universities $ 3,978
$ 7,480
74
Fire Districts $ 9,663
$ 18,327
19
Metro Housing Authorities $ 5,608
$ 11,104
50
Port Authorities $ 3,750
$ 7,500
5
Regional Transit Authorities $ 2,608
$ 5,244
22
REGION
1 - Akron/Canton
$ 2,213 $ 4,501 230
2 - Cincinnati
$ 3,989 $ 7,978 222
3 - Cleveland
$ 2,819 $ 5,509 344
4 - Columbus
$ 3,728 $ 7,329 354
5 - Dayton
$ 4,065 $ 8,050 263
6 - Southeast Ohio
$ 3,464 $ 6,893 167
7 - Toledo
$ 3,328 $ 6,497 278
8 - Warren/Youngstown
$ 2,869 $ 5,781 135
EMPLOYEES COVERED
1 - 49
$ 5,116 $ 10,163 333
50 - 99
$ 3,562 $ 7,072 334
100 - 149
$ 2,985 $ 5,860 388
150 - 249
$ 2,863 $ 5,663 415
250 - 499
$ 2,671 $ 5,249 298
500 - 999
$ 3,013 $ 6,043 133
1,000 or more
$ 2,401
$ 4,877
92
Note: Average deductible amounts include plans where employees contribute $0 to the annual deductible.
Note: n: number of plans.
20
2023 HEALTH INSURANCE REPORT
MEDICAL INSURANCE – ALL PLAN TYPES
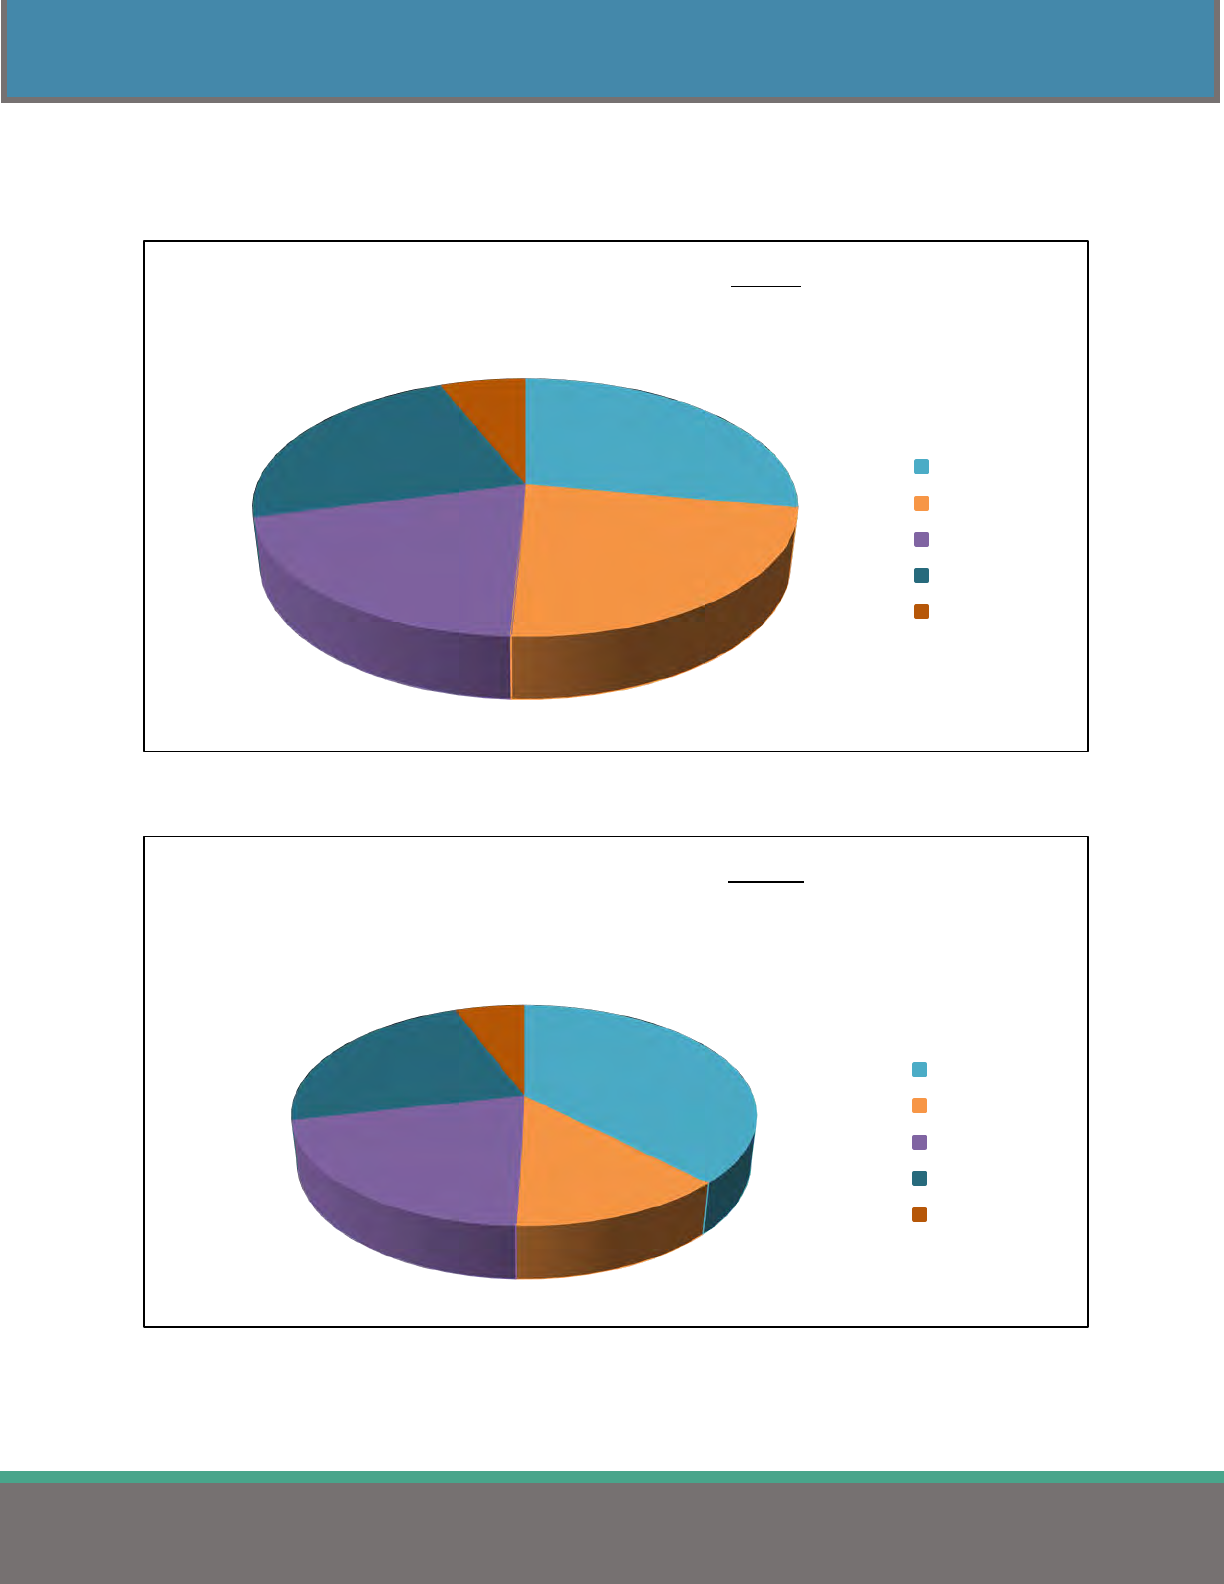
Figures 9 and 10 show the percent of plans in each non-network deductible category for single and family
coverage displayed in Table 13.
Figure 9
Figure 10
27.9%
22.8%
20.2%
23.1%
6.0%
Deductible Categories for Single
Non-Network Medical Coverage
$0-$999
$1,000-$2,499
$2,500-$4,999
$5,000-$9,999
$10,000 or more
37.7%
12.8%
20.9%
22.9%
5.7%
Deductible Categories for Family
Non-Network Medical Coverage
$0-$2,499
$2,500-$4,999
$5,000-$9,999
$10,000-$19,999
$20,000 or more
21
2023 HEALTH INSURANCE REPORT
MEDICAL INSURANCE – ALL PLAN TYPES
COPAY AND COINSURANCE
Table 14 shows the breakdown of the 1,993 medical plans submitted by the average copay and coinsurance
amounts for network and non-network plans covered by the employee.
Table 14
Statewide Average Medical Copay & Coinsurance Amounts
(Covered by Employee)
Network
n
Non-Network
n
COPAY
Office Visit
$ 17.70
1,362
$ 23.08
297
Emergency Room
$ 137.94
1,365
$ 147.81
1,025
Urgent Care
$ 37.02
1,317
$ 34.86
381
Hospital Stay - Admitted
$ 36.22
424
$ 45.37
162
COINSURANCE
Office Visit
13.0%
692
34.6%
1,602
Emergency Room
13.1%
792
24.4%
946
Urgent Care
13.0%
724
33.9%
1,493
Hospital Stay - Admitted
14.4%
1,445
34.3%
1,626
Note: n: number of plans.
Office Visit Copay
When a copay is required, 320 plans (16.1%) indicated that their office visit copay amount is $20.
When a copay is required, 265 plans (13.3%) indicated that their office visit copay amount is $25.
Emergency Room Copay
When a copay is required, 211 plans (10.6%) indicated that their emergency room copay amount
is $250.
When a copay is required, 823 plans (41.2%) indicated that their emergency room copay is
between $100 and $300.
Urgent Care Copay
When a copay is required, 223 plans (11.1%) indicated that their urgent care copay amount is $50.
When a copay is required, 153 plans (7.7%) indicated that their urgent care copay amount is $75.
22
2023 HEALTH INSURANCE REPORT
MEDICAL INSURANCE – ALL PLAN TYPES
The two tables below show the employee’s average co-insurance percentage of the medical claim for
network and non-network claims when admitted into the hospital. The employee would typically be
responsible for this percentage of the medical claim (medical bill) once the employee reached the
deductible. The employee would pay this percentage on all claims until they reached the out-of-pocket
maximum.
Table 15
Co-Insurance Categories for In-Network Medical Coverage by Jurisdiction
(All Plan Types)
Employee’s Co-Insurance Percentage
Comparison Group
0%
1-10%
11-19%
20%
>20%
n
STATEWIDE 15.8% 29.7% 3.2% 45.3% 6.0% 1,993
State of Ohio
0.0%
0.0%
0.0%
100.0%
0.0%
3
Counties
5.8%
18.2%
2.5%
56.2%
17.3%
151
Cities
25.4%
27.0%
0.8%
44.8%
2.0%
372
Townships
35.6%
12.3%
0.0%
45.2%
6.9%
151
School Districts & ESCs
12.6%
35.0%
4.2%
42.6%
5.6%
1,146
Colleges & Universities
9.8%
23.0%
4.9%
57.4%
4.9%
74
Fire Districts
87.5%
0.0%
0.0%
12.5%
0.0%
19
Metro Housing Authorities
21.2%
15.2%
0.0%
54.5%
9.1%
50
Port Authorities
0.0%
66.7%
0.0%
33.3%
0.0%
5
Regional Transit Authorities
11.1%
16.7%
5.6%
66.6%
0.0%
22
Note: n: number of plans.
Table 16
Co-Insurance Categories for Non-Network Medical Coverage by Jurisdiction
(All Plan Types)
Employee’s Co-Insurance Percentage
Comparison Group
0-19%
20%
21-30%
31-40%
>40%
n
STATEWIDE
3.0%
15.5%
29.8%
35.7%
16.0%
1,993
State of Ohio 33.3% 0.0% 0.0% 66.7% 0.0% 3
Counties 3.9% 8.5% 15.5% 53.5% 18.6% 151
Cities 2.8% 18.0% 33.9% 28.7% 16.6% 372
Townships 0.0% 16.0% 20.0% 27.0% 37.0% 151
School Districts & ESCs 3.3% 16.5% 32.2% 36.2% 11.8% 1,146
Colleges & Universities 1.7% 5.0% 33.3% 41.7% 18.3% 74
Fire Districts 10.0% 10.0% 20.0% 0.0% 60.0% 19
Metro Housing Authorities 0.0% 10.8% 16.2% 35.1% 37.9% 50
Port Authorities 0.0% 33.3% 33.3% 33.4% 0.0% 5
Regional Transit Authorities 0.0% 15.8% 15.8% 47.4% 21.0% 22
Note: n: number of plans.
23
2023 HEALTH INSURANCE REPORT
MEDICAL INSURANCE – ALL PLAN TYPES
OUT-OF-POCKET MAXIMUMS
Tables 17 and 18 display the average, minimum, and maximum out-of-pocket maximums for single and
family medical coverage for all plan types reported.
Table 17
Average In-Network Out-of-Pocket Maximums
(All Plan Types)
Single
Family
Comparison Group
Average
Minimum
Maximum
Average
Minimum
Maximum
n
STATEWIDE $ 3,390 $ 0
$ 12,000 $ 6,789 $ 0
$ 27,400 1,993
State of Ohio $ 2,833 $ 2,500 $ 3,500 $ 5,667 $ 5,000
$ 7,000 3
Counties $ 3,322 $ 400 $ 12,000 $ 6,690 $ 800
$ 24,000 151
Cities $ 3,101 $ 0
$ 8,700 $ 6,187 $ 0
$ 17,400 372
Townships $ 4,056 $ 0
$ 8,700 $ 8,276
$ 0
$ 27,400 151
School Districts & ESCs $ 3,322 $ 0
$ 9,100 $ 6,631
$ 0
$ 23,200 1,146
Colleges & Universities $ 3,953 $ 900 $ 8,150 $ 7,894 $ 1,800
$ 14,700 74
Fire Districts $ 5,132 $ 3,000 $ 8,000 $ 10,263 $ 6,000
$ 16,000 19
Metro Housing Authorities $ 4,043 $ 350 $ 8,500 $ 8,426 $ 700
$ 18,000 50
Port Authorities $ 4,510 $ 2,500 $ 6,350 $ 9,020 $ 5,000
$ 12,700 5
Regional Transit Authorities $ 2,630 $ 0
$ 7,500 $ 5,168
$ 0
$ 15,000 22
REGION
1 - Akron/Canton $ 2,305 $ 0
$ 8,700 $ 4,692
$ 0
$ 20,000 230
2 - Cincinnati $ 3,625 $ 170 $ 12,000 $ 7,270 $ 500
$ 24,000 222
3 - Cleveland $ 3,742 $ 0
$ 8,700 $ 7,546
$ 0
$ 23,200 344
4 - Columbus $ 3,576 $ 0
$ 9,100 $ 7,184
$ 0
$ 27,400 354
5 - Dayton $ 3,104 $ 0
$ 8,700 $ 6,131 $
0
$ 17,400 263
6 - Southeast Ohio $ 3,620 $ 200 $ 9,100 $ 7,254 $ 400
$ 18,200 167
7 - Toledo $ 3,600 $ 250 $ 9,100 $ 7,059 $ 500
$ 18,200 278
8 - Warren/Youngstown $ 3,301 $ 350 $ 8,700 $ 6,768 $ 400
$ 17,400 135
EMPLOYEES COVERED
1 - 49 $ 3,892 $ 0
$ 8,700 $ 7,898
$ 0
$ 27,400 333
50 - 99 $ 3,310 $ 0
$ 9,100 $ 6,600
$ 0
$ 18,200 334
100 - 149 $ 3,313 $ 50 $ 9,100 $ 6,628 $ 100
$ 18,200 388
150 - 249 $ 3,250 $ 0
$ 9,100 $ 6,477
$ 0
$ 23,200 415
250 - 499 $ 3,383 $ 0
$ 12,000 $ 6,781
$ 0
$ 24,000 298
500 - 999 $ 3,392 $ 0
$ 9,100 $ 6,732
$ 0
$ 18,200 133
1,000 or more $ 2,827 $ 0
$ 6,850 $ 5,672
$ 0
$ 13,700 92
Note: Excludes plans that have unlimited out-of-network maximums.
Note: n: number of plans.
24
2023 HEALTH INSURANCE REPORT
MEDICAL INSURANCE – ALL PLAN TYPES
Table 18
Average Non-Network Out-of-Pocket Maximums
(All Plan Types)
Single
Family
Comparison Group
Average
Minimum
Maximum
Average
Minimum
Maximum
n
STATEWIDE $ 6,829
$ 150
$ 40,000 $ 13,729 $ 300
$ 80,000
1,993
State of Ohio $ 5,667
$ 5,000
$ 7,000 $ 11,333 $ 10,000
$ 14,000
3
Counties $ 6,893
$ 800
$ 24,000 $ 14,089 $ 1,800
$ 50,000
151
Cities $ 7,244
$ 150
$ 22,050 $ 14,426 $ 300
$ 45,000
372
Townships $ 11,004
$ 1,500
$ 24,000 $ 22,833 $ 3,000
$ 60,000
151
School Districts & ESCs $ 5,781
$ 340
$ 40,000 $ 11,545 $ 500
$ 80,000
1,146
Colleges & Universities $ 7,892
$ 1,800
$ 32,600 $ 15,211 $ 3,600
$ 40,000
74
Fire Districts $ 15,898
$ 10,000
$ 24,000 $ 31,797 $ 20,000
$ 48,000
19
Metro Housing Authorities $ 10,749
$ 1,000
$ 22,500 $ 23,083 $ 3,000
$ 60,000
50
Port Authorities $ 8,463
$ 5,000
$ 12,500 $ 16,925 $ 10,000
$ 25,000
5
Regional Transit Authorities $ 5,931
$ 1,300
$ 22,500 $ 11,644 $ 2,500
$ 45,000
22
REGION
1 - Akron/Canton $ 4,854
$ 150
$ 22,050 $ 9,728 $ 300
$ 44,100
230
2 - Cincinnati $ 8,345
$ 340
$ 24,000 $ 16,969 $ 1,000
$ 48,000
222
3 - Cleveland $ 6,522
$ 400
$ 22,050 $ 13,158 $ 500
$ 60,000
344
4 - Columbus $ 7,498
$ 500
$ 40,000 $ 15,007 $ 800
$ 80,000
354
5 - Dayton $ 6,914
$ 1,000
$ 21,000 $ 13,652 $ 2,000
$ 42,000
263
6 - Southeast Ohio $ 7,287
$ 600
$ 21,000 $ 14,847 $ 1,200
$ 42,000
167
7 - Toledo $ 6,397
$ 500
$ 32,600 $ 12,635 $ 1,000
$ 50,000
278
8 - Warren/Youngstown $ 6,472
$ 900
$ 22,500 $ 13,525 $ 900
$ 60,000
135
EMPLOYEES COVERED
1 - 49 $ 9,841
$ 1,300
$ 24,000 $ 20,276 $ 2,600
$ 60,000
333
50 - 99 $ 7,387
$ 800
$ 22,050 $ 14,637 $ 1,200
$ 44,100
334
100 - 149 $ 6,081
$ 150
$ 32,600 $ 12,041 $ 300
$ 44,100
388
150 - 249 $ 5,891
$ 500
$ 40,000 $ 11,752 $ 1,000
$ 80,000
415
250 - 499 $ 5,718
$ 340
$ 24,000 $ 11,557 $ 700
$ 48,000
298
500 - 999 $ 6,044
$ 500
$ 15,000 $ 12,034 $ 500
$ 30,000
133
1,000 or more $ 5,433
$ 500
$ 12,000 $ 11,058 $ 1,000
$ 24,000
92
Note: Excludes plans that have unlimited out-of-network maximums.
Note: n: number of plans.
25
2023 HEALTH INSURANCE REPORT
MEDICAL INSURANCE – PPO PLANS
MEDICAL INSURANCE – PPO PLANS
PPO PREMIUMS
Table 19 breaks down the average PPO medical premiums and the contribution amounts shared by the
employer and the employee. These averages include the costs of prescription, dental, and vision
coverages when included in the medical premiums. PPO plans account for 49.7% of all medical plans
reported in 2023.
Table 19
Average Monthly Employer & Employee Contributions
Towards Medical Premium
(PPO Plans)
Single
Family
Comparison Group
Employer
Share
Employee
Share
Total
Employer
Share
Employee
Share
Total
n
STATEWIDE
$ 751.01
$ 118.74
$ 869.75
$ 1,908.29
$ 328.58
$ 2,236.87
991
State of Ohio $ 656.00 $ 96.50 $ 752.50 $ 1,800.00 $ 283.50 $ 2,083.50
2
Counties $ 744.23 $ 114.91 $ 859.14 $ 1,973.43 $ 328.44 $ 2,301.87
80
Less than 50,000 $ 722.20 $ 106.82 $ 829.02 $ 2,032.19 $ 309.21 $ 2,341.40
26
50,000 - 149,999 $ 693.85 $ 119.70 $ 813.55 $ 1,953.70 $ 351.73 $ 2,305.43
34
150,000 or more $ 793.51 $ 117.30 $ 910.81 $ 1,933.53 $ 312.87 $ 2,246.40
20
Cities $ 776.00 $ 105.98 $ 881.98 $ 2,068.51 $ 283.76 $ 2,352.27
171
Less than 25,000 $ 789.57 $ 105.36 $ 894.93 $ 2,100.32 $ 288.77 $ 2,389.09
111
25,000 - 99,999 $ 757.18 $ 107.47 $ 864.65 $ 2,059.24 $ 277.73 $ 2,336.97
54
100,000 or more $ 698.70 $ 103.68 $ 802.38 $ 1,579.34 $ 247.78 $ 1,827.12
6
Townships $ 988.49 $ 90.38 $ 1,078.87 $ 2,151.69 $ 243.28 $ 2,394.97
39
Less than 10,000 $ 1,004.33 $ 51.45 $ 1,055.78 $ 2,153.71 $ 148.17 $ 2,301.88
17
10,000 - 29,999 $ 1,064.21 $ 123.72 $ 1,187.93 $ 2,195.05 $ 309.95 $ 2,505.00
17
30,000 or more $ 720.18 $ 91.60 $ 811.78 $ 2,015.94 $ 309.60 $ 2,325.54
5
School Districts & ESCs $ 738.94 $ 124.34 $ 863.28 $ 1,840.92 $ 341.87 $ 2,182.79
630
Less than 1,000 $ 741.43 $ 119.15 $ 860.58 $ 1,865.03 $ 321.22 $ 2,186.25
163
1,000 - 2,499 $ 746.65 $ 127.60 $ 874.25 $ 1,848.10 $ 343.63 $ 2,191.73
257
2,500 - 9,999 $ 718.01 $ 119.57 $ 837.58 $ 1,799.66 $ 320.58 $ 2,120.24
153
10,000 or more $ 772.12 $ 131.34 $ 903.46 $ 1,899.26 $ 495.61 $ 2,394.87
14
Educational Svc Centers $ 746.93 $ 139.63 $ 886.56 $ 1,833.11 $ 439.36 $ 2,272.47
43
Colleges & Universities $ 687.04 $ 130.73 $ 817.77 $ 1,919.03 $ 391.30 $ 2,310.33
32
Fire Districts $ 597.95 $ 56.34 $ 654.29 $ 1,702.02 $ 174.84 $ 1,876.86
3
Metro Housing Authorities $ 700.53 $ 122.18 $ 822.71 $ 2,103.36 $ 411.13 $ 2,514.49
21
Port Authorities $ 456.54 $ 73.51 $ 530.05 $ 1,493.75 $ 240.18 $ 1,733.93
1
Regional Transit Authorities $ 751.20 $ 94.97 $ 846.17 $ 1,839.04 $ 260.21 $ 2,099.25
12
Note: Rows formatted with bold font include all PPO plans reported for the comparison group.
Note: Includes plans where employees contribute $0 to the medical premium.
Note: Includes plans where the medical premium includes the cost of prescription and dental.
Note: n: number of plans
26
2023 HEALTH INSURANCE REPORT
MEDICAL INSURANCE – PPO PLANS
Table 20 organizes the same data in Table 19 by region and by the number of employees covered. These
averages include the costs of prescription, dental, and vision coverages when included with the medical
premiums. A breakdown of the regions is on page 61.
Table 20
Average Monthly Employer & Employee Contributions
Towards Medical Premium by Region
(PPO Plans)
Single
Family
Comparison Group
Employer
Share
Employee
Share
Total
Employer
Share
Employee
Share
Total
n
STATEWIDE $ 751.01 $ 118.74
$ 869.75
$ 1,908.29 $ 328.58 $ 2,236.87 991
REGION
1 - Akron/Canton $ 721.20 $ 106.67
$ 827.87
$ 1,873.98 $ 274.68 $ 2,148.66 171
2 - Cincinnati $ 681.39 $ 125.40
$ 806.79
$ 1,699.49 $ 353.90 $ 2,053.39 85
3 - Cleveland $ 705.99 $ 102.73
$ 808.72
$ 1,813.00 $ 258.36 $ 2,071.36 218
4 - Columbus $ 835.77 $ 142.93
$ 978.70
$ 2,036.95 $ 409.59 $ 2,446.54 156
5 - Dayton $ 756.48 $ 163.09
$ 919.57
$ 1,991.08 $ 479.52 $ 2,470.60 87
6 - Southeast Ohio $ 892.19 $ 121.82
$ 1,014.01
$ 2,143.70 $ 373.69 $ 2,517.39 89
7 - Toledo $ 712.60 $ 123.67
$ 836.27
$ 1,840.30 $ 353.89 $ 2,194.19 102
8 - Warren/Youngstown $ 735.25 $ 79.47
$ 814.72
$ 1,942.48 $ 210.59 $ 2,153.07 83
EMPLOYEES COVERED
1 - 49 $ 821.78 $ 107.16
$ 928.94 $ 2,064.95 $ 312.50 $ 2,377.45 123
50 - 99 $ 756.24 $ 111.83
$ 868.07 $ 1,947.02 $ 307.52 $ 2,254.54 152
100 - 149 $ 748.26 $ 118.79
$ 867.05 $ 1,894.93 $ 317.50 $ 2,212.43 206
150 - 249 $ 747.09 $ 129.43
$ 876.52 $ 1,878.63 $ 356.80 $ 2,235.43 223
250 - 499 $ 736.60 $ 113.74
$ 850.34 $ 1,886.56 $ 315.36 $ 2,201.92 169
500 - 999 $ 711.07 $ 131.31
$ 842.38 $ 1,804.20 $ 345.43 $ 2,149.63 72
1,000 or more $ 703.62 $ 117.40
$ 821.02 $ 1,836.70 $ 371.62 $ 2,208.32 46
Note: Includes plans where employees contribute $0 to the medical premium.
Note: Includes plans where the medical premium includes the cost of prescription and dental.
Note: n: number of plans.
27
2023 HEALTH INSURANCE REPORT
MEDICAL INSURANCE – PPO PLANS
EMPLOYER & EMPLOYEE SHARE OF MEDICAL PREMIUM
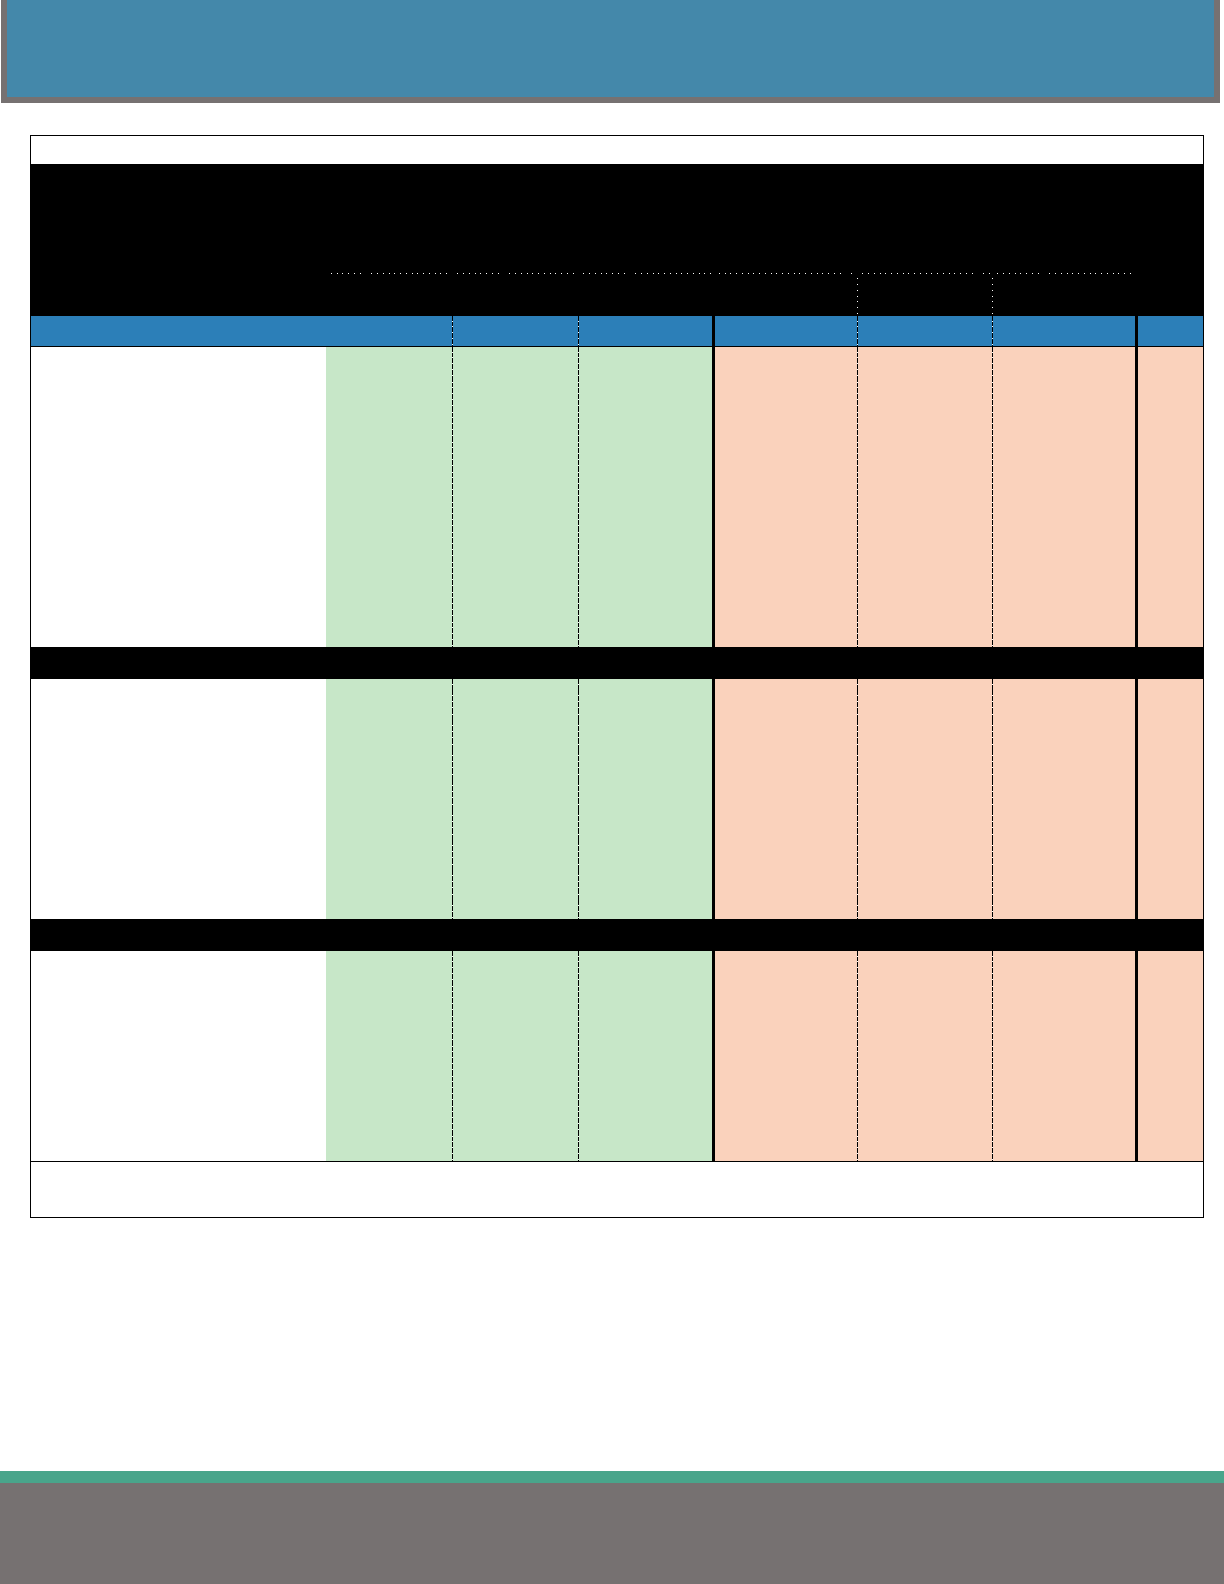
Table 21 displays the employer and employee share of the medical premium for single and family plans
by jurisdiction. This data corresponds with the data displayed in Table 19 (located on page 25).
Table 21
Employer & Employee Cost Sharing Percentage
Towards Medical Premium
(PPO Plans)
Single
Family
Comparison Group
Employer
Share
Employee
Share
Employer
Share
Employee
Share
n
STATEWIDE
86.3%
13.7%
85.5%
14.5%
991
State of Ohio
87.2%
12.8%
86.5%
13.5%
2
Counties
86.5%
13.5%
86.0%
14.0%
80
Less than 50,000 87.8% 12.2% 87.2% 12.8%
26
50,000 - 149,999 85.4% 14.6% 84.8% 15.2%
34
150,000 or more 86.9% 13.1% 86.6% 13.4%
20
Cities
87.7%
12.3%
87.5%
12.5%
171
Less than 25,000 87.8% 12.2% 87.3% 12.7%
111
25,000 - 99,999 87.7% 12.3% 88.3% 11.7%
54
100,000 or more 86.7% 13.3% 85.0% 15.0%
6
Townships
91.0%
9.0%
90.4%
9.6%
39
Less than 10,000 94.0% 6.0% 93.7% 6.3%
17
10,000 - 29,999 88.8% 11.2% 88.5% 11.5%
17
30,000 or more 89.4% 10.6% 87.1% 12.9%
5
School Districts & ESCs
85.8%
14.2%
84.7%
15.3%
630
Less than 1,000 86.5% 13.5% 85.7% 14.3%
163
1,000 - 2,499 85.6% 14.4% 84.6% 15.4%
257
2,500 - 9,999 85.8% 14.2% 85.0% 15.0%
153
10,000 or more 85.3% 14.7% 80.3% 19.7%
14
Educational Svc Centers 84.2% 15.8% 81.4% 18.6%
43
Colleges & Universities
84.0%
16.0%
83.1%
16.9%
32
Fire Districts
91.0%
9.0%
90.8%
9.2%
3
Metro Housing Authorities 85.1% 14.9% 83.5% 16.5%
21
Port Authorities 86.1% 13.9% 86.1% 13.9%
1
Regional Transit Authorities 88.3% 11.7% 88.2% 11.8%
12
Note: Rows formatted with bold font include all PPO plans reported for the comparison group.
Note: Includes plans where employees contribute $0 to the medical premium.
Note: Includes plans where the medical premium includes the cost of prescription and dental.
Note: n: number of plans
28
2023 HEALTH INSURANCE REPORT
MEDICAL INSURANCE – PPO PLANS
Table 22 is a continuation of Table 21 and breaks down the employer and employee percent share costs
by region and number of employees covered. This data corresponds with the data displayed in Table 20.
Table 22
Employer & Employee Cost Sharing Percentage
Towards Medical Premium by Region
(PPO Plans)
Single
Family
Comparison Group
Employer
Share
Employee
Share
Employer
Share
Employee
Share
n
STATEWIDE
86.3%
13.7%
85.5%
14.5%
991
REGION
1 - Akron/Canton
87.2%
12.8%
87.2%
12.8%
171
2 - Cincinnati
83.9%
16.1%
82.4%
17.6%
85
3 - Cleveland
87.2%
12.8%
87.4%
12.6%
218
4 - Columbus
85.2%
14.8%
83.5%
16.5%
156
5 - Dayton
82.6%
17.4%
80.8%
19.2%
87
6 - Southeast Ohio
87.8%
12.2%
85.5%
14.5%
89
7 - Toledo
85.4%
14.6%
84.2%
15.8%
102
8 - Warren/Youngstown
90.2%
9.8%
90.2%
9.8%
83
EMPLOYEES COVERED
1 - 49
87.8%
12.2%
87.1%
12.9%
123
50 - 99
87.0%
13.0%
86.1%
13.9%
152
100 - 149
86.4%
13.6%
85.9%
14.1%
206
150 - 249
85.4%
14.6%
84.4%
15.6%
223
250 - 499
86.8%
13.2%
85.9%
14.1%
169
500 - 999
84.5%
15.5%
84.0%
16.0%
72
1,000 or more
85.7%
14.3%
83.7%
16.3%
46
Note: Includes plans where employees contribute $0 to the medical premium.
Note: Includes plans where the medical premium includes the cost of prescription and dental.
Note: n: number of plans.

29
2023 HEALTH INSURANCE REPORT
MEDICAL INSURANCE – PPO PLANS
NETWORK DEDUCTIBLES
Table 23 shows the average deductibles for jurisdictions, regions, and the number of employees covered
for PPO plans.
Table 23
Average In-Network Deductible Amount
(PPO Plans)
Comparison Group
Single
Family
n
STATEWIDE $ 496
$ 1,009
991
State of Ohio
$ 400
$ 800
2
Counties
$ 569
$ 1,184
80
Cities
$ 426
$ 872
171
Townships
$ 418
$ 910
39
School Districts & ESCs
$ 492
$ 1,012
630
Colleges & Universities
$ 814
$ 1,184
32
Fire Districts
$ 667
$ 1,333
3
Metro Housing Authorities
$ 561
$ 1,277
21
Port Authorities
$ 750
$ 1,500
1
Regional Transit Authorities
$ 433
$ 908
12
REGION
1 - Akron/Canton
$ 390
$ 791
171
2 - Cincinnati
$ 592
$ 1,224
85
3 - Cleveland
$ 526
$ 1,044
218
4 - Columbus
$ 463
$ 1,018
156
5 - Dayton
$ 437
$ 916
87
6 - Southeast Ohio
$ 477
$ 1,050
89
7 - Toledo
$ 724
$ 1,314
102
8 - Warren/Youngstown
$ 403
$ 814
83
EMPLOYEES COVERED
1 - 49
$ 544
$ 1,177
123
50 - 99
$ 464
$ 962
152
100 - 149
$ 502
$ 958
206
150 - 249
$ 456
$ 936
223
250 - 499
$ 523
$ 1,064
169
500 - 999
$ 547
$ 1,114
72
1,000 or more
$ 459
$ 921
46
Note: Average deductible amounts include plans where employees contribute $0 to the annual deductible.
Note: n: number of plans.
30
2023 HEALTH INSURANCE REPORT
MEDICAL INSURANCE – PPO PLANS
Figures 11 and 12 show the percent of plans in each deductible category for single and family coverage
displayed in Table 23.
Figure 11
Figure 12
5.6%
6.3%
40.0%
47.6%
0.5%
Deductible Categories for Single
In-Network Medical Coverage
$0
$1-$124
$125-$499
$500-$1,399
$1,400 or more
5.6%
5.8%
38.8%
49.0%
0.8%
Deductible Categories for Family
In-Network Medical Coverage
$0
$1-$249
$250-$899
$900-$2,799
$2,800 or more
31
2023 HEALTH INSURANCE REPORT
MEDICAL INSURANCE – PPO PLANS
NON-NETWORK DEDUCTIBLES
Table 24 shows the average non-network deductibles for jurisdictions, regions, and the number of
employees covered.
Table 24
Average Non-Network Deductible Amount
(PPO Plans)
Comparison Group
Single
Family
n
STATEWIDE $ 1,182
$ 2,403 991
State of Ohio
$ 800
$ 1,600
2
Counties
$ 1,211
$ 2,507
80
Cities
$ 1,119
$ 2,314
171
Townships
$ 2,372
$ 4,806
39
School Districts & ESCs
$ 1,026
$ 2,115
630
Colleges & Universities
$ 1,860
$ 2,817
32
Fire Districts
$ 12,750
$ 25,500
3
Metro Housing Authorities
$ 2,011
$ 4,259
21
Port Authorities
$ 2,250
$ 4,500
1
Regional Transit Authorities
$ 1,473
$ 2,991
12
REGION
1 - Akron/Canton
$ 917
$ 1,882
171
2 - Cincinnati
$ 1,802
$ 3,859
85
3 - Cleveland
$ 1,047
$ 2,071
218
4 - Columbus
$ 1,043
$ 2,257
156
5 - Dayton
$ 1,488
$ 3,090
87
6 - Southeast Ohio
$ 1,168
$ 2,399
89
7 - Toledo
$ 1,486
$ 2,703
102
8 - Warren/Youngstown
$ 1,050
$ 2,085
83
EMPLOYEES COVERED
1 - 49
$ 1,814
$ 3,747
123
50 - 99
$ 1,263
$ 2,626
152
100 - 149
$ 1,116
$ 2,130
206
150 - 249
$ 978
$ 1,980
223
250 - 499
$ 1,060
$ 2,172
169
500 - 999
$ 1,128
$ 2,401
72
1,000 or more
$ 1,094
$ 2,307
46
Note: Average deductible amounts include plans where employees contribute $0 to the annual deductible.
Note: n: number of plans.
32
2023 HEALTH INSURANCE REPORT
MEDICAL INSURANCE – PPO PLANS
OUT-OF-POCKET MAXIMUMS
Tables 25 and 26 give the average, minimum, and maximum out-of-pocket maximums for single and
family medical coverage.
Table 25
Average In-Network Out-of-Pocket Maximums
(PPO Plans)
Single
Family
Comparison Group
Average
Minimum
Maximum
Average
Minimum
Maximum
n
STATEWIDE $ 2,666
$ 0
$ 9,100
$ 5,365
$ 0
$ 18,200 991
State of Ohio $ 2,500 $ 2,500
$ 2,500
$ 5,000 $ 5,000 $ 5,000
2
Counties $ 2,630 $ 400
$ 7,900
$ 5,359 $ 800 $ 15,800
80
Cities $ 2,171
$ 0
$ 7,350
$ 4,359
$ 0
$ 14,700
171
Townships $ 2,309
$ 0
$ 7,150
$ 4,813
$ 0
$ 14,300
39
School Districts & ESCs $ 2,775
$ 0
$ 9,100
$ 5,555
$ 0
$ 18,200
630
Colleges & Universities $ 3,559 $ 900
$ 8,150
$ 7,005 $ 1,800 $ 14,700
32
Fire Districts $ 5,667 $ 3,000
$ 8,000
$ 11,333 $ 6,000 $ 16,000
3
Metro Housing Authorities $ 2,703 $ 350
$ 6,600
$ 6,299 $ 700 $ 15,000
21
Port Authorities $ 5,700 $ 5,700
$ 5,700
$ 11,400 $ 11,400 $ 11,400
1
Regional Transit
Authorities
$ 1,958 $ 200
$ 3,500
$ 3,750 $ 400 $ 6,500
12
REGION
1 - Akron/Canton $ 1,700
$ 0
$ 8,500
$ 3,416
$ 0
$ 17,100
171
2 - Cincinnati $ 3,110 $ 170
$ 8,000
$ 6,280 $ 500 $ 16,000
85
3 - Cleveland $ 3,345
$ 0
$ 8,700
$ 6,713
$ 0
$ 17,400
218
4 - Columbus $ 2,662
$ 0
$ 9,100
$ 5,491
$ 0
$ 18,200
156
5 - Dayton $ 2,060
$ 0
$ 6,600
$ 4,141
$ 0
$ 13,200
87
6 - Southeast Ohio $ 2,697 $ 200
$ 9,100
$ 5,285 $ 400 $ 18,200
89
7 - Toledo $ 2,976 $ 400
$ 9,100
$ 5,851 $ 1,038 $ 18,200
102
8 - Warren/Youngstown $ 2,671 $ 350
$ 8,150
$ 5,463 $ 400 $ 16,300
83
EMPLOYEES COVERED
1 - 49 $ 2,630
$ 0
$ 8,000
$ 5,391
$ 0
$ 16,000
123
50 - 99 $ 2,409
$ 0
$ 8,150
$ 4,943
$ 0
$ 16,300
152
100 - 149 $ 2,703 $ 50
$ 9,100
$ 5,359 $ 100 $ 18,200
206
150 - 249 $ 2,707
$ 0
$ 9,100
$ 5,417
$ 0
$ 18,200
223
250 - 499 $ 2,810
$ 0
$ 9,100
$ 5,623
$ 0
$ 18,200
169
500 - 999 $ 2,863
$ 0
$ 9,100
$ 5,769
$ 0
$ 18,200
72
1,000 or more $ 2,408 $ 500
$ 6,600
$ 4,883 $ 1,000 $ 13,200
46
Note: Excludes plans that have unlimited out-of-network maximums.
Note: n: number of plans.
33
2023 HEALTH INSURANCE REPORT
MEDICAL INSURANCE – PPO PLANS
Table 26
Average Non-Network Out-of-Pocket Maximums
(PPO Plans)
Single
Family
Comparison Group
Average
Minimum
Maximum
Average
Minimum
Maximum
n
STATEWIDE $ 4,244 $ 150
$ 32,600
$ 8,564
$ 300
$ 50,000
991
State of Ohio $ 5,000 $ 5,000
$ 5,000
$ 10,000
$ 10,000
$ 10,000
2
Counties $ 5,027 $ 800
$ 22,050
$ 10,727
$ 1,800
$ 50,000
80
Cities $ 4,335 $ 150
$ 22,050
$ 8,615
$ 300
$ 44,100
171
Townships $ 7,430 $ 1,500
$ 21,000
$ 15,030
$ 3,000
$ 42,000
39
School Districts & ESCs $ 3,737 $ 340
$ 16,000
$ 7,538
$ 500
$ 32,000
630
Colleges & Universities $ 6,417 $ 1,800
$ 32,600
$ 11,174
$ 3,600
$ 20,000
32
Fire Districts $ 21,000 $ 18,000
$ 24,000
$ 42,000
$ 36,000
$ 48,000
3
Metro Housing
Authorities
$ 4,781 $ 1,000
$ 12,000
$ 11,574
$ 3,000
$ 30,000
21
Port Authorities - - - - - - 1
Regional Transit
Authorities
$ 2,956 $ 1,300
$ 4,500
$ 5,633
$ 2,500
$ 9,000
12
REGION
1 - Akron/Canton $ 3,063 $ 150
$ 22,050
$ 5,995
$ 300
$ 44,100
171
2 - Cincinnati $ 6,421 $ 340
$ 24,000
$ 13,419
$ 1,000
$ 48,000
85
3 - Cleveland $ 3,603 $ 400
$ 22,050
$ 7,192
$ 500
$ 44,100
218
4 - Columbus $ 4,499 $ 500
$ 16,000
$ 9,107
$ 800
$ 32,000
156
5 - Dayton $ 4,478 $ 1,000
$ 18,000
$ 9,099
$ 2,000
$ 36,000
87
6 - Southeast Ohio $ 4,674 $ 600
$ 21,000
$ 9,400
$ 1,200
$ 42,000
89
7 - Toledo $ 4,704 $ 800
$ 32,600
$ 9,305
$ 1,998
$ 50,000
102
8 - Warren/Youngstown $ 3,713 $ 900
$ 20,700
$ 7,673
$ 900
$ 41,400
83
EMPLOYEES COVERED
1 - 49 $ 6,093 $ 1,300
$ 24,000
$ 12,820
$ 2,600
$ 50,000
123
50 - 99 $ 4,645 $ 800
$ 22,050
$ 9,437
$ 1,200
$ 44,100
152
100 - 149 $ 4,063 $ 150
$ 32,600
$ 7,767
$ 300
$ 26,400
206
150 - 249 $ 3,430 $ 500
$ 15,200
$ 6,814
$ 1,000
$ 30,400
223
250 - 499 $ 3,878 $ 340
$ 22,050
$ 7,835
$ 700
$ 44,100
169
500 - 999 $ 3,871 $ 500
$ 14,200
$ 8,149
$ 500
$ 28,400
72
1,000 or more $ 4,223 $ 500
$ 9,300
$ 8,752
$ 1,000
$ 18,600
46
Note: Excludes plans that have unlimited out-of-network maximums.
Note: n: number of plans.
34
MEDICAL INSURANCE – HDHPs
2023 HEALTH INSURANCE REPORT
MEDICAL INSURANCE – HDHPs
HDHP PREMIUMS
The second most frequently utilized plan type is the High Deductible Health Plan (HDHP). HDHPs
account for 47.1% of all plans reported this year. Table 27 breaks down the average HDHP medical
premiums and the contribution amounts shared by the employer and the employee. These averages include
the costs of prescription, dental, and vision coverages when included with the medical premiums.
Table 27
Average Monthly Employer & Employee Contributions
Towards Medical Premium
(HDHP Plans)
Single
Family
Comparison Group
Employer
Share
Employee
Share
Total
Employer
Share
Employee
Share
Total
n
STATEWIDE $ 669.27 $ 87.75
$ 757.02 $ 1,799.78 $ 262.13 $ 2,061.91 939
State of Ohio $ 697.00 $ 78.00
$ 775.00 $ 2,089.00 $ 233.00 $ 2,322.00 1
Counties $ 655.21 $ 91.51
$ 746.72 $ 1,838.48 $ 289.19 $ 2,127.67 60
Less than 50,000 $ 676.33 $ 112.35
$ 788.68 $ 1,863.79 $ 350.67 $ 2,214.46 30
50,000 - 149,999 $ 646.44 $ 82.92
$ 729.36 $ 1,850.22 $ 256.84 $ 2,107.06 19
150,000 or more $ 614.68 $ 51.42
$ 666.10 $ 1,749.17 $ 177.38 $ 1,926.55 11
Cities $ 679.22 $ 79.79
$ 759.01 $ 1,914.82 $ 237.96 $ 2,152.78 186
Less than 25,000 $ 668.61 $ 77.29
$ 745.90 $ 1,914.29 $ 234.50 $ 2,148.79 145
25,000 - 99,999 $ 713.76 $ 91.25
$ 805.01 $ 1,950.77 $ 257.16 $ 2,207.93 38
100,000 or more $ 782.81 $ 66.74
$ 849.55 $ 1,531.84 $ 179.65 $ 1,711.49 3
Townships $ 677.38 $ 61.27
$ 738.65 $ 1,961.18 $ 185.46 $ 2,146.64 108
Less than 10,000 $ 716.21 $ 58.42
$ 774.63 $ 2,034.56 $ 171.35 $ 2,205.91 56
10,000 - 29,999 $ 664.62 $ 53.65
$ 718.27 $ 1,971.07 $ 164.09 $ 2,135.16 36
30,000 or more $ 577.54 $ 86.22
$ 663.76 $ 1,705.67 $ 277.17 $ 1,982.84 16
School Districts & ESCs $ 665.16 $ 94.40
$ 759.56 $ 1,702.31 $ 280.29 $ 1,982.60 491
Less than 1,000 $ 675.81 $ 87.88
$ 763.69 $ 1,761.58 $ 245.35 $ 2,006.93 136
1,000 - 2,499 $ 665.96 $ 97.54
$ 763.50 $ 1,726.14 $ 277.39 $ 2,003.53 196
2,500 - 9,999 $ 632.06 $ 91.15
$ 723.21 $ 1,590.06 $ 290.72 $ 1,880.78 104
10,000 or more $ 671.13 $ 104.36
$ 775.49 $ 1,601.70 $ 435.58 $ 2,037.28 13
Educational Svc Centers $ 705.63 $ 106.23
$ 811.86 $ 1,709.44 $ 331.35 $ 2,040.79 42
Colleges & Universities $ 643.43 $ 110.29
$ 753.72 $ 1,878.39 $ 329.85 $ 2,208.24 38
Fire Districts $ 505.36 $ 62.39
$ 567.75 $ 1,549.32 $ 204.22 $ 1,753.54 16
Metro Housing Authorities $ 822.82 $ 91.08
$ 913.90 $ 2,211.01 $ 253.56 $ 2,464.57 27
Port Authorities $ 600.98 $ 80.29
$ 681.27 $ 1,738.50 $ 232.15 $ 1,970.65 4
Regional Transit Authorities $ 662.74 $ 105.51
$ 768.25 $ 1,628.91 $ 312.72 $ 1,941.63 8
Note: Rows formatted with bold font include all HDHP plans reported for the comparison group.
Note: Includes plans where employees contribute $0 to the medical premium.
Note: Includes plans where the medical premium includes the cost of prescription and dental.
Note: n: number of plans
35
MEDICAL INSURANCE – HDHPs
2023 HEALTH INSURANCE REPORT
Table 28 organizes the same data in Table 27 by region and by the number of employees covered. These
averages include the costs of prescription, dental, and vision coverages when included with the medical
premiums. A breakdown of the regions is on page 61.
Table 28
Average Monthly Employer & Employee Contributions
Towards Medical Premium by Region
(HDHP Plans)
Single
Family
Comparison Group
Employer
Share
Employee
Share
Total
Employer
Share
Employee
Share
Total
n
STATEWIDE $ 669.27 $ 87.75 $ 757.02 $ 1,799.78 $ 262.13 $ 2,061.91 939
REGION
1 - Akron/Canton $ 607.95 $ 65.85 $ 673.80 $ 1,726.01 $ 185.07 $ 1,911.08 50
2 - Cincinnati $ 634.36 $ 85.64 $ 720.00 $ 1,763.21 $ 262.79 $ 2,026.00 134
3 - Cleveland $ 636.55 $ 61.33 $ 697.88 $ 1,720.53 $ 164.16 $ 1,884.69 107
4 - Columbus $ 711.87 $ 97.21 $ 809.08 $ 1,883.01 $ 309.95 $ 2,192.96 193
5 - Dayton $ 658.74 $ 106.64 $ 765.38 $ 1,799.48 $ 304.65 $ 2,104.13 173
6 - Southeast Ohio $ 736.30 $ 97.38 $ 833.68 $ 1,868.85 $ 296.64 $ 2,165.49 77
7 - Toledo $ 661.90 $ 85.55 $ 747.45 $ 1,761.49 $ 259.88 $ 2,021.37 158
8 - Warren/Youngstown $ 684.40 $ 59.95 $ 744.35 $ 1,839.23 $ 154.69 $ 1,993.92 47
EMPLOYEES COVERED
1 - 49 $ 686.52 $ 74.99 $ 761.51 $ 1,931.66 $ 232.22 $ 2,163.88 203
50 - 99 $ 671.99 $ 81.47 $ 753.46 $ 1,852.04 $ 226.16 $ 2,078.20 177
100 - 149 $ 668.92 $ 89.80 $ 758.72 $ 1,776.28 $ 257.07 $ 2,033.35 170
150 - 249 $ 677.16 $ 98.37 $ 775.53 $ 1,797.31 $ 282.36 $ 2,079.67 185
250 - 499 $ 661.91 $ 89.86 $ 751.77 $ 1,711.18 $ 277.32 $ 1,988.50 115
500 - 999 $ 624.75 $ 102.30 $ 727.05 $ 1,592.07 $ 352.33 $ 1,944.40 57
1,000 or more $ 609.67 $ 95.15 $ 704.82 $ 1,536.21 $ 340.46 $ 1,876.67 32
Note: Includes plans where employees contribute $0 to the medical premium.
Note: Includes plans where the medical premium includes the cost of prescription and dental.
Note: n: number of plans.
36
MEDICAL INSURANCE – HDHPs
2023 HEALTH INSURANCE REPORT
EMPLOYER & EMPLOYEE SHARE OF MEDICAL PREMIUM
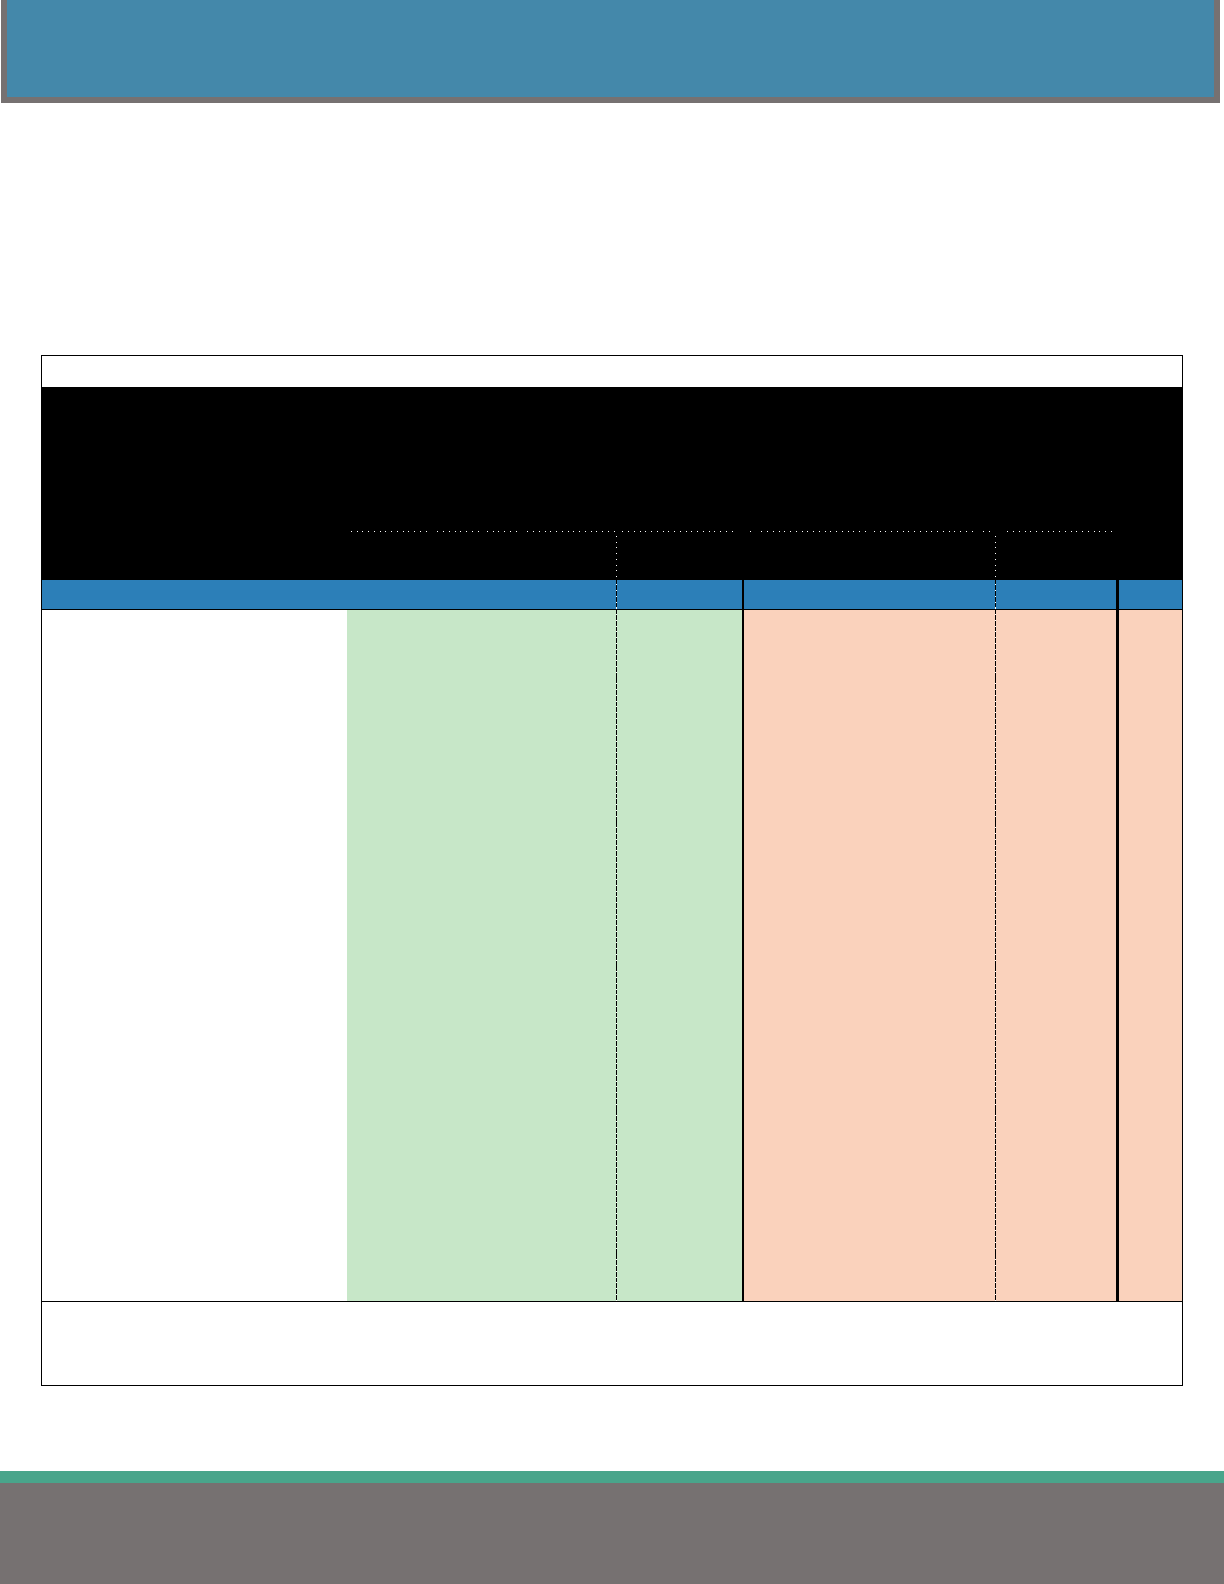
Table 29 displays the employer and employee share of the medical premium for single and family plans by
jurisdiction. This data corresponds with the data displayed in Table 27.
Table 29
Employer & Employee Cost Sharing Percentage
Towards Medical Premium
(HDHP Plans)
Single
Family
Comparison Group
Employer
Share
Employee
Share
Employer
Share
Employee
Share
n
STATEWIDE
88.5%
11.5%
87.5%
12.5%
939
State of Ohio
89.9%
10.1%
90.0%
10.0%
1
Counties
87.9%
12.1%
86.7%
13.3%
60
Less than 50,000
85.7%
14.3%
84.2%
15.8%
30
50,000 - 149,999 88.9% 11.1% 88.2% 11.8% 19
150,000 or more
91.9%
8.1%
90.8%
9.2%
11
Cities
89.5%
10.5%
89.0%
11.0%
186
Less than 25,000 89.6% 10.4% 89.1% 10.9% 145
25,000 - 99,999 88.7% 11.3% 88.4% 11.6% 38
100,000 or more 92.1% 7.9% 89.2% 10.8% 3
Townships 91.4% 8.6% 91.6% 8.4% 108
Less than 10,000 92.0% 8.0% 93.0% 7.0% 56
10,000 - 29,999 92.5% 7.5% 92.0% 8.0% 36
30,000 or more
87.6%
12.4%
86.4%
13.6%
16
School Districts & ESCs 87.8% 12.2% 86.2% 13.8% 491
Less than 1,000
88.7%
11.3%
88.1%
11.9%
136
1,000 - 2,499
87.5%
12.5%
86.4%
13.6%
196
2,500 - 9,999 87.7% 12.3% 85.2% 14.8% 104
10,000 or more 86.4% 13.6% 79.2% 20.8% 13
Educational Svc Centers 86.7% 13.3% 83.7% 16.3% 42
Colleges & Universities 85.8% 14.2% 85.3% 14.7% 38
Fire Districts
89.3%
10.7%
88.5%
11.5%
16
Metro Housing Authorities
90.3%
9.7%
90.0%
10.0%
27
Port Authorities
88.3%
11.7%
88.3%
11.7%
4
Regional Transit Authorities
85.4%
14.6%
84.3%
15.7%
8
Note: Rows formatted with bold font include all HDHP plans reported for the comparison group.
Note: Includes plans where employees contribute $0 to the medical premium.
Note: Includes plans where the medical premium includes the cost of prescription and dental.
Note: n: number of plans
37
MEDICAL INSURANCE – HDHPs
2023 HEALTH INSURANCE REPORT
Table 30 is a continuation of Table 29 and breaks down the employer and employee percent share costs by
region and number of employees covered. This data corresponds with the data displayed in Table 28.
Table 30
Employer & Employee Cost Sharing Percentage
Towards Medical Premium by Region
(HDHP Plans)
Single
Family
Comparison Group
Employer
Share
Employee
Share
Employer
Share
Employee
Share
n
STATEWIDE
88.5%
11.5%
87.5%
12.5%
939
REGION
1 - Akron/Canton
90.4%
9.6%
90.4%
9.6%
50
2 - Cincinnati
88.1%
11.9%
87.0%
13.0%
134
3 - Cleveland
91.2%
8.8%
91.4%
8.6%
107
4 - Columbus 87.8% 12.2% 85.6% 14.4% 193
5 - Dayton 86.2% 13.8% 85.6% 14.4% 173
6 - Southeast Ohio 88.2% 11.8% 86.0% 14.0% 77
7 - Toledo 89.0% 11.0% 87.7% 12.3% 158
8 - Warren/Youngstown 92.2% 7.8% 92.7% 7.3% 47
EMPLOYEES COVERED
1 - 49 90.0% 10.0% 89.5% 10.5% 203
50 - 99
89.2%
10.8%
89.1%
10.9%
177
100 - 149
88.4%
11.6%
87.8%
12.2%
170
150 - 249
87.6%
12.4%
86.7%
13.3%
185
250 - 499 88.3% 11.7% 86.2% 13.8% 115
500 - 999 86.1% 13.9% 82.8% 17.2% 57
1,000 or more 86.2% 13.8% 82.3% 17.7% 32
Note: Includes plans where employees contribute $0 to the medical premium.
Note: Includes plans where the medical premium includes the cost of prescription and dental.
Note: n: number of plans
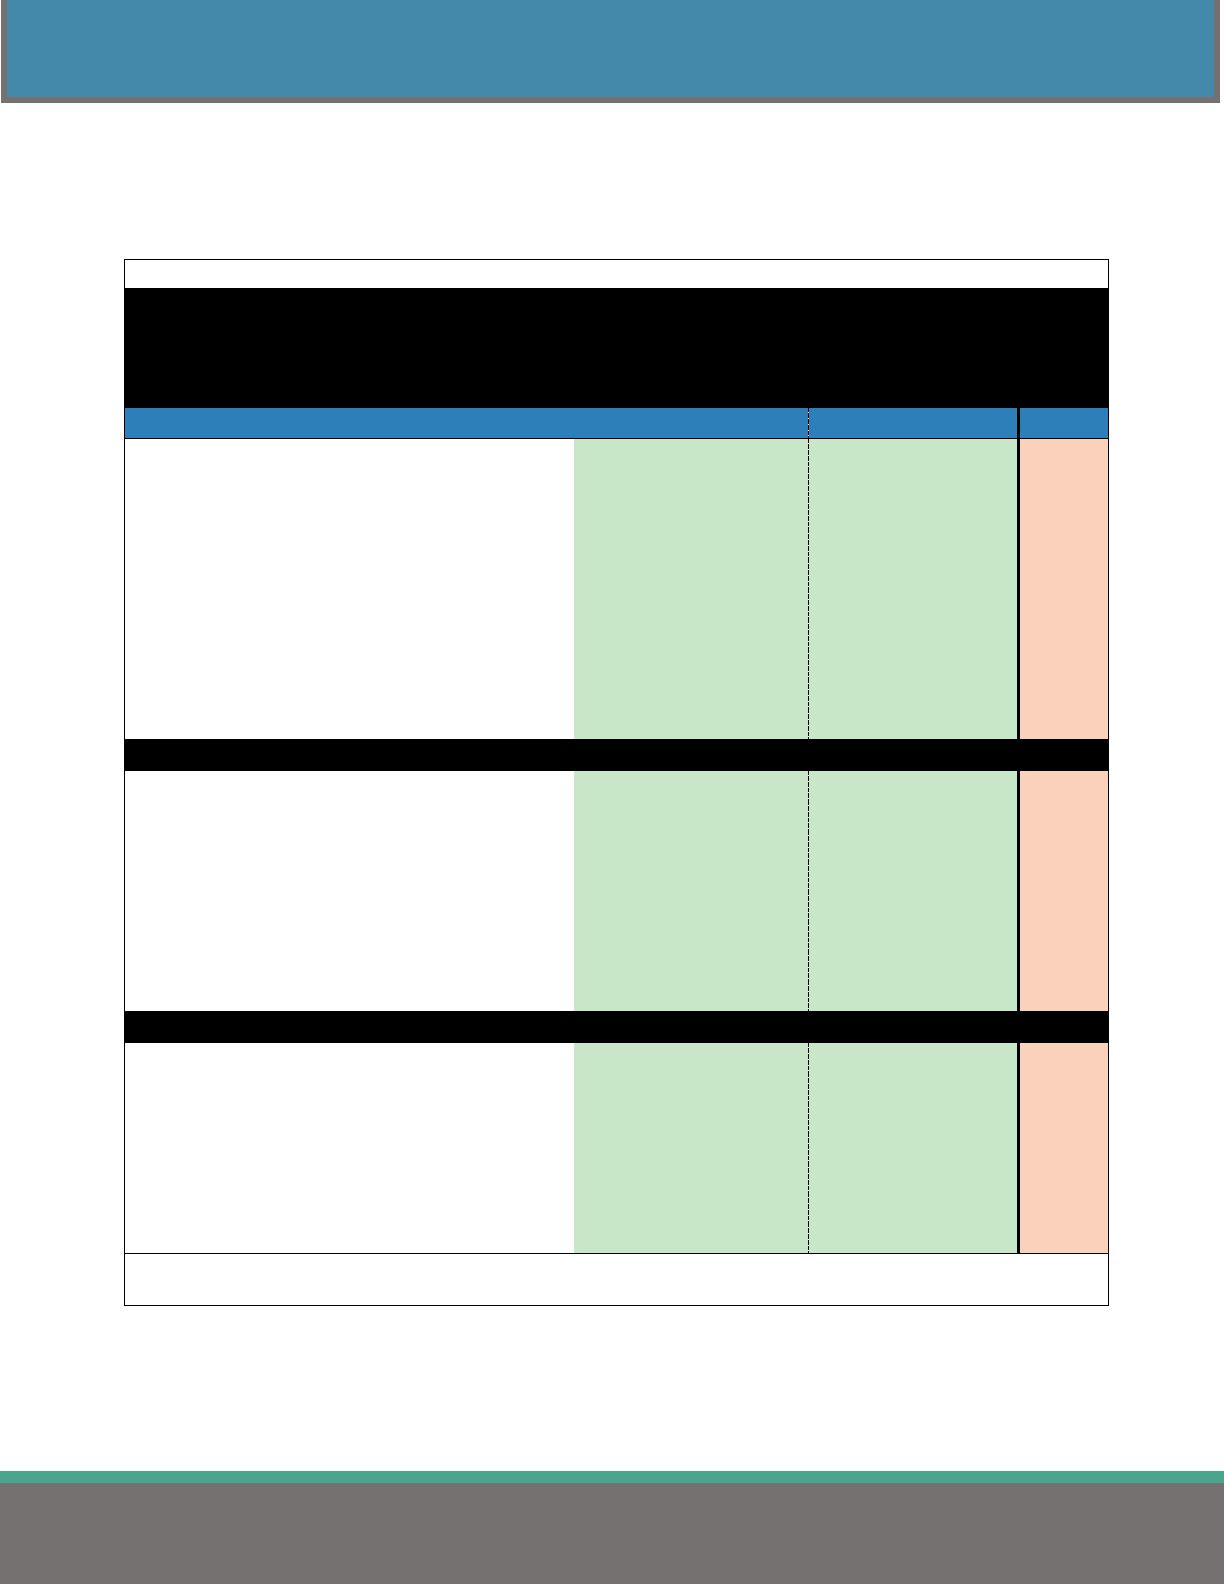
38
MEDICAL INSURANCE – HDHPs
2023 HEALTH INSURANCE REPORT
NETWORK DEDUCTIBLES
Table 31 shows the average deductibles for jurisdictions, regions, and the number of employees covered
for high deductible health plans.
Table 31
Average In-Network Deductible Amount
(HDHPs)
Comparison Group
Single
Family
n
STATEWIDE
$ 2,978
$ 5,858
939
State of Ohio $ 2,000 $ 4,000 1
Counties $ 2,429 $ 4,817 60
Cities $ 2,900 $ 5,774 186
Townships $ 3,834 $ 7,710 108
School Districts & ESCs $ 2,891 $ 5,657 491
Colleges & Universities $ 2,805 $ 5,424 38
Fire Districts $ 3,247 $ 6,494 16
Metro Housing Authorities $ 3,263 $ 6,156 27
Port Authorities $ 2,788 $ 4,200 4
Regional Transit Authorities $ 2,344 $ 4,688 8
REGION
1 - Akron/Canton $ 3,200 $ 6,557 50
2 - Cincinnati $ 2,823 $ 5,631 134
3 - Cleveland $ 3,541 $ 6,887 107
4 - Columbus $ 3,108 $ 6,055 193
5 - Dayton $ 2,674 $ 5,293 173
6 - Southeast Ohio $ 2,955 $ 5,859 77
7 - Toledo $ 2,847 $ 5,507 158
8 - Warren/Youngstown $ 2,951 $ 5,880 47
EMPLOYEES COVERED
1 - 49 $ 3,423 $ 6,790 203
50 - 99 $ 2,834 $ 5,585 177
100 - 149 $ 2,942 $ 5,824 170
150 - 249 $ 2,887 $ 5,623 185
250 - 499 $ 2,863 $ 5,570 115
500 - 999 $ 2,878 $ 5,649 57
1,000 or more $ 2,297 $ 4,541 32
Note: Average deductible amounts include plans where employees contribute $0 to the annual deductible.
Note: n: number of plans.
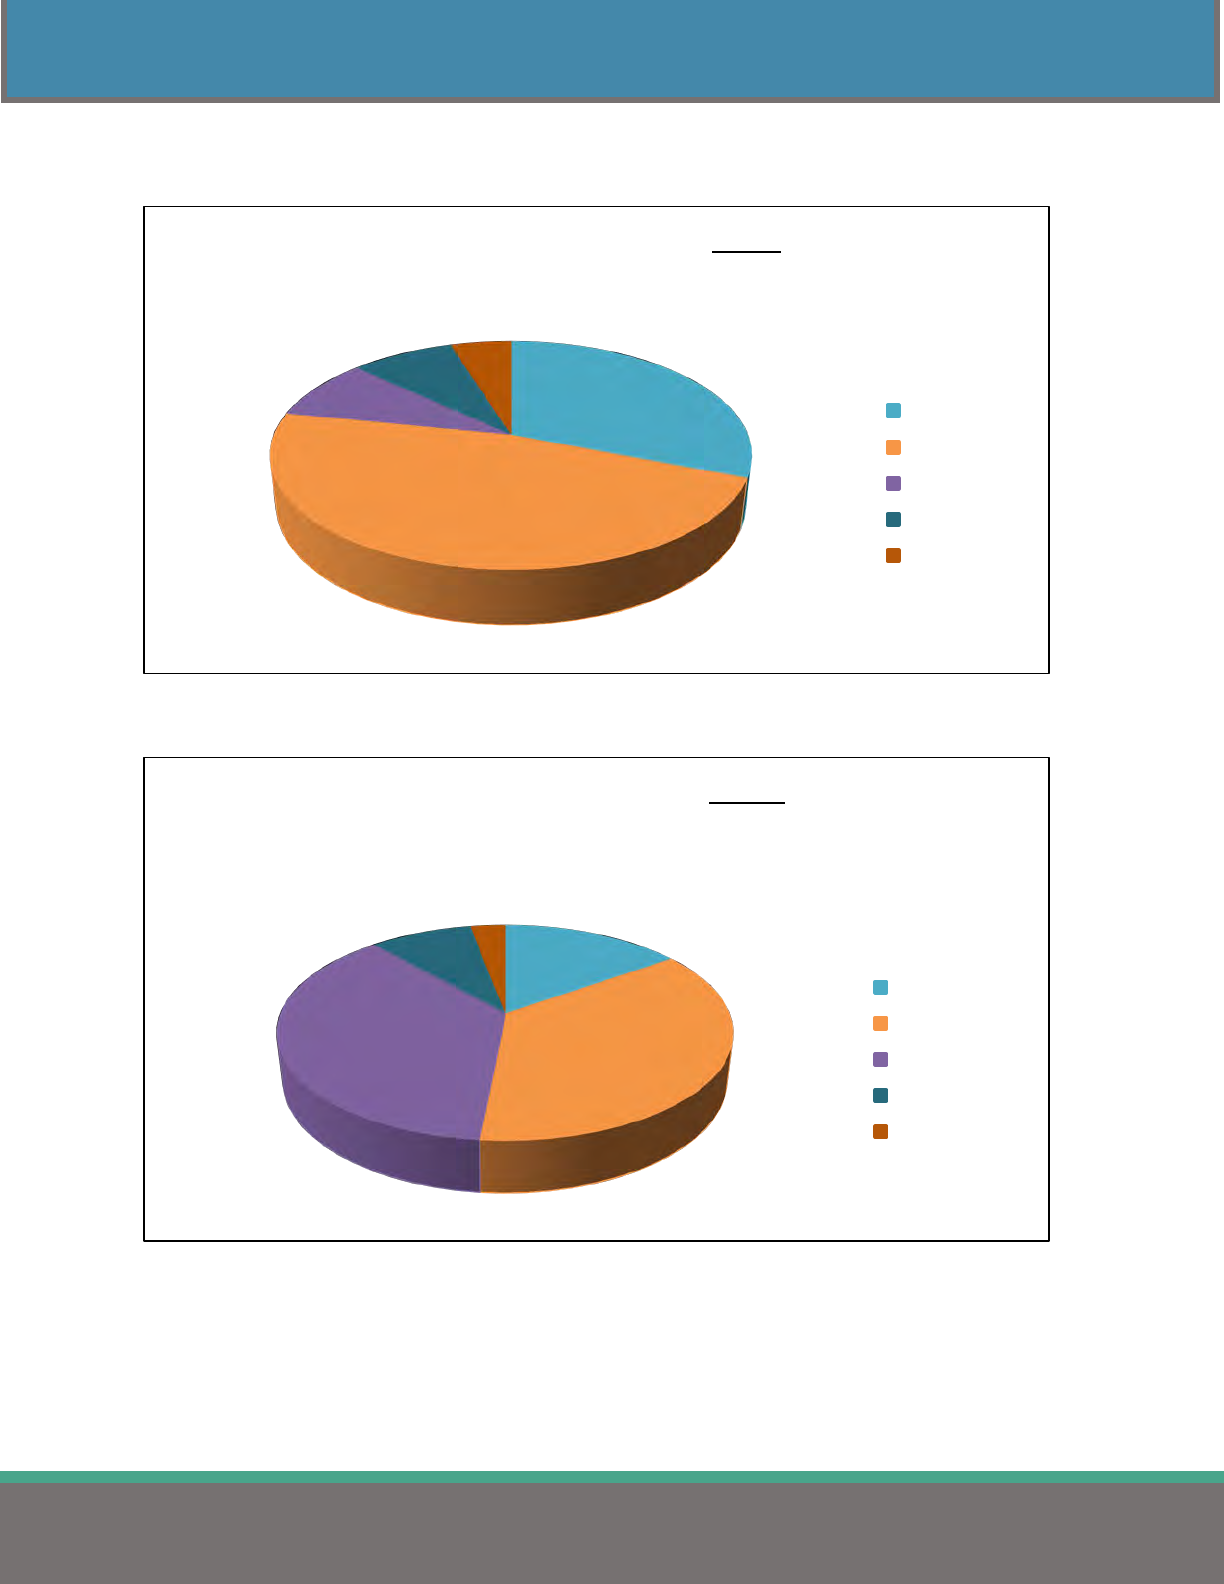
39
MEDICAL INSURANCE – HDHPs
2023 HEALTH INSURANCE REPORT
Figures 13 and 14 show the percent of HDHPs in each deductible category for single and family coverage.
Figure 13
Figure 14
31.1%
47.1%
8.8%
8.2%
4.8%
Deductible Categories for Single
In-Network Medical Coverage
$0-$2,499
$2,500-$3,499
$3,500-$4,499
$4,500-$5,999
$6,000 or more
15.1%
36.4%
36.9%
8.7%
2.9%
Deductible Categories for Family
In-Network Medical Coverage
$0-$3,999
$4,000-$5,999
$6,000-$9,999
$10,000-$12,999
$13,000 or more

40
MEDICAL INSURANCE – HDHPs
2023 HEALTH INSURANCE REPORT
NON-NETWORK DEDUCTIBLES
Table 32 shows the average non-network deductibles for jurisdictions, regions, and the number of
employees covered.
Table 32
Average Non-Network Deductible Amount
(HDHPs)
Comparison Group
Single
Family
n
STATEWIDE
$ 5,732
$ 11,297
939
State of Ohio
$ 4,000
$ 8,000
1
Counties
$ 4,718
$ 9,370
60
Cities
$ 6,053
$ 11,996
186
Townships
$ 7,928
$ 16,053
108
School Districts & ESCs
$ 5,086
$ 9,965
491
Colleges & Universities
$ 5,803
$ 11,367
38
Fire Districts
$ 9,188
$ 17,223
16
Metro Housing Authorities
$ 8,552
$ 16,719
27
Port Authorities
$ 4,125
$ 8,250
4
Regional Transit Authorities
$ 4,393
$ 8,786
8
REGION
1 - Akron/Canton $ 7,033
$ 14,239 50
2 - Cincinnati $ 5,525
$ 10,900 134
3 - Cleveland $ 6,523
$ 12,766 107
4 - Columbus $ 5,931
$ 11,560 193
5 - Dayton $ 5,387
$ 10,578 173
6 - Southeast Ohio $ 6,167
$ 12,255 77
7 - Toledo $ 4,675
$ 9,232 158
8 - Warren/Youngstown $ 6,277
$ 12,702 47
EMPLOYEES COVERED
1 - 49
$ 7,266
$ 14,413
203
50 - 99
$ 5,582
$ 10,978
177
100 - 149
$ 5,439
$ 10,761
170
150 - 249
$ 5,245
$ 10,318
185
250 - 499
$ 5,192
$ 10,112
115
500 - 999
$ 5,337
$ 10,529
57
1,000 or more
$ 4,339
$ 8,694
32
Note: Average deductible amounts include plans where employees contribute $0 to the annual deductible.
Note: n: number of plans.
41
MEDICAL INSURANCE – HDHPs
2023 HEALTH INSURANCE REPORT
OUT-OF-POCKET MAXIMUMS
Tables 33 and 34 display the average, minimum, and maximum out-of-pocket maximums for single and
family medical coverage for all high deductible health plans reported.
Table 33
Average In-Network Out-of-Pocket Maximums
(HDHPs)
Single
Family
Comparison Group
Average
Minimum
Maximum
Average
Minimum
Maximum
n
STATEWIDE $ 4,207
$ 1,400 $ 12,000 $ 8,404 $ 2,800 $ 27,400
939
State of Ohio $ 3,500
$ 3,500 $ 3,500 $ 7,000 $ 7,000 $ 7,000
1
Counties $ 4,173
$ 1,500 $ 12,000 $ 8,330 $ 4,100 $ 24,000
60
Cities $ 3,971
$ 1,400 $ 8,700 $ 7,898 $ 2,800 $ 17,400
186
Townships $ 4,779
$ 2,000 $ 8,700 $ 9,745 $ 4,000 $ 27,400
108
School Districts & ESCs $ 4,087
$ 1,500 $ 9,100 $ 8,141 $ 3,000 $ 23,200
491
Colleges & Universities $ 4,380
$ 1,500 $ 7,000 $ 8,811 $ 3,000 $ 14,000
38
Fire Districts $ 5,031
$ 3,000 $ 7,000 $ 10,063 $ 6,000 $ 14,000
16
Metro Housing Authorities $ 5,122
$ 1,800 $ 8,500 $ 10,100 $ 3,000 $ 18,000
27
Port Authorities $ 4,213
$ 2,500 $ 6,350 $ 8,425 $ 5,000 $ 12,700
4
Regional Transit Authorities $ 4,169
$ 1,500 $ 7,500 $ 8,338 $ 3,000 $ 15,000
8
REGION
1 - Akron/Canton $ 4,317
$ 1,400 $ 8,700 $ 8,927 $ 2,800 $ 20,000 50
2 - Cincinnati $ 3,964
$ 1,500 $ 12,000 $ 7,923 $ 3,000 $ 24,000 134
3 - Cleveland $ 4,614
$ 1,500 $ 8,700 $ 9,376 $ 3,000 $ 23,200 107
4 - Columbus $ 4,336
$ 1,500 $ 8,500 $ 8,626 $ 3,000 $ 27,400 193
5 - Dayton $ 3,645
$ 1,500 $ 8,700 $ 7,155 $ 3,000 $ 17,400 173
6 - Southeast Ohio $ 4,702
$ 1,500 $ 9,100 $ 9,594 $ 3,000 $ 18,200 77
7 - Toledo $ 4,241
$ 1,500 $ 9,100 $ 8,292 $ 3,000 $ 18,200 158
8 - Warren/Youngstown $ 4,448
$ 1,500 $ 8,700 $ 9,151 $ 3,000 $ 17,400 47
EMPLOYEES COVERED
1 - 49 $ 4,714
$ 1,500 $ 8,700 $ 9,553 $ 3,000 $ 27,400 203
50 - 99 $ 4,052
$ 1,500 $ 9,100 $ 7,959 $ 3,000 $ 18,200 177
100 - 149 $ 4,132
$ 1,500 $ 8,700 $ 8,330 $ 3,000 $ 17,400 170
150 - 249 $ 3,943
$ 1,400 $ 8,700 $ 7,831 $ 2,800 $ 23,200 185
250 - 499 $ 4,313
$ 1,500 $ 12,000 $ 8,662 $ 3,000 $ 24,000 115
500 - 999 $ 4,093
$ 1,500 $ 8,700 $ 7,999 $ 3,000 $ 17,400 57
1,000 or more $ 3,630
$ 1,500 $ 6,850 $ 7,219 $ 3,000 $ 13,700 32
Note: Excludes plans that have unlimited out-of-network maximums.
Note: n: number of plans.
42
MEDICAL INSURANCE – HDHPs
2023 HEALTH INSURANCE REPORT
Table 34
Average Non-Network Out-of-Pocket Maximums
(HDHPs)
Single
Family
Comparison Group
Average
Minimum
Maximum
Average
Minimum
Maximum
n
STATEWIDE $ 9,440 $ 1,500 $ 40,000
$ 18,963 $ 3,000
$ 80,000
939
State of Ohio $ 7,000 $ 7,000 $ 7,000
$ 14,000 $ 14,000
$ 14,000
1
Counties $ 9,412 $ 3,500 $ 24,000
$ 18,590 $ 7,000
$ 48,000
60
Cities $ 10,066 $ 2,800 $ 22,050
$ 20,060 $ 3,000
$ 45,000
186
Townships $ 12,273 $ 2,000 $ 24,000
$ 25,663 $ 4,000
$ 60,000
108
School Districts & ESCs $ 8,181 $ 1,500 $ 40,000
$ 16,291 $ 4,000
$ 80,000
491
Colleges & Universities $ 9,053 $ 3,000 $ 20,000
$ 18,270 $ 6,000
$ 40,000
38
Fire Districts $ 15,113 $ 10,000 $ 22,225
$ 30,227 $ 20,000
$ 44,450
16
Metro Housing Authorities $ 14,988 $ 2,100 $ 22,500
$ 30,900 $ 4,200
$ 60,000
27
Port Authorities $ 8,463 $ 5,000 $ 12,500
$ 16,925 $ 10,000
$ 25,000
4
Regional Transit Authorities $ 9,757 $ 3,000 $ 22,500
$ 19,371 $ 5,000
$ 45,000
8
REGION
1 - Akron/Canton $ 11,222 $ 2,800 $ 22,050
$ 22,913 $ 5,200
$ 44,100
50
2 - Cincinnati $ 9,692 $ 2,000 $ 24,000
$ 19,441 $ 4,000
$ 48,000
134
3 - Cleveland $ 11,075 $ 1,500 $ 22,000
$ 22,560 $ 3,000
$ 60,000
107
4 - Columbus $ 9,789 $ 3,325 $ 40,000
$ 19,622 $ 6,500
$ 80,000
193
5 - Dayton $ 8,181 $ 2,000 $ 21,000
$ 16,006 $ 4,000
$ 42,000
173
6 - Southeast Ohio $ 10,377 $ 3,000 $ 20,700
$ 21,500 $ 6,000
$ 41,000
77
7 - Toledo $ 7,674 $ 3,000 $ 20,000
$ 15,121 $ 6,000
$ 40,000
158
8 - Warren/Youngstown $ 10,664 $ 2,000 $ 22,500
$ 22,417 $ 4,000
$ 60,000
47
EMPLOYEES COVERED $ 11,222 $ 2,800 $ 22,050 $ 22,913 $ 5,200
$ 44,100 50
1 - 49 $ 12,110 $ 3,000 $ 24,000
$ 24,822 $ 3,000
$ 60,000
203
50 - 99 $ 9,728 $ 3,000 $ 22,050
$ 19,074 $ 6,000
$ 44,100
177
100 - 149 $ 8,493 $ 2,000 $ 22,050
$ 17,136 $ 4,000
$ 44,100
170
150 - 249 $ 8,619 $ 1,500 $ 40,000
$ 17,258 $ 4,000
$ 80,000
185
250 - 499 $ 8,341 $ 2,800 $ 24,000
$ 16,878 $ 5,200
$ 48,000
115
500 - 999 $ 8,256 $ 3,000 $ 15,000
$ 16,060 $ 5,000
$ 30,000
57
1,000 or more $ 7,157 $ 2,000 $ 12,000
$ 14,363 $ 4,000
$ 24,000
32
Note: Excludes plans that have unlimited out-of-network maximums.
Note: n: number of plans.
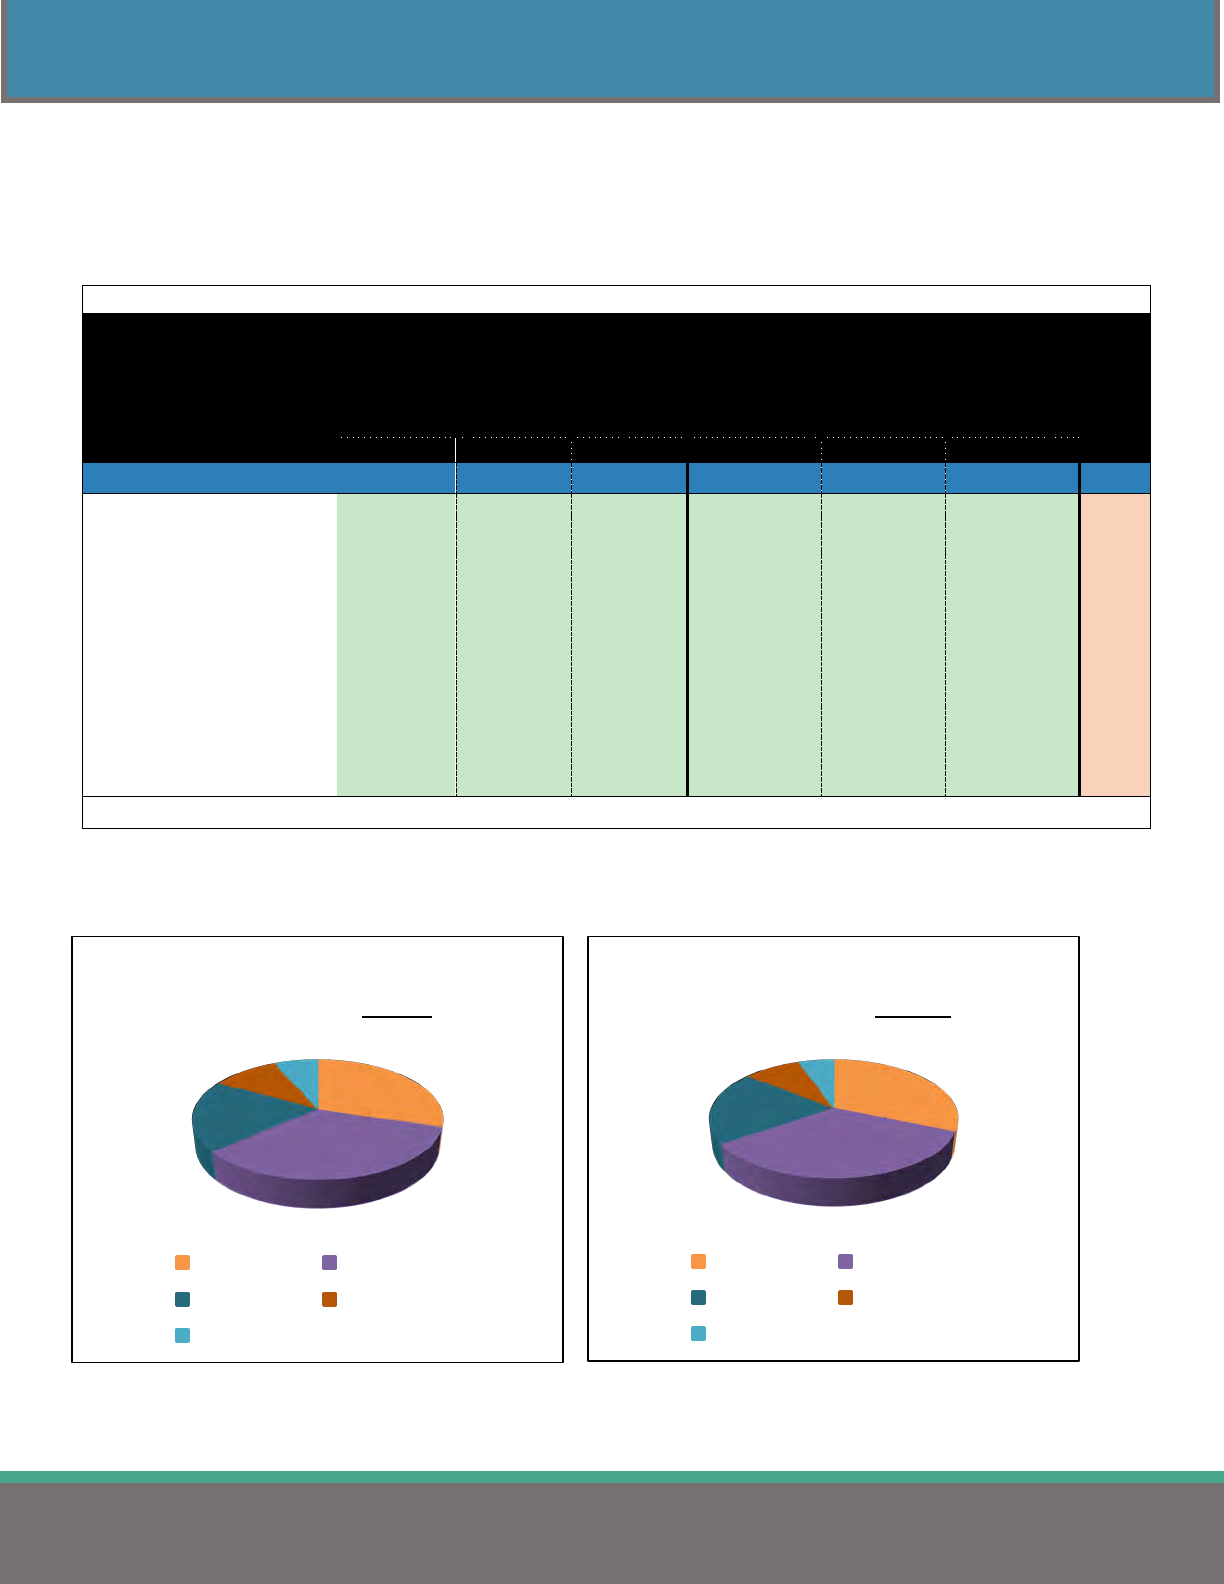
43
MEDICAL INSURANCE – HDHPs
2023 HEALTH INSURANCE REPORT
HEALTH SAVINGS ACCOUNT
A health savings account (HSA) is a tax-exempt account used to pay or reimburse certain medical
expenses incurred by the employee. Table 35 provides the average annual employer contributions towards
an HSA for employers enrolled in a high deductible health plan.
Table 35
Health Savings Accounts
Average Annual Employer Contribution Amount
Single
Family
Comparison Group
Average
Minimum
Maximum
Average
Minimum
Maximum
n
STATEWIDE $ 1,316
$ 200 $ 7,000
$ 2,555 $ 500 $ 12,700 497
State of Ohio $ 1,000
$ 1,000 $ 1,000
$ 2,000 $ 2,000 $ 2,000 1
Counties $ 1,026
$ 200 $ 2,500
$ 2,073 $ 500 $ 5,000 30
Cities $ 1,514
$ 250 $ 3,850
$ 3,045 $ 500 $ 7,750 117
Townships $ 2,261
$ 500 $ 7,000
$ 4,301 $ 1,000 $ 12,700 34
School Districts & ESCs $ 1,153
$ 250 $ 5,741
$ 2,216 $ 500 $ 6,000 273
Colleges & Universities $ 1,212
$ 350 $ 3,850
$ 2,212 $ 700 $ 7,750 27
Fire Districts $ 1,750
$ 1,500 $ 2,000
$ 1,750 $ 1,500 $ 2,000 2
Metro Housing $ 1,393
$ 500 $ 2,500
$ 2,429 $ 1,000 $ 4,300 7
Port Authorities $ 1,038
$ 700 $ 1,875
$ 2,075 $ 1,400 $ 3,750 4
Regional Transit Authorities $ 2,400
$ 950 $ 3,850
$ 4,775 $ 1,800 $ 7,750 2
Note: n: number of employers.
Figures 15 and 16 group the employer’s HSA contribution into categories by contribution amount.
Figure 15 Figure 16
30.0%
33.6%
19.5%
10.3%
6.6%
HSA Employer Contribution
By Category - Single
$0-$999 $1,000-$1,499
$1,500-$1,999 $2,000-$2,499
$2,500 or more
31.2%
34.2%
20.3%
8.9%
5.4%
HSA Employer Contribution
By Category - Family
$0-$1,999 $2,000-$2,999
$3,000-$3,999 $4,000-$4,999
$5,000 or more
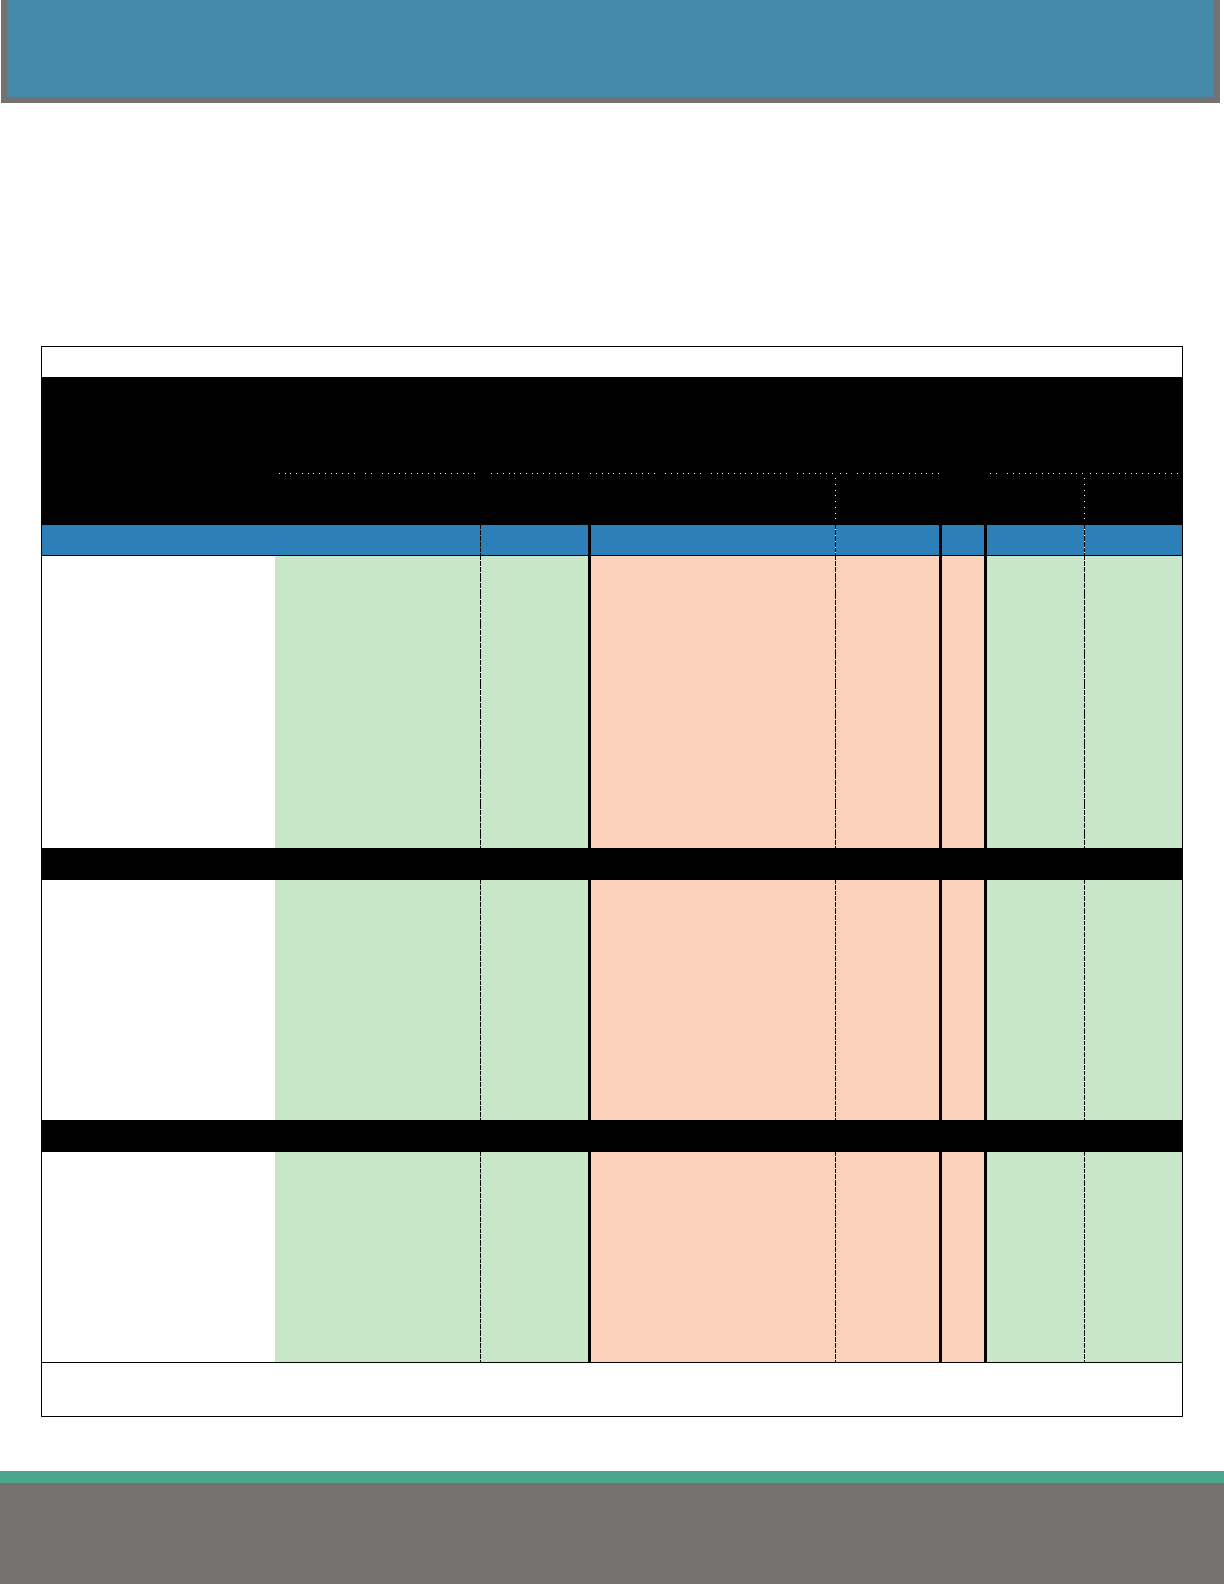
44
PRESCRIPTION INSURANCE
2023 HEALTH INSURANCE REPORT
PRESCRIPTION INSURANCE
PRESCRIPTION CARVE-OUT PREMIUMS
Table 36 displays the employer and employee prescription premiums when purchased in a separate plan.
These costs are not included in the medical premium.
Table 36
Average Monthly Prescription Premiums and Employer/Employee Contributions
Single
Family
Single
Family
Comparison Group
Employer
Share
Employee
Share
Total
Premium
Employer
Share
Employee
Share
Total
Premium
n
Employee
Share
Employee
Share
STATEWIDE $ 152.48 $ 17.40 $ 169.88 $ 342.33 $ 45.16 $ 387.49
69 10.3% 11.6%
State of Ohio
-
-
-
-
-
-
0
-
-
Counties $ 146.89 $ 9.76 $ 156.65 $ 410.72 $ 36.36 $ 447.08
10 6.1% 7.7%
Cities $ 172.30 $ 25.44 $ 197.74 $ 267.82 $ 51.23 $ 319.05
6 15.3% 15.9%
Townships - - - - - - 0 - -
School Districts & ESCs $ 152.97 $ 18.42 $ 171.39 $ 333.90 $ 46.05 $ 379.95
52 10.8% 11.9%
Colleges & Universities - - - - - - 0 - -
Fire Districts - - - - - - 0 - -
Metro Housing Authorities $ 123.31 $ 16.81 $ 140.12 $ 395.22 $ 53.89 $ 449.11
1 12.0% 12.0%
Port Authorities - - - - - - 0 - -
Regional Transit Authorities - - - - - - 0 - -
REGION
1 - Akron/Canton $ 161.14 $ 18.61 $ 179.75 $ 401.42 $ 47.74 $ 449.16
15 10.5% 10.8%
2 - Cincinnati $ 158.66 $ 17.63 $ 176.29 $ 428.38 $ 47.60 $ 475.98
2 10.0% 10.0%
3 - Cleveland $ 127.85 $ 18.06 $ 145.91 $ 293.29 $ 41.42 $ 334.71
29 12.0% 11.9%
4 - Columbus $ 189.50 $ 20.61 $ 210.11 $ 370.28 $ 55.52 $ 425.80
4 10.7% 13.9%
5 - Dayton - - - - - - 0 - -
6 - Southeast Ohio $ 209.77 $ 20.95 $ 230.72 $ 299.02 $ 74.21 $ 373.23
7 9.9% 18.5%
7 - Toledo $ 158.42 $ 11.43 $ 169.85 $ 319.78 $ 25.33 $ 345.11
5 5.5% 7.1%
8 - Warren/Youngstown $ 161.41 $ 10.56 $ 171.97 $ 446.85 $ 28.30 $ 475.15
7 6.0% 6.1%
EMPLOYEES COVERED
1 - 49 $ 163.91 $ 5.92 $ 169.83 $ 482.86 $ 26.64 $ 509.50
3 3.3% 5.0%
50 - 99 $ 157.63 $ 16.37 $ 174.00 $ 406.37 $ 40.29 $ 446.66
9 9.7% 9.4%
100 - 149 $ 144.90 $ 18.44 $ 163.34 $ 350.45 $ 44.26 $ 394.71
17 11.0% 11.1%
150 - 249 $ 192.80 $ 21.07 $ 213.87 $ 348.06 $ 40.23 $ 388.29
9 10.7% 10.6%
250 - 499 $ 139.91 $ 15.47 $ 155.38 $ 304.18 $ 54.16 $ 358.34
19 9.8% 14.1%
500 - 999 $ 128.95 $ 16.73 $ 145.68 $ 317.93 $ 41.65 $ 359.58
7 11.0% 11.0%
1,000 or more $ 176.82 $ 24.41 $ 201.23 $ 289.18 $ 50.29 $ 339.47
5 13.6% 15.0%
Note: Includes plans where employees contribute $0 to the medical premium.
Note: n: number of plans.
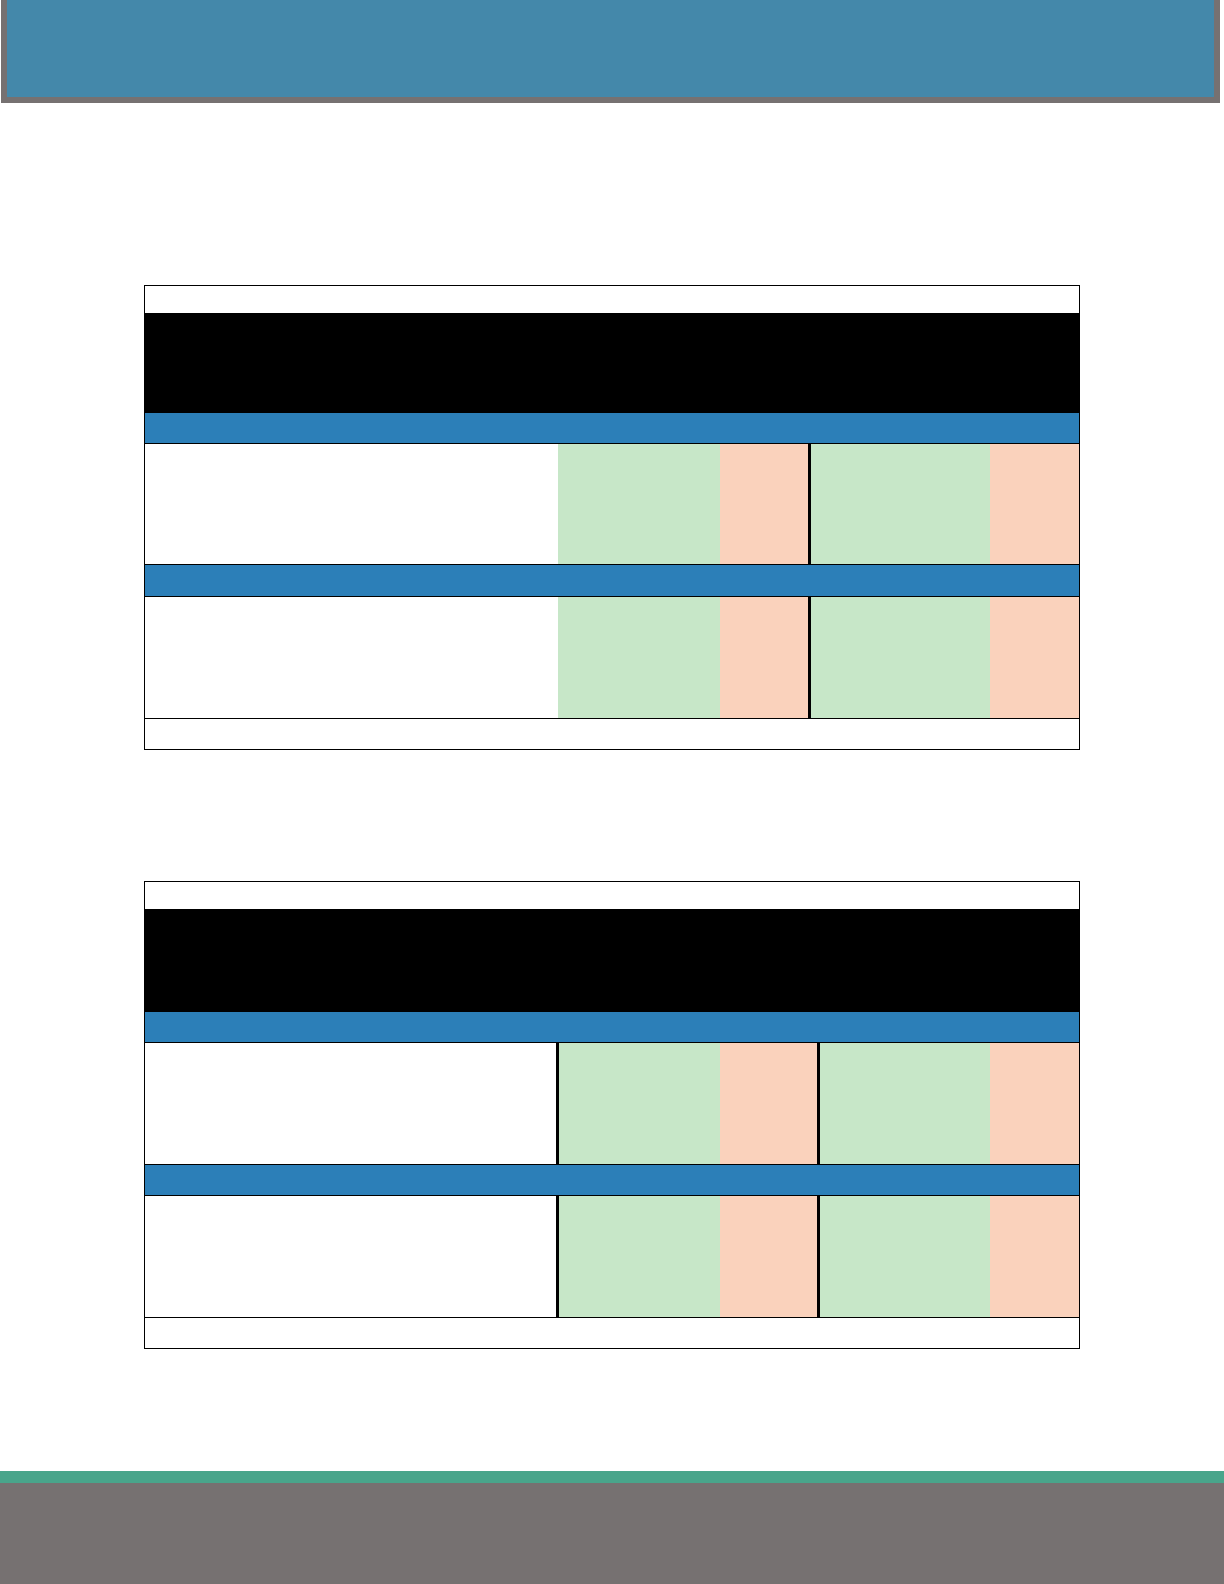
45
PRESCRIPTION INSURANCE
2023 HEALTH INSURANCE REPORT
PRESCRIPTION COPAYS/COINSURANCE – ALL PLAN TYPES
Table 37 displays the average prescription retail copays and coinsurance amounts. The data in this table
includes all prescription plans reported regardless if they are in a separate carved-out plan. This table
breaks down the data extracted from 1,966 prescription plans.
Table 37
Average Prescription Retail Copays/Coinsurance
Comparison Group
Network
n
Non-Network
n
Dollar Copay Amount
Generic
$ 9.99
1,547
$ 12.03
537
Brand (Formulary)
$ 28.06
1,504
$ 12.03
537
Brand (Non-Formulary)
$ 47.89
1,446
$ 39.38
506
Cosmetic/Biologic
$ 92.80
810
$ 58.11
351
Coinsurance Percentage
Generic 13.3% 438
47.1% 517
Brand (Formulary) 15.1% 474
46.9% 527
Brand (Non-Formulary) 14.5% 473
36.0% 509
Cosmetic/Biologic 19.0% 633
47.2% 461
Note: n: number of plans.
Table 38 displays the average prescription mail order copays and coinsurance amounts. The data in this
table includes all prescription plans reported regardless if they are in a separate carved-out plan. This
table breaks down the data extracted from 1,966 prescription plans.
Table 38
Average Prescription Mail Order Copays/Coinsurance
Comparison Group
Network
n
Non-Network
n
Dollar Copay Amount
Generic $ 19.02
1,552 $ 12.04
408
Brand (Formulary) $ 57.21
1,515 $ 31.73
396
Brand (Non-Formulary)
$ 100.22
1,461
$ 56.41
387
Cosmetic/Biologic
$ 117.78
734
$ 46.79
283
Coinsurance Percentage
Generic 13.5% 430 51.9% 371
Brand (Formulary) 14.9% 457 51.0% 375
Brand (Non-Formulary) 13.8% 451 34.8% 356
Cosmetic/Biologic 17.7% 533 51.2% 340
Note: n: number of plans.
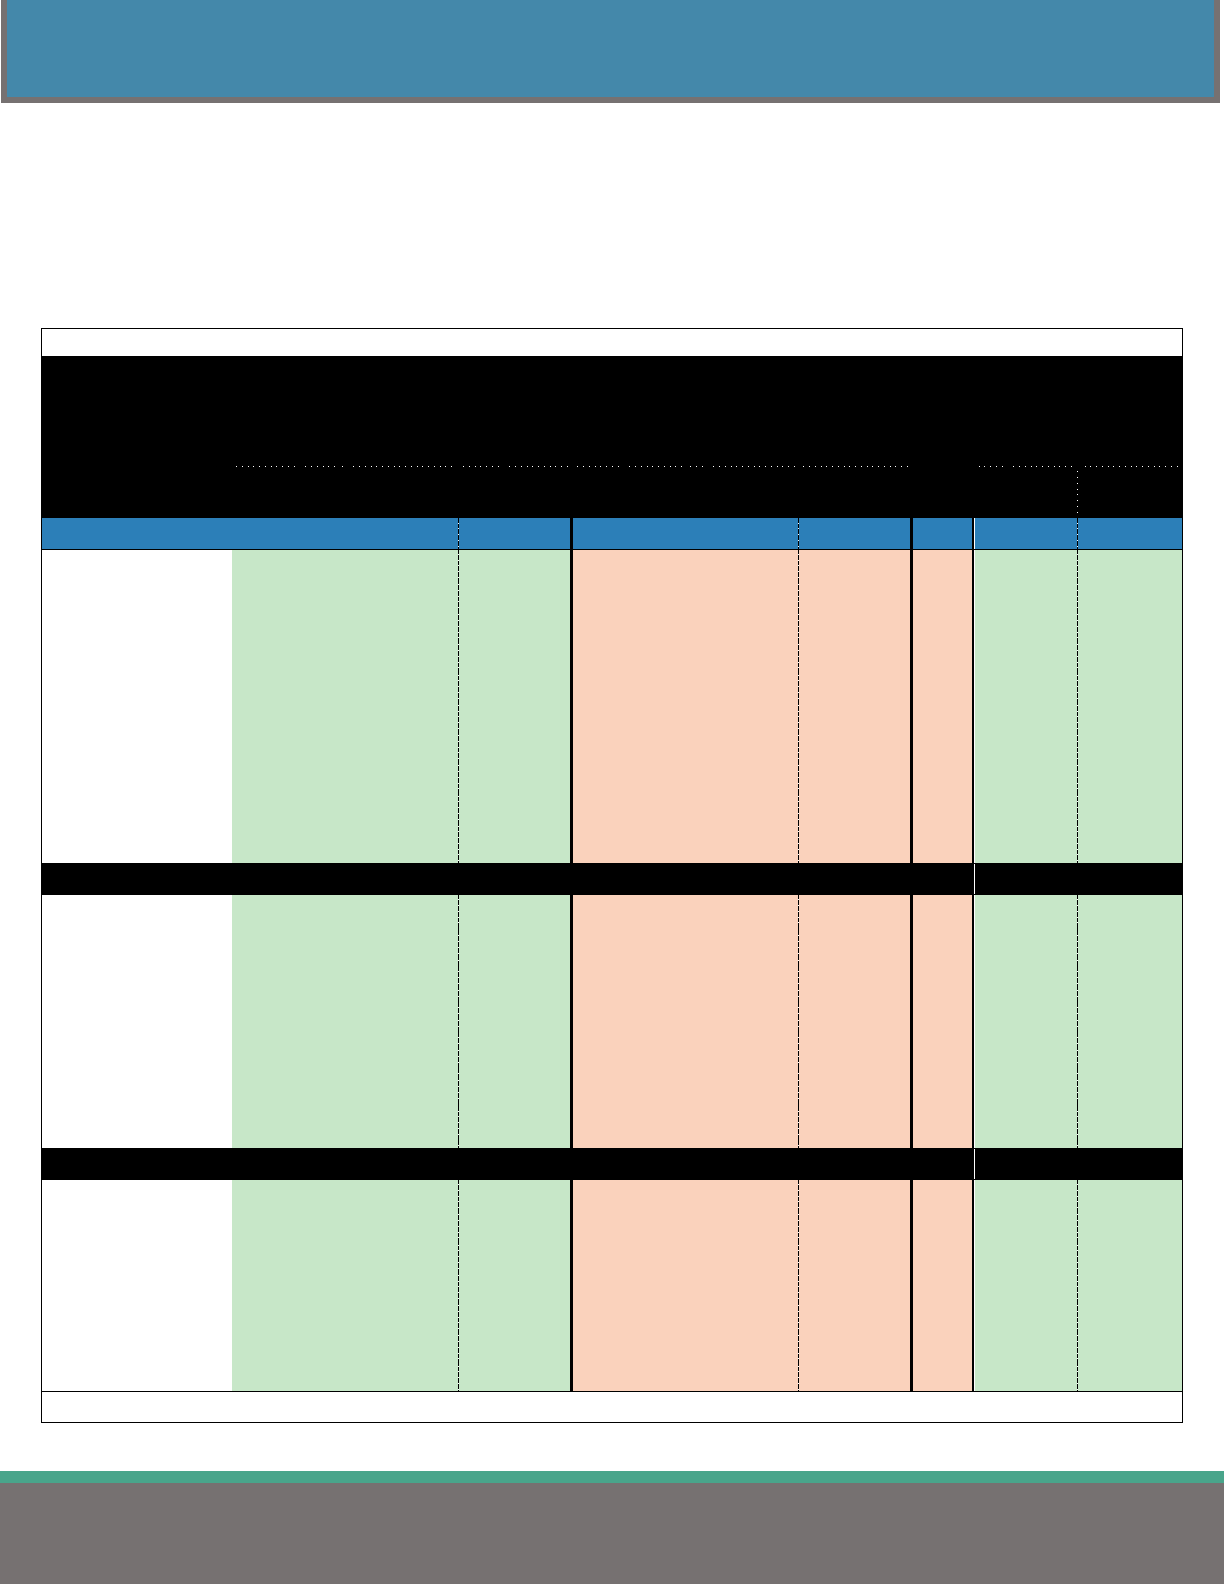
46
DENTAL INSURANCE
2023 HEALTH INSURANCE REPORT
DENTAL INSURANCE
DENTAL CARVE-OUT PREMIUMS
Table 39 displays the employer and employee dental premium contribution when purchased in a separate
plan. These costs are not included in the medical premium.
Table 39
Dental Carve-Out Premiums
Average Total Premium and Employer and Employee Share
Single
Family Single Family
Comparison Group
Employer
Share
Employee
Share
Total
Premium
Employer
Share
Employee
Share
Total
Premium
n
Employee
Share
Employee
Share
STATEWIDE $ 31.71 $ 6.78 $ 38.49 $ 85.44 $ 22.57 $ 108.01 892 19.2% 21.7%
State of Ohio $ 34.23 $ 0.00
$ 34.23 $ 99.19 $ 0.00
$ 99.19 1 0.0% 0.0%
Counties $ 13.78 $ 14.63 $ 28.41 $ 38.65 $ 50.13 $ 88.78 64 52.1% 55.3%
Cities $ 23.86 $ 7.28 $ 31.14 $ 70.15 $ 27.23 $ 97.38 154 25.6% 28.4%
Townships $ 29.01 $ 3.40 $ 32.41 $ 93.38 $ 14.61 $ 107.99 100 12.3% 13.5%
School Districts/ESCs $ 38.09 $ 6.01 $ 44.10 $ 95.76 $ 18.47 $ 114.23 485 13.4% 16.3%
Colleges & Univ. $ 28.60 $ 9.64 $ 38.24 $ 78.20 $ 31.28 $ 109.48 33 27.3% 28.1%
Fire Districts $ 24.80 $ 9.84 $ 34.64 $ 90.75 $ 22.54 $ 113.29 16 23.7% 18.9%
Metro Housing $ 24.42 $ 6.71 $ 31.13 $ 72.68 $ 27.53 $ 100.21 27 22.3% 28.0%
Port Authorities $ 29.76 $ 0.72 $ 30.48 $ 108.72 $ 2.67 $ 111.39 3 2.6% 2.5%
Regional Transit
Authorities
$ 25.95 $ 5.22 $ 31.17 $ 78.71 $ 19.00 $ 97.71 9 17.1% 18.3%
REGION
1 - Akron/Canton $ 46.84 $ 8.17 $ 55.01 $ 124.65 $ 24.12 $ 148.77 145 16.3% 16.6%
2 - Cincinnati $ 27.23 $ 5.06 $ 32.29 $ 78.23 $ 17.21 $ 95.44 105 17.1% 18.2%
3 - Cleveland $ 29.12 $ 4.77 $ 33.89 $ 83.04 $ 16.88 $ 99.92 144 15.6% 17.6%
4 - Columbus $ 31.51 $ 8.15 $ 39.66 $ 83.17 $ 24.37 $ 107.54 153 20.2% 22.5%
5 - Dayton $ 25.31 $ 7.85 $ 33.16 $ 66.21 $ 26.82 $ 93.03 131 26.4% 30.0%
6 - Southeast Ohio $ 30.19 $ 4.35 $ 34.54 $ 70.63 $ 20.54 $ 91.17 64 12.9% 23.1%
7 - Toledo $ 25.63 $ 10.14 $ 35.77 $ 71.75 $ 36.70 $ 108.45 83 30.9% 33.3%
8 – Warren
Youngstown
$ 33.44 $ 3.72 $ 37.16 $ 91.78 $ 11.51 $ 103.29 67 11.8% 12.4%
EMPLOYEES COVERED
1 - 49 $ 24.96 $ 7.02 $ 31.98 $ 77.95 $ 25.81 $ 103.76 189 22.8% 25.5%
50 - 99 $ 29.48 $ 6.93 $ 36.41 $ 82.59 $ 23.98 $ 106.57 141 23.4% 25.4%
100 - 149 $ 32.84 $ 7.63 $ 40.47 $ 85.83 $ 24.50 $ 110.33 155 19.2% 20.8%
150 - 249 $ 33.78 $ 7.50 $ 41.28 $ 86.74 $ 22.80 $ 109.54 163 18.9% 22.0%
250 - 499 $ 36.40 $ 5.91 $ 42.31 $ 92.10 $ 18.26 $ 110.36 143 14.3% 16.6%
500 - 999 $ 36.11 $ 5.14 $ 41.25 $ 93.55 $ 17.76 $ 111.31 62 14.1% 17.3%
1,000 or more $ 34.18 $ 4.43 $ 38.61 $ 85.98 $ 17.31 $ 103.29 39 14.0% 17.9%
Note: n: number of plans.

47
DENTAL INSURANCE
2023 HEALTH INSURANCE REPORT
DENTAL MAXIMUM BENEFIT – ALL PLAN TYPES
Table 40 displays the average annual dental maximum benefit. The data in this table includes all dental
plans reported regardless if they are in a separate carved-out plan.
Table 40
Average Annual Dental Maximum Benefit
All Dental Plans Offered
Comparison Group
Average
Minimum
Maximum
n
STATEWIDE
$ 1,687
$ 180
$ 4,000
1,205
State of Ohio $ 1,500 $ 1,500
$ 1,500 1
Counties $ 1,343 $ 180
$ 4,000 78
Cities $ 1,613 $ 750
$ 4,000 224
Townships $ 1,479 $ 475
$ 3,000 123
School Districts & ESCs $ 1,812 $ 600
$ 4,000 680
Colleges & Universities $ 1,577 $ 500
$ 3,000 36
Fire Districts $ 1,347 $ 1,000
$ 2,500 18
Metro Housing $ 1,579 $ 1,000
$ 4,000 32
Port Authorities $ 1,188 $ 1,000
$ 1,500 4
Regional Transit Authorities $ 1,344 $ 1,000
$ 2,000 9
REGION
1 – Akron/Canton $ 2,047 $ 180
$ 4,000 171
2 – Cincinnati $ 1,834 $ 500
$ 4,000 146
3 – Cleveland $ 1,812 $ 475
$ 4,000 183
4 – Columbus $ 1,584 $ 750
$ 4,000 216
5 – Dayton $ 1,359 $ 750
$ 4,000 152
6 – Southeast Ohio $ 1,404 $ 750
$ 3,000 95
7 – Toledo $ 1,638 $ 600
$ 4,000 150
8 – Warren/Youngstown $ 1,699 $ 750
$ 4,000 92
EMPLOYEES COVERED
1 – 49 $ 1,448 $ 180
$ 4,000 230
50 – 99 $ 1,604 $ 750
$ 4,000 206
100 – 149 $ 1,733 $ 600
$ 4,000 230
150 – 249 $ 1,727 $ 750
$ 4,000 242
250 – 499 $ 1,856 $ 750
$ 4,000 175
500 – 999 $ 1,958 $ 1,000
$ 3,300 76
1,000 or more $ 1,661 $ 500
$ 3,000 46
Note: Includes all dental plans offered.
Note: n: number of plans.
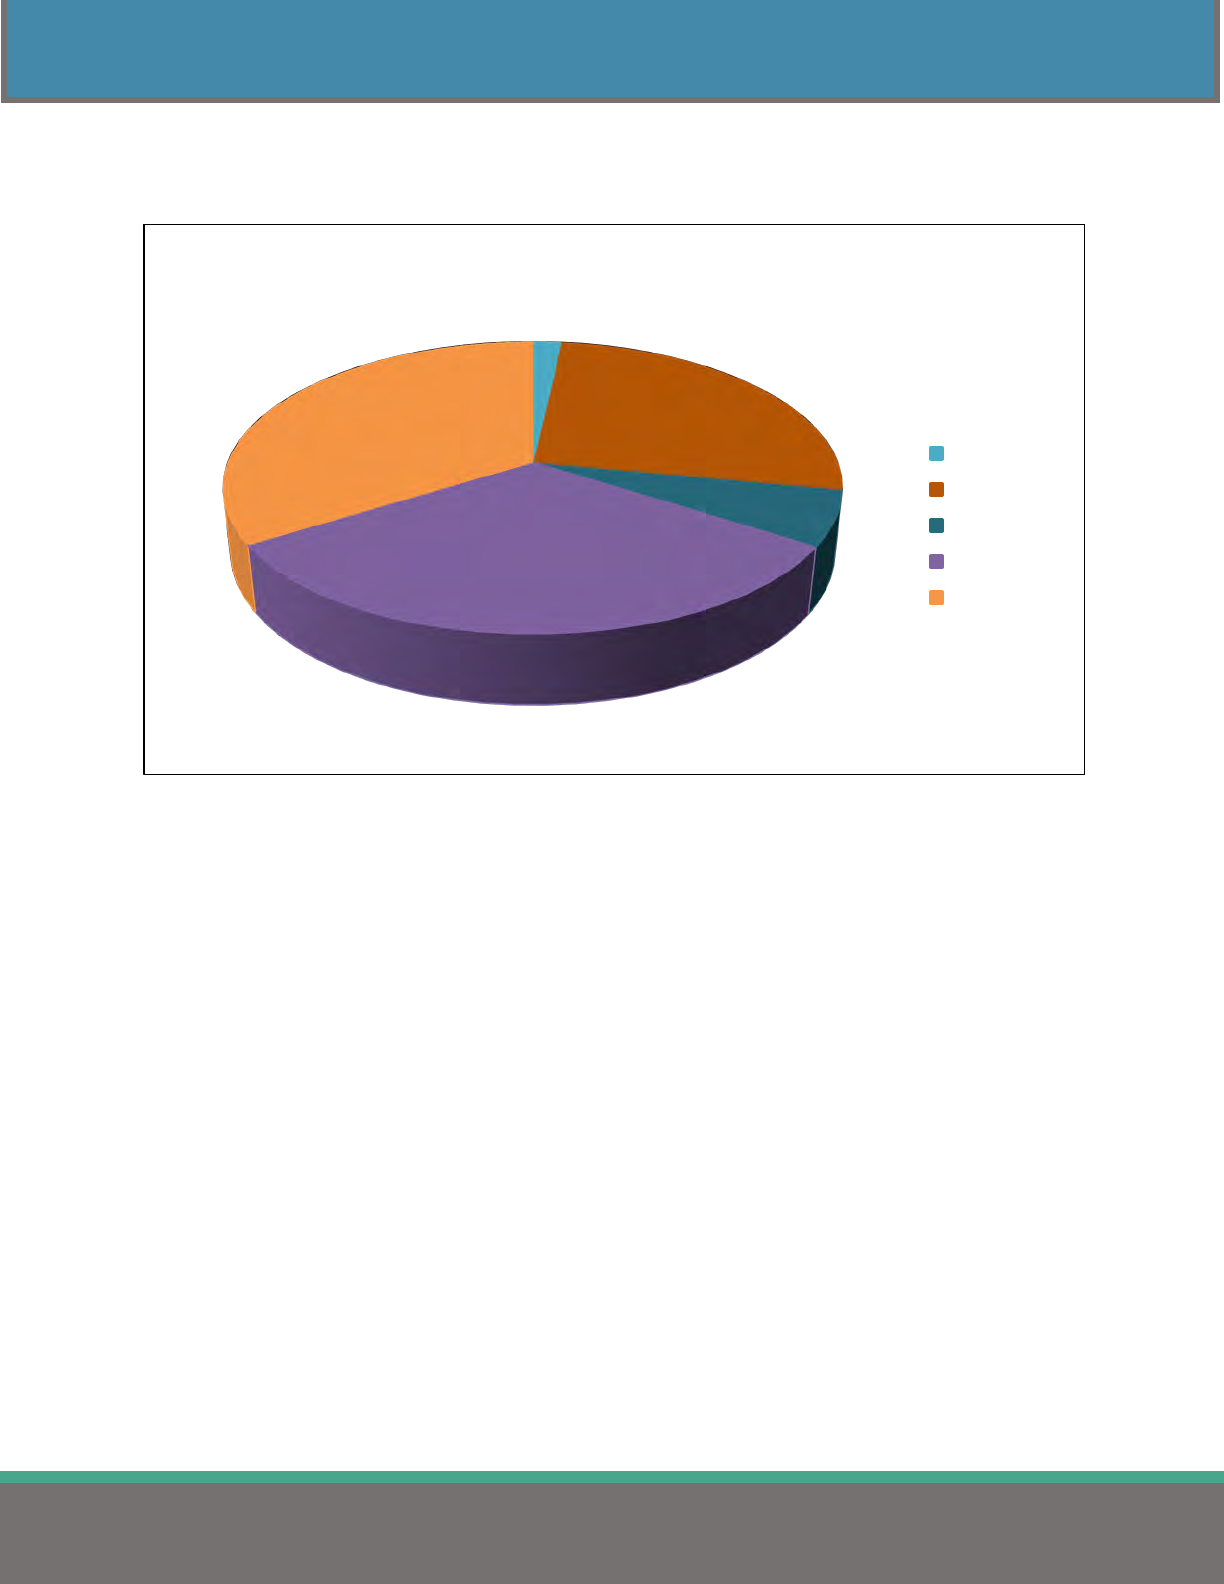
48
DENTAL INSURANCE
2023 HEALTH INSURANCE REPORT
Figure 17 displays the statewide average dental maximums by category. This figure includes the 1,205
dental plans reported in Table 40.
Figure 17
1.7%
26.3%
6.2%
31.9%
33.9%
Statewide Average Dental Maximum Categories
$250-$749
$750-$999
$1,000-$1,399
$1,400-$1,599
$1,600-$6,000

49
DENTAL INSURANCE
2023 HEALTH INSURANCE REPORT
DENTAL COMPOSITE RATES
Table 41 shows the average, minimum, and maximum dental composite rates. Composite rates are flat
insurance premium rates offered to the employees regardless of choosing single or family coverage.
Table 41
Dental Carve-Out Monthly Premiums
Average Composite Rate Total Premium
Comparison Group
Average
Minimum
Maximum
n
STATEWIDE $ 81.66
$ 3.05
$ 129.54 198
State of Ohio
-
-
-
0
Counties - - - 0
Cities $ 65.82
$ 5.26
$ 128.73 27
Townships $ 9.21
$ 9.21
$ 9.21 1
School Districts & ESCs $ 85.36
$ 41.04
$ 129.54 167
Colleges & Universities $ 64.44
$ 64.44
$ 64.44 1
Fire Districts $ 59.52
$ 59.52
$ 59.52 1
Metro Housing
$ 3.05
$ 3.05
$ 3.05
1
Port Authorities - - - 0
Regional Transit Authorities
-
-
-
0
REGION
1 - Akron/Canton $ 78.49
$ 56.00
$ 115.61
7
2 - Cincinnati $ 80.07
$ 10.00
$ 101.25
33
3 - Cleveland $ 62.93
$ 5.26
$ 93.75
15
4 - Columbus $ 82.84
$ 8.00
$ 113.72
47
5 - Dayton $ 93.50
$ 37.89
$ 129.54
16
6 - Southeast Ohio $ 68.74
$ 3.05
$ 128.73
24
7 - Toledo
$ 90.64
$ 56.00
$ 119.61
52
8 - Warren/Youngstown
$ 70.18
$ 59.52
$ 90.13
4
EMPLOYEES COVERED
1 - 49
$ 67.56
$ 3.05
$ 129.54
10
50 - 99 $ 80.48
$ 8.00
$ 129.54
41
100 - 149 $ 84.31
$ 10.00
$ 114.62
56
150 - 249 $ 84.30
$ 5.26
$ 128.73
53
250 - 499 $ 77.88
$ 41.04
$ 119.61
20
500 - 999 $ 83.36
$ 63.04
$ 102.64
12
1,000 or more $ 74.26
$ 57.90
$ 103.00
6
Note: Includes plans where the employee contributes $0 towards dental premium.
Note: n: number of plans.
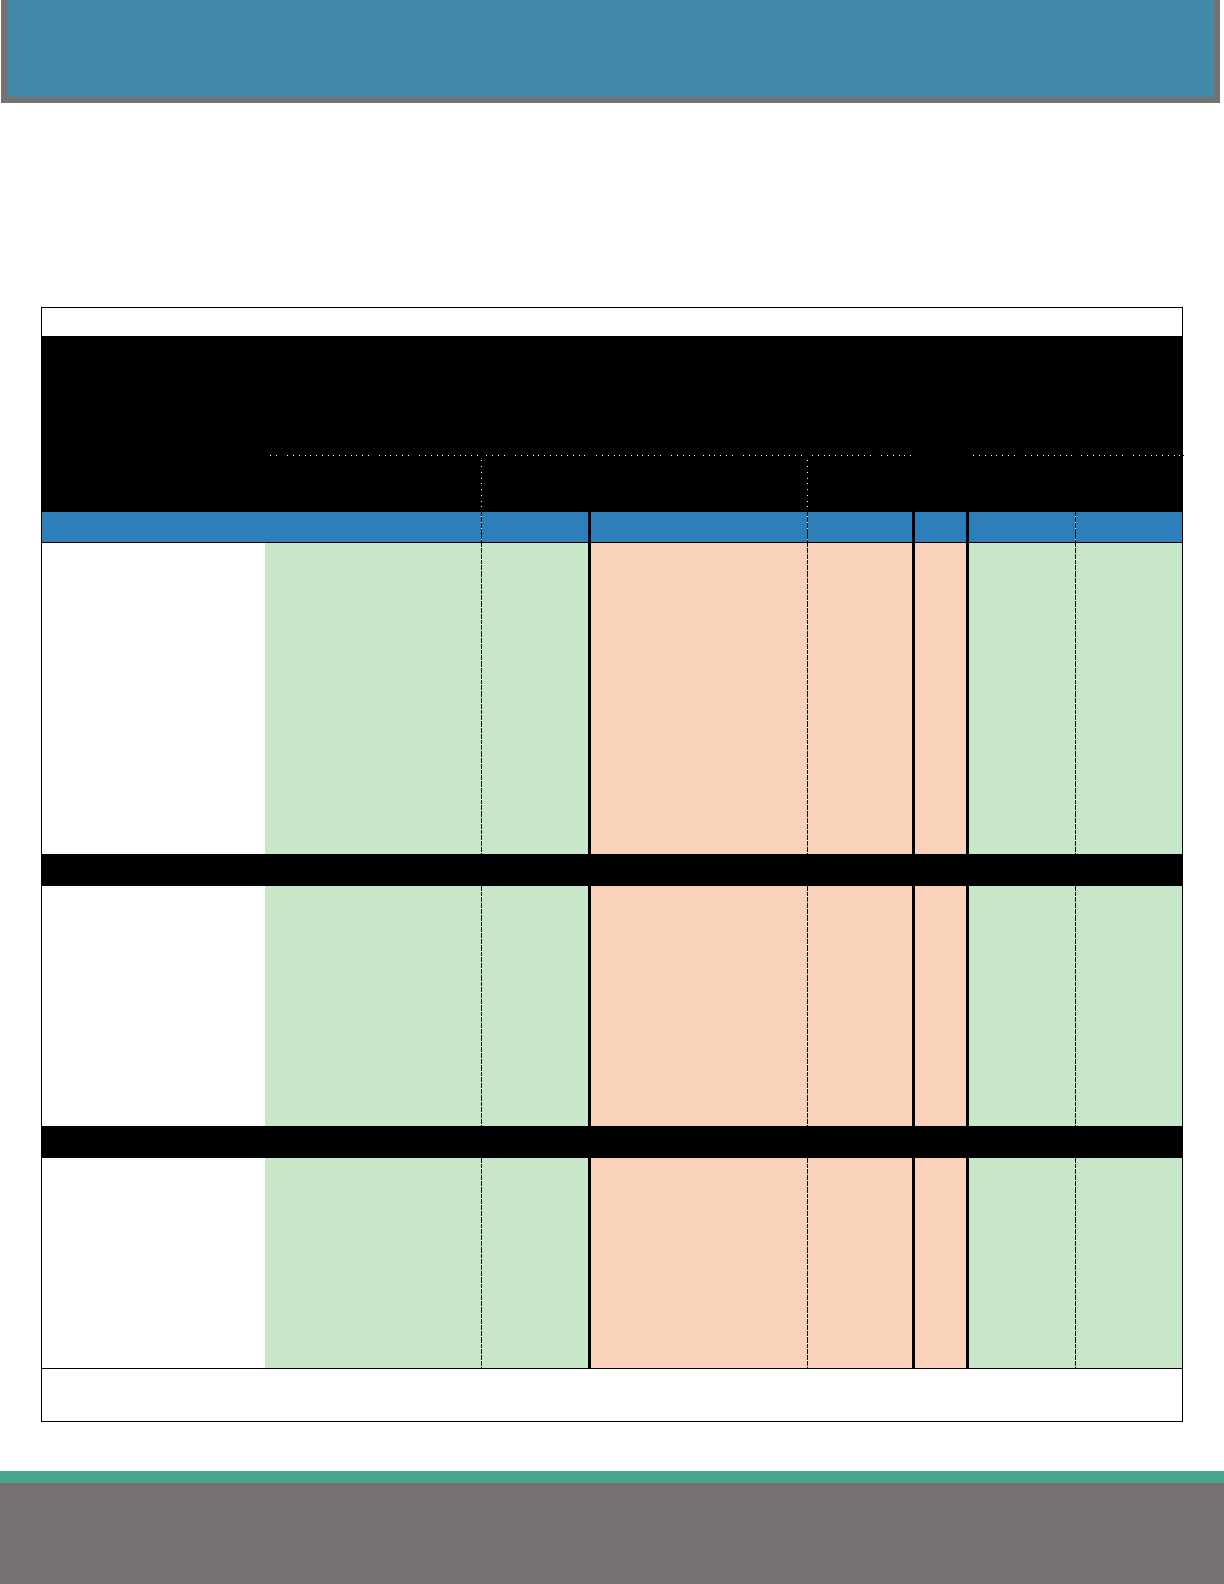
50
VISION INSURANCE
2023 HEALTH INSURANCE REPORT
VISION INSURANCE
VISION CARVE-OUT PREMIUMS
Table 42 shows the employer and employee vision premiums when purchased in a separate plan. These
costs are not included in the medical premium.
Table 42
Vision Carve-Out Monthly Premiums
Average Total Premium and Employer and Employee Share
Single
Family
Single
Family
Comparison Group
Employer
Share
Employee
Share
Total
Premium
Employer
Share
Employee
Share
Total
Premium
n
Employee
Share
Employee
Share
STATEWIDE $ 5.26 $ 3.40 $ 8.66 $ 13.06 $ 9.57 $ 22.63 886 40.3% 42.6%
State of Ohio $ 10.04 $ 0.00
$ 10.04 $ 27.61 $ 0.00
$ 27.61 1 0.0% 0.0%
Counties $ 3.52 $ 4.36 $ 7.88 $ 8.74 $ 12.27 $ 21.01 56 55.0% 56.7%
Cities $ 3.91 $ 3.54 $ 7.45 $ 10.51 $ 10.43 $ 20.94 141 49.0% 49.1%
Townships $ 7.03 $ 1.65 $ 8.68 $ 21.31 $ 5.74 $ 27.05 78 23.5% 27.0%
School Districts & ESCs $ 5.72 $ 3.47 $ 9.19 $ 13.43 $ 9.34 $ 22.77 533 38.5% 40.9%
Colleges & Universities $ 3.23 $ 4.50 $ 7.73 $ 7.50 $ 13.04 $ 20.54 31 52.6% 56.6%
Fire Districts $ 4.81 $ 4.72 $ 9.53 $ 14.35 $ 18.10 $ 32.45 11 39.5% 48.6%
Metro Housing Authorities $ 5.79 $ 2.10 $ 7.89 $ 13.76 $ 7.40 $ 21.16 25 27.5% 33.3%
Port Authorities $ 1.59 $ 4.53 $ 6.12 $ 4.42 $ 12.15 $ 16.57 3 72.0% 72.0%
Regional Transit
Authorities
$ 2.25 $ 2.87 $ 5.12 $ 5.00 $ 8.17 $ 13.17 7 39.8% 47.4%
REGION
1 - Akron/Canton $ 7.31 $ 3.45 $ 10.76 $ 18.27 $ 9.89 $ 28.16 108 35.4% 37.8%
2 - Cincinnati $ 3.08 $ 4.37 $ 7.45 $ 8.18 $ 12.08 $ 20.26 115 59.5% 60.6%
3 - Cleveland $ 5.85 $ 1.85 $ 7.70 $ 15.02 $ 5.75 $ 20.77 132 23.8% 25.9%
4 - Columbus $ 5.23 $ 4.34 $ 9.57 $ 13.04 $ 12.19 $ 25.23 159 46.1% 49.4%
5 - Dayton $ 4.02 $ 4.13 $ 8.15 $ 10.11 $ 10.72 $ 20.83 127 52.9% 53.1%
6 - Southeast Ohio $ 6.80 $ 3.01 $ 9.81 $ 15.12 $ 9.35 $ 24.47 67 27.2% 34.0%
7 - Toledo $ 5.12 $ 3.50 $ 8.62 $ 11.98 $ 9.64 $ 21.62 115 41.6% 43.1%
8 - Warren/Youngstown $ 5.72 $ 1.01 $ 6.73 $ 14.89 $ 3.39 $ 18.28 63 18.8% 21.7%
EMPLOYEES COVERED
1 - 49 $ 6.10 $ 2.80 $ 8.90 $ 17.07 $ 8.77 $ 25.84 152 32.6% 35.1%
50 - 99 $ 5.38 $ 3.17 $ 8.55 $ 13.61 $ 8.67 $ 22.28 148 39.3% 39.9%
100 - 149 $ 5.35 $ 3.47 $ 8.82 $ 12.71 $ 9.66 $ 22.37 170 39.1% 41.7%
150 - 249 $ 5.56 $ 3.32 $ 8.88 $ 12.93 $ 9.08 $ 22.01 184 39.8% 42.8%
250 - 499 $ 5.18 $ 3.75 $ 8.93 $ 12.32 $ 10.64 $ 22.96 138 42.6% 45.5%
500 - 999 $ 2.66 $ 4.46 $ 7.12 $ 6.84 $ 11.72 $ 18.56 54 57.6% 58.0%
1,000 or more $ 3.78 $ 3.81 $ 7.59 $ 9.20 $ 11.16 $ 20.36 40 48.9% 51.0%
Note: Includes plans where employees contribute $0 to the medical premium.
Note: n: number of plans.

51
VISION INSURANCE
2023 HEALTH INSURANCE REPORT
VISION COMPOSITE RATES
Table 43 shows the average, minimum, and maximum vision composite rates. Composite rates are flat
insurance premium rates offered to the employees regardless of choosing single or family coverage.
Table 43
Vision Carve-Out Monthly Premiums
Average Composite Rate Total Premium
Comparison Group
Average
Minimum
Maximum
n
STATEWIDE
$ 19.81
$ 1.65
$ 65.00
82
State of Ohio - - - 0
Counties - - - 0
Cities $ 18.93 $ 1.65
$ 27.80
17
Townships $ 23.06 $ 4.80
$ 65.00
15
School Districts & ESCs $ 19.00 $ 6.65
$ 47.00
47
Colleges & Universities $ 20.36 $ 20.36
$ 20.36
1
Fire Districts $ 20.74 $ 14.16
$ 27.33
2
Metro Housing - - - 0
Port Authorities - - - 0
Regional Transit Authorities - - - 0
REGION
1 - Akron/Canton $ 18.08 $ 6.75
$ 35.12
9
2 - Cincinnati $ 16.06 $ 6.65
$ 27.33
13
3 - Cleveland $ 21.70 $ 11.27
$ 37.00
5
4 - Columbus $ 19.21 $ 4.80
$ 27.80
32
5 - Dayton $ 14.30 $ 1.65
$ 22.91
3
6 - Southeast Ohio $ 25.60 $ 14.22
$ 65.00
13
7 - Toledo $ 24.98 $ 17.84
$ 46.59
5
8 - Warren/Youngstown $ 8.23 $ 8.23
$ 8.23
2
EMPLOYEES COVERED
1 - 49 $ 24.23 $ 13.33
$ 65.00
17
50 - 99 $ 16.11 $ 1.65
$ 35.12
16
100 - 149 $ 21.49 $ 6.65
$ 47.00
21
150 - 249 $ 18.97 $ 6.75
$ 27.80
13
250 - 499 $ 19.71 $ 14.22
$ 37.00
10
500 - 999 $ 11.33 $ 7.04
$ 15.44
3
1,000 or more $ 14.54 $ 11.27
$ 17.81
2
Note: Includes plans where the employee contributes $0 towards vision premium.
Note: n: number of plans.

52
LIFE INSURANCE
2023 HEALTH INSURANCE REPORT
LIFE INSURANCE
Table 44 shows the average total monthly premium of life insurance per $1,000 of coverage.
Table 44
Average Total Monthly Life Insurance Premium
per $1,000 of Coverage
Comparison Group
Amount
n
STATEWIDE $ 0.17 1,195
State of Ohio
$ 0.12
1
Counties
$ 0.17
77
Cities
$ 0.22
227
Townships
$ 0.31
116
School Districts & ESCs
$ 0.13
675
Colleges & Universities
$ 0.12
36
Fire Districts
$ 0.21
15
Metro Housing
$ 0.34
33
Port Authorities
$ 0.13
4
Regional Transit Authorities
$ 0.35
11
REGION
1 - Akron/Canton
$ 0.17
170
2 - Cincinnati
$ 0.16
145
3 - Cleveland
$ 0.18
177
4 - Columbus
$ 0.19
214
5 - Dayton
$ 0.14
151
6 - Southeast Ohio
$ 0.17
95
7 - Toledo
$ 0.16
149
8 - Warren/Youngstown
$ 0.22
94
EMPLOYEES COVERED
1 - 49
$ 0.28
224
50 - 99
$ 0.18
203
100 - 149
$ 0.16
228
150 - 249
$ 0.14
242
250 - 499
$ 0.14
176
500 - 999
$ 0.13
76
1,000 or more
$ 0.12
46
Note: n: number of plans.

53
COST SAVINGS
2023 HEALTH INSURANCE REPORT
COST SAVINGS
CONSORTIUMS
A health insurance consortium is an association of employers who purchase health insurance at a group
rate. Consortiums spread out the cost of administration and can assist with obtaining better discounts by
increasing the risk pool.
Table 45 shows the variation in average medical insurance costs for consortium members versus non-
members. The average monthly premium cost per employee for consortium members tends to be less than
employers who do not belong to a consortium.
Table 45
Average Total Monthly Premium Cost
By Consortium Membership
Consortium
Member
Consortium
Non-Member
Single $ 812.94 $ 815.43
Family $ 2,128.39 $ 2,184.88
Number of plans (n) 1,290 703
Note: Consortium examples: joint purchasing arrangement, council of government, cooperative, and multiple employer
welfare agreement (MEWA).
Note: Excludes carved-out prescription premiums.
Note: n: number of plans.
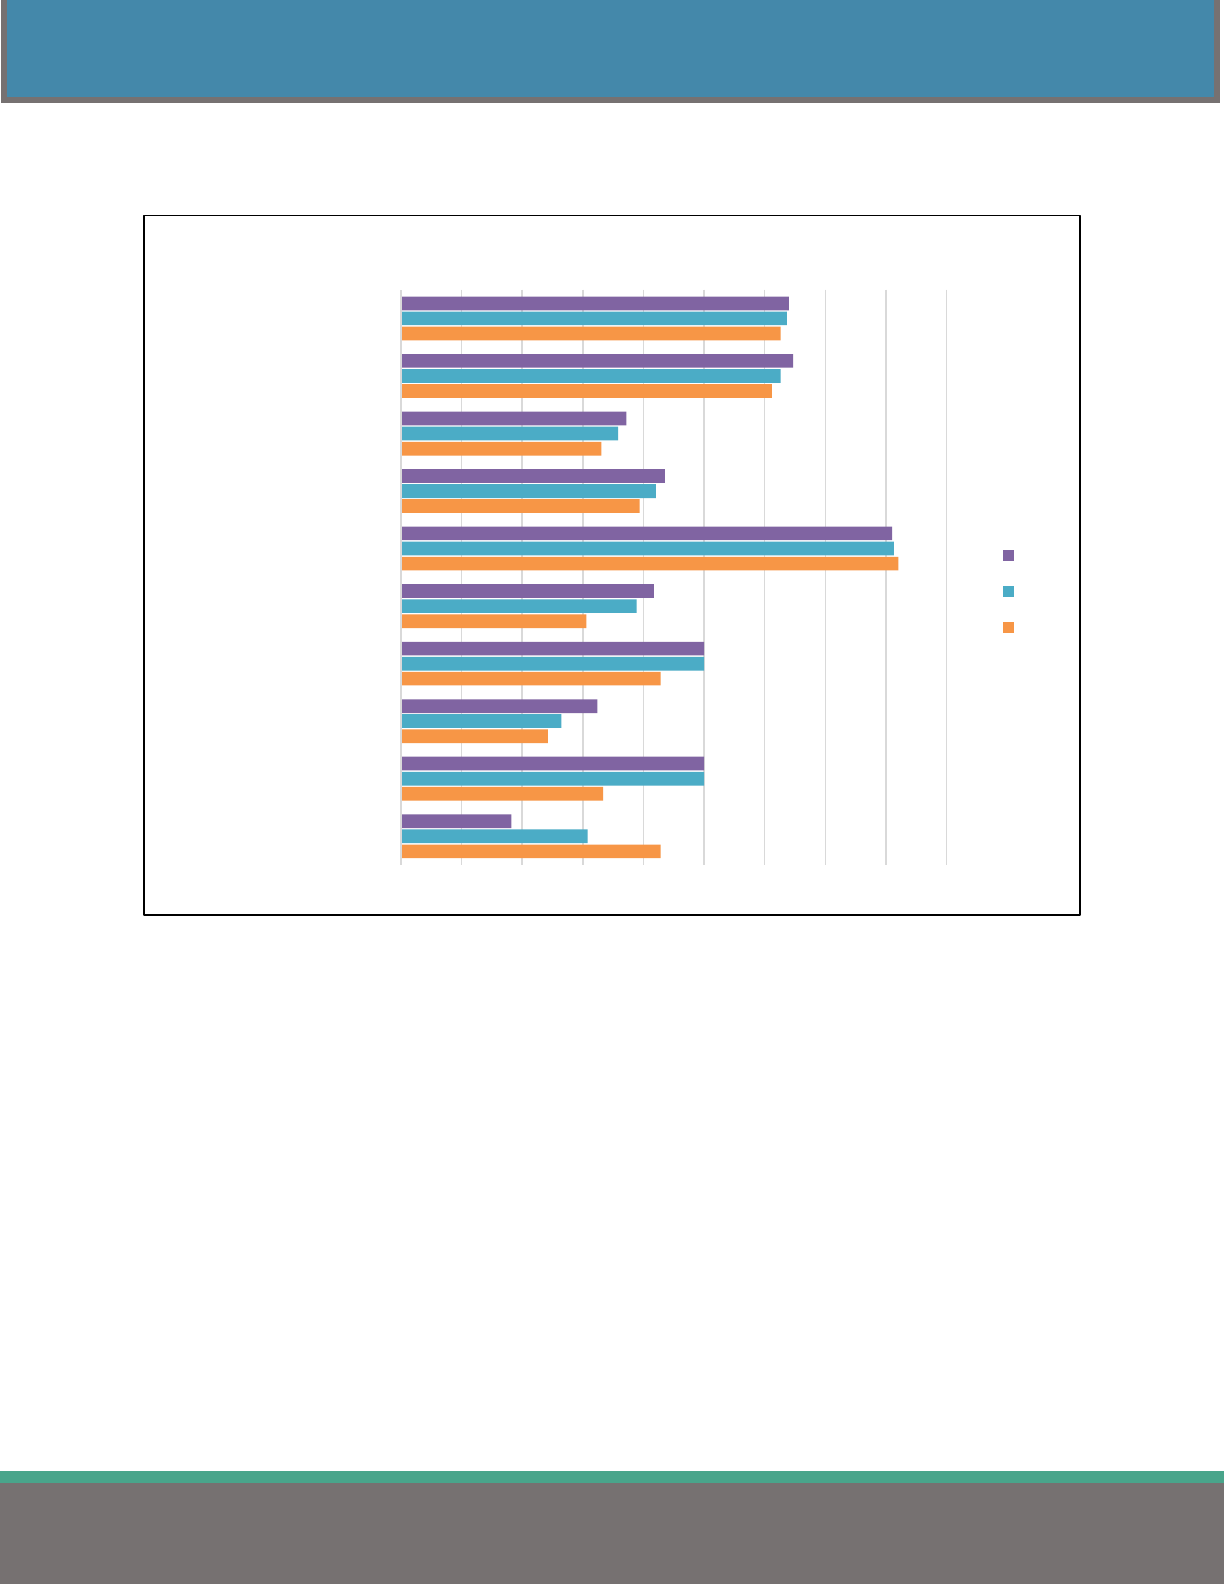
54
COST SAVINGS
2023 HEALTH INSURANCE REPORT
Figure 18 illustrates the wide variations in consortium membership by jurisdiction.
Figure 18
School districts continue to have the highest consortia membership. Joint purchasing was part of
the School Employee’s Health Care Board’s “Best Practices,” explaining the much higher
frequency of consortium membership for school districts and educational service centers.
18.2%
50.0%
32.4%
50.0%
41.7%
81.0%
43.5%
37.2%
64.7%
64.0%
0.0% 10.0% 20.0% 30.0% 40.0% 50.0% 60.0% 70.0% 80.0% 90.0%
Regional Transit Authorities
Port Authorities
Metro Housing Authorities
Fire Districts
Colleges & Universities
School Districts & ESCs
Townships
Cities
Counties
STATEWIDE
Percent of Employers Belonging to Consortiums
2023
2022
2021
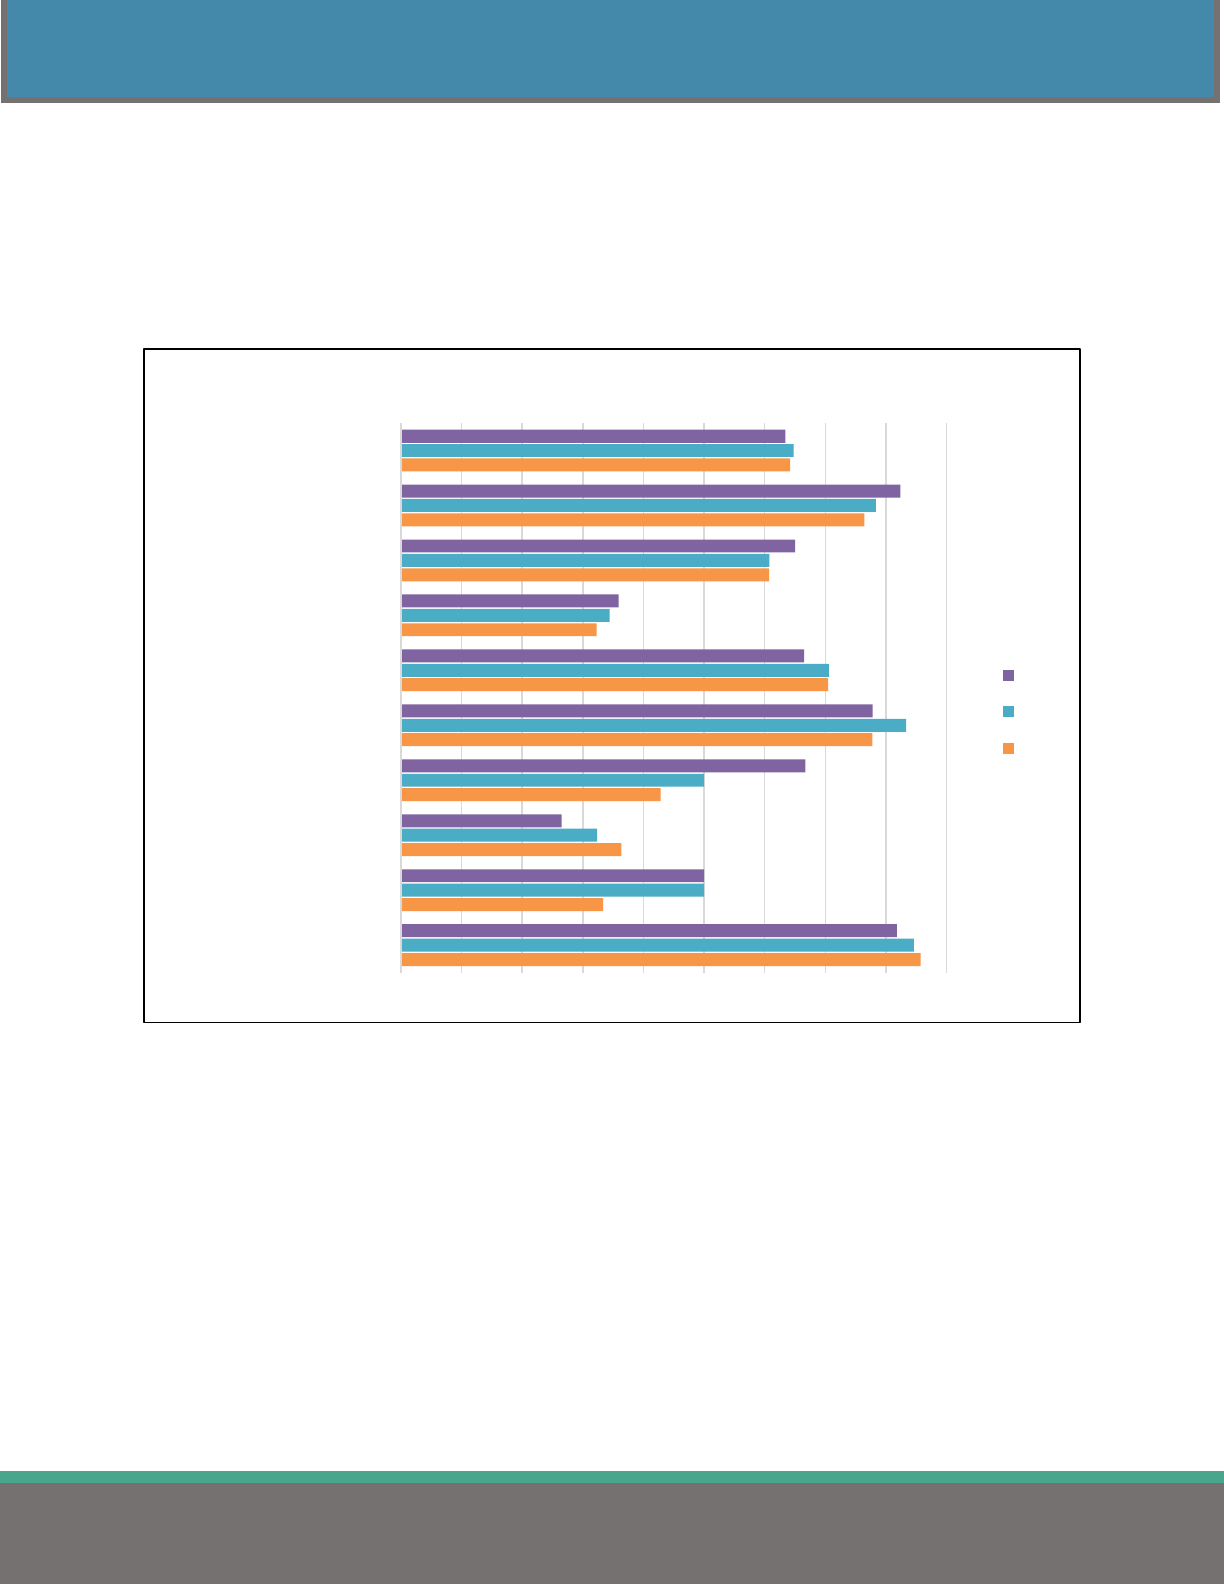
55
COST SAVINGS
2023 HEALTH INSURANCE REPORT
WORKSITE WELLNESS PROGRAMS
Worksite wellness programs are outreach initiatives that focus on reducing health care costs by
encouraging employees to adopt healthier behaviors. These programs are usually separate from the
medical plan. Figure 19 shows the number of employers offering a worksite wellness plan over the past
three years.
Figure 19
81.8%
50.0%
26.5%
66.7%
77.8%
66.5%
35.9%
65.0%
82.4%
63.4%
0.0% 10.0% 20.0% 30.0% 40.0% 50.0% 60.0% 70.0% 80.0% 90.0%
Regional Transit Authorities
Port Authorities
Metro Housing Authorities
Fire Districts
Colleges & Universities
School Districts & ESCs
Townships
Cities
Counties
STATEWIDE
Percent of Employers with Worksite Wellness Program
2023
2022
2021
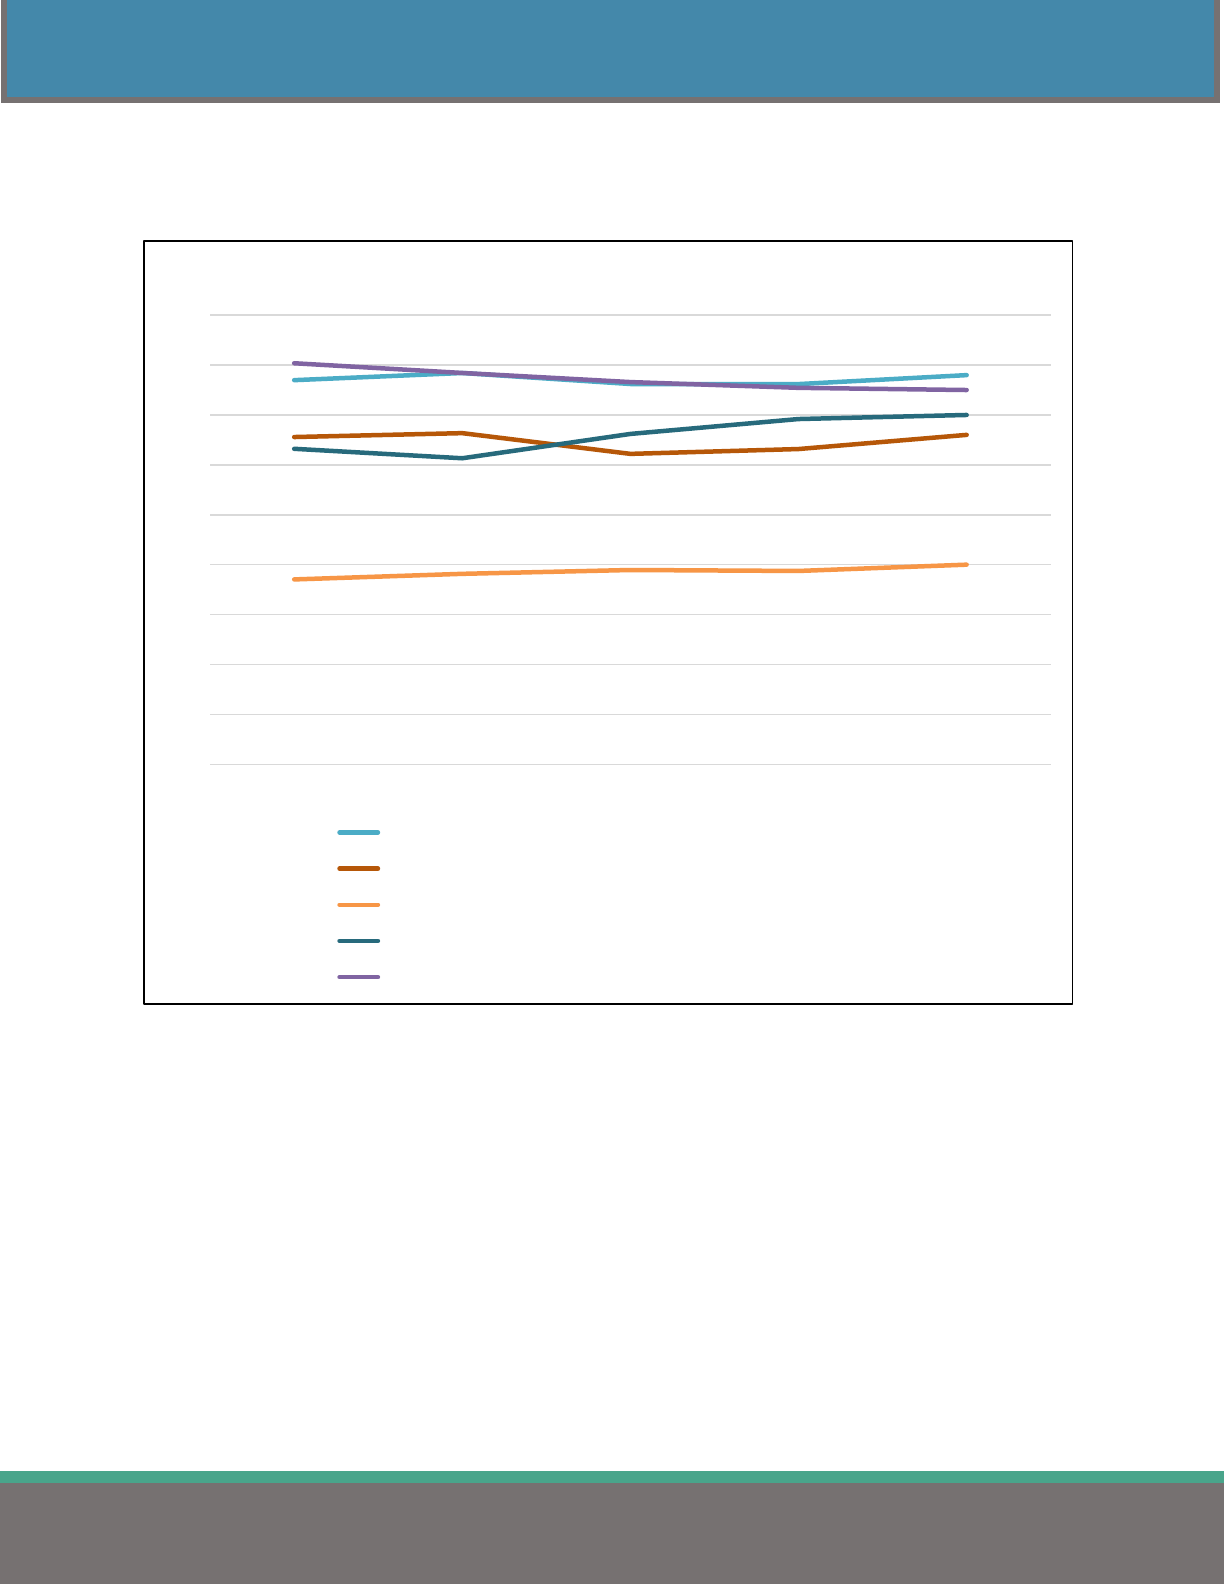
56
COST SAVINGS
2023 HEALTH INSURANCE REPORT
Figure 20 highlights the various worksite wellness components offered by the 63.4% of employers
outlined in Figure 19 and their implementation rates over the last five years.
Figure 20
Health Education is one of the more frequently used wellness components (78%). This includes
counseling or training opportunities for physical activity and workplace injury prevention.
Supportive Social & Physical Work Environment (66%) typically includes policies against
tobacco use and classes or counseling on nutrition and fitness.
Integration of Worksite Program into Organization’s Structure (40%) involves the appointments
of dedicated staff to the program and/or the allocation of budget support.
Related Programs (70%) encompass employee assistance, work/life balance focus, and
occupational safety and health programs.
Screening Programs have also become a popular form of worksite wellness programs (75%).
These programs include blood pressure and blood cholesterol screenings.
0%
10%
20%
30%
40%
50%
60%
70%
80%
90%
2019 2020 2021 2022 2023
Frequency of Statewide Wellness Program Components
Health Education
Supportive Social & Physical Work Environment
Integration of Worksite Program into Organization's Structure
Related Programs
Screening Programs
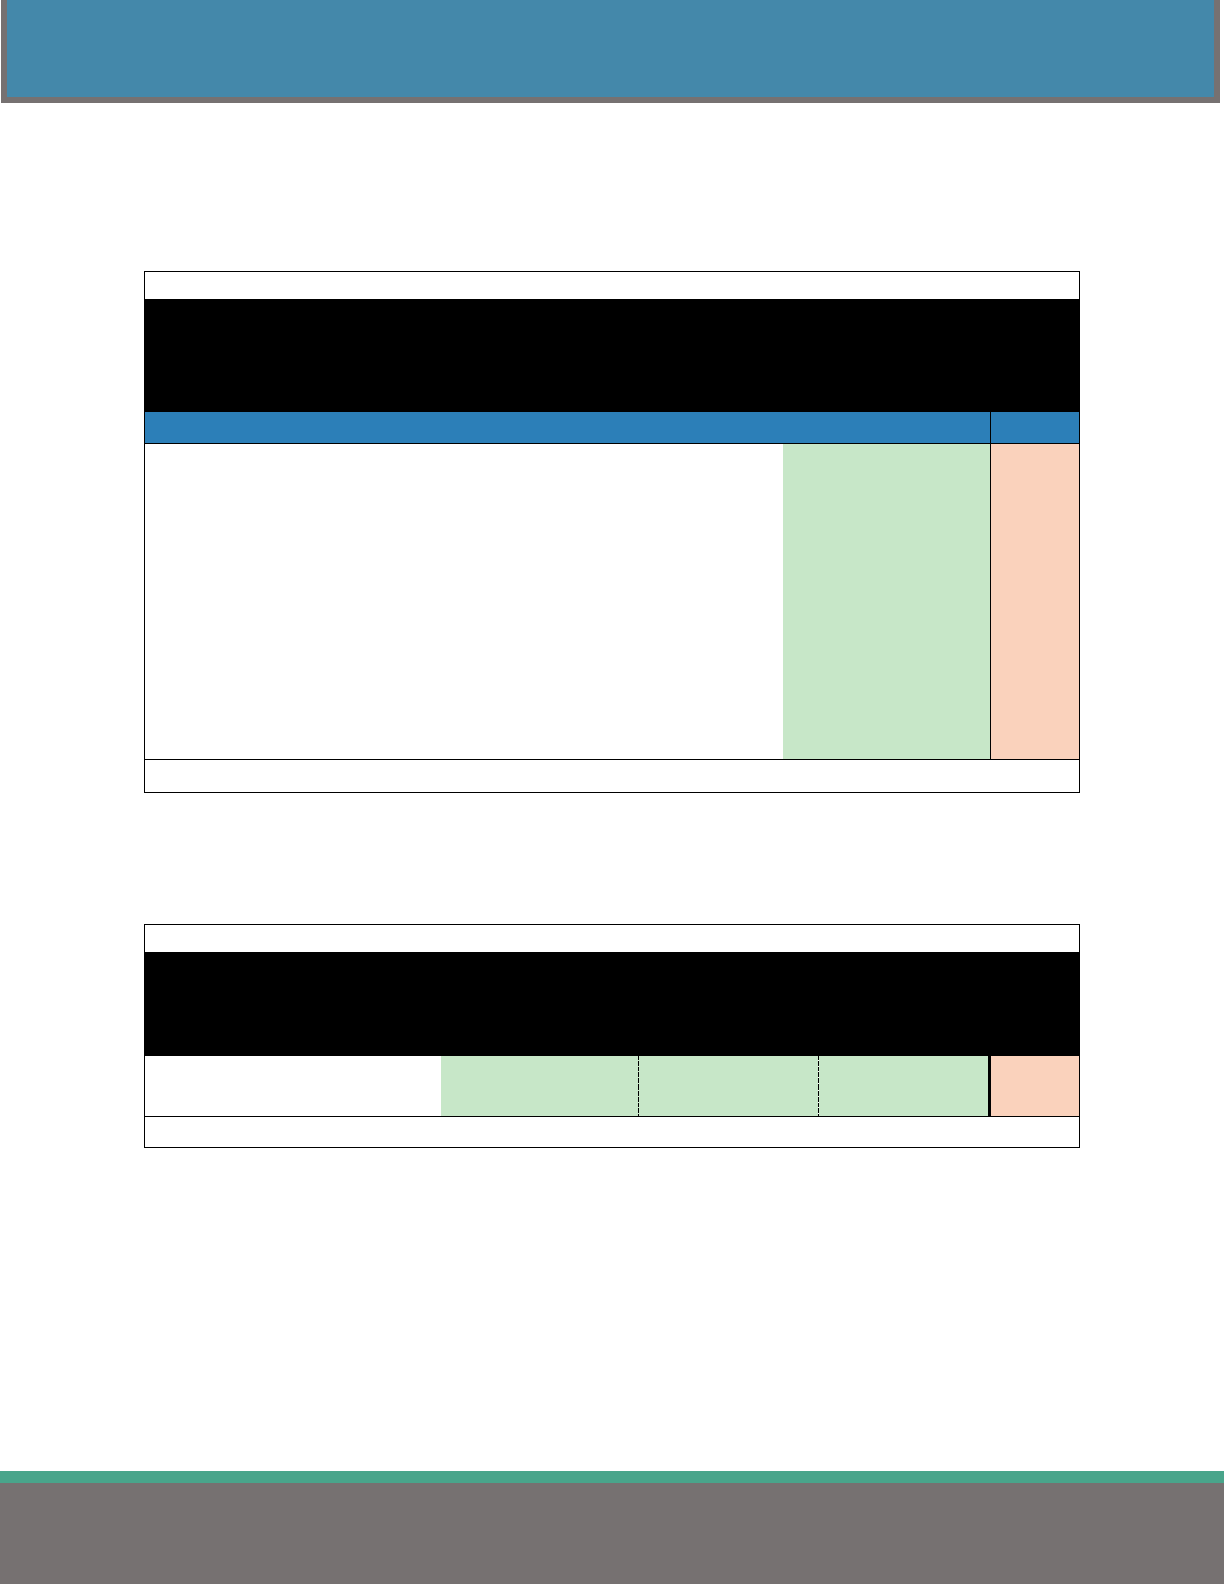
57
COST SAVINGS
2023 HEALTH INSURANCE REPORT
OPT-OUT INCENTIVES
Table 46 shows the average number of employers offering opt-out monetary incentives to employees who
waive medical coverage by jurisdiction.
Table 46
Opt-Out Incentive Offered by Jurisdiction
Comparison Group
Employers Offering
Opt-Out Incentive
n
STATEWIDE 47.3% 1,238
State of Ohio 0.0% 1
Counties 24.7% 85
Cities 52.6% 234
Townships 30.5% 131
School Districts & ESCs 53.2% 684
Colleges & Universities 33.3% 36
Fire Districts 44.4% 18
Metro Housing Authorities 32.4% 34
Port Authorities 50.0% 4
Regional Transit Authorities 45.5% 11
Note: n: number of employers.
Table 47 highlights the average, minimum, and maximum incentive amount offered to employees for
single and family plans. The incentive amount may vary depending on whether the person is eligible for
single or family coverage.
Table 47
Incentive Offered to Employees for Opting Out of Medical Coverage
Opt-Out
Type
Average
Incentive
Minimum
Incentive
Maximum
Incentive
n
Single $ 1,990.99 $ 200.00 $ 11,800.00
553
Family $ 2,916.97 $ 200.00 $ 12,855.00
553
Note: n: number of employers.
This year’s insurance survey submissions reported that 21,989 public employees across the state
accepted the employer-offered incentive to opt out of medical coverage.
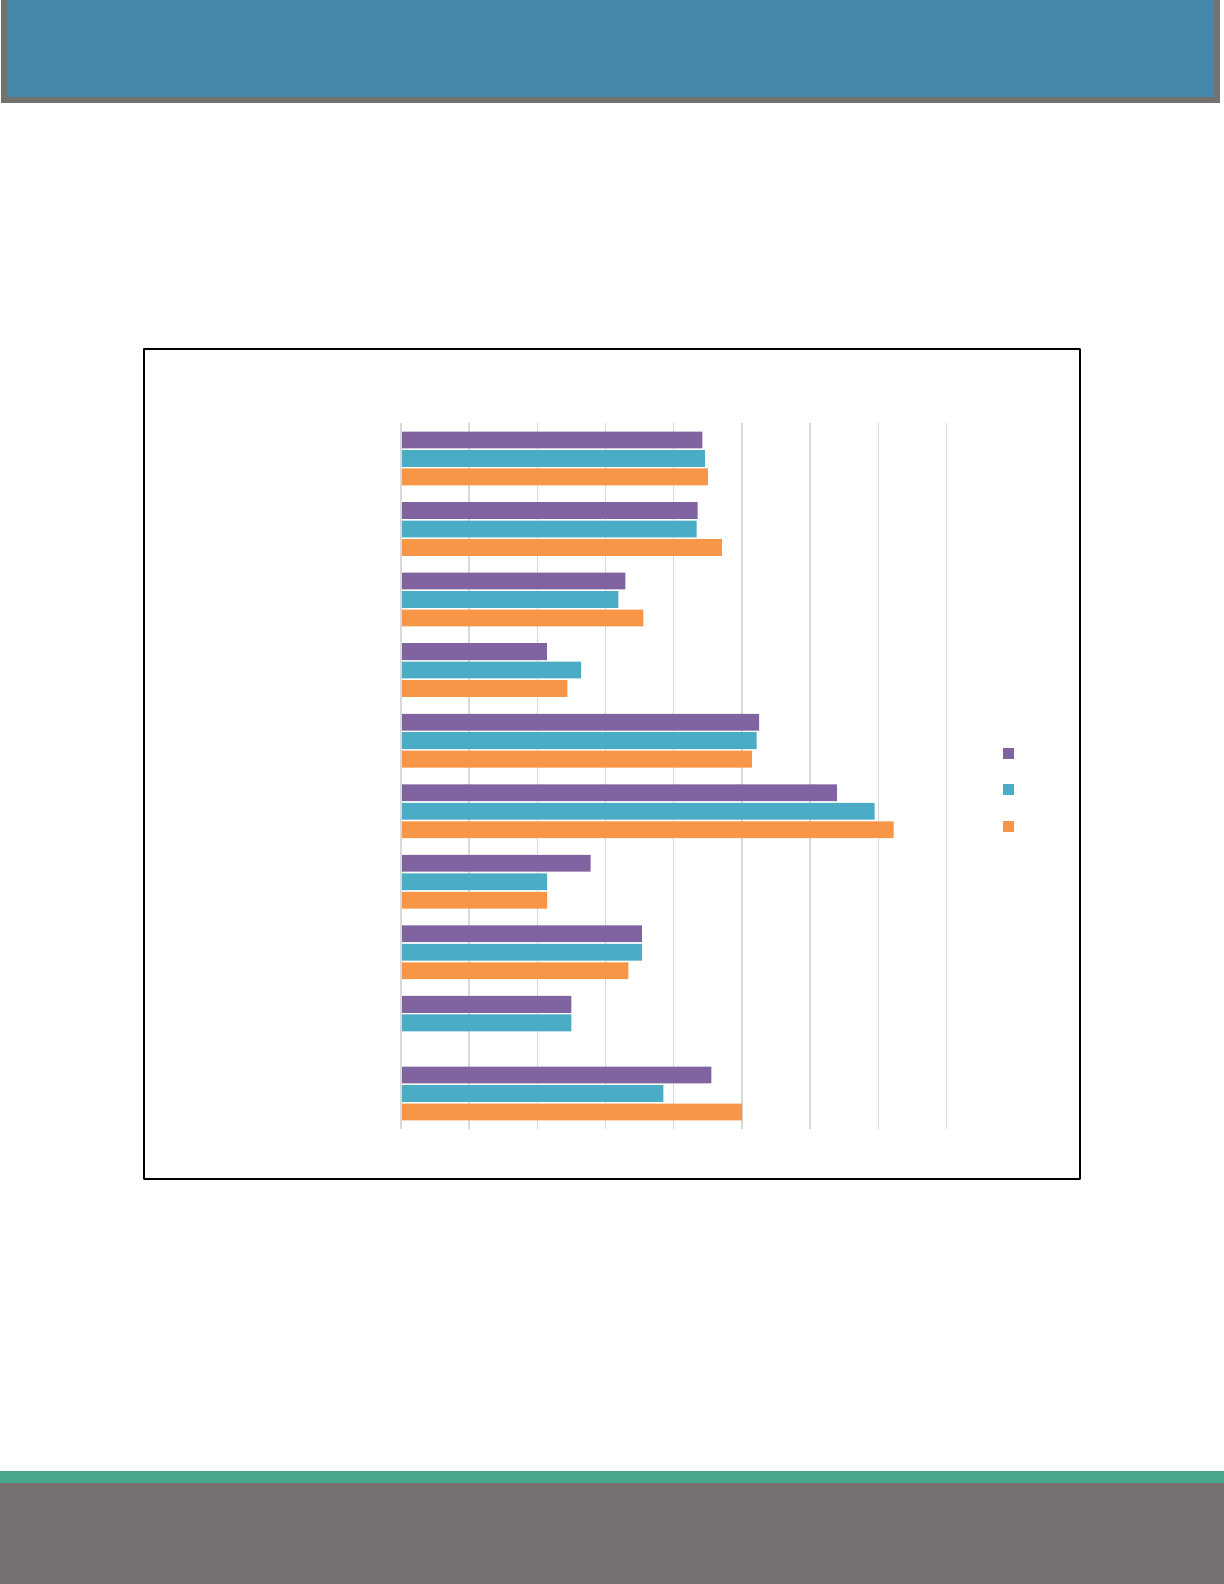
58
COST SAVINGS
2023 HEALTH INSURANCE REPORT
SPOUSAL RESTRICTIONS
Over 44% of employers who completed the survey reported having a spousal stipulation for employees
whose spouses have other means of acquiring medical coverage.
Figure 21 highlights the percentage of employers with a spousal restriction by jurisdiction.
Figure 21
45.5%
25.0%
35.3%
27.8%
63.9%
52.5%
21.4%
32.9%
43.5%
44.2%
0.0% 10.0% 20.0% 30.0% 40.0% 50.0% 60.0% 70.0% 80.0%
Regional Transit Authorities
Port Authorities
Metro Housing Authorities
Fire Districts
Colleges & Universities
School Districts & ESCs
Townships
Cities
Counties
STATEWIDE
Spousal Restrictions by Jurisdiction
2023
2022
2021
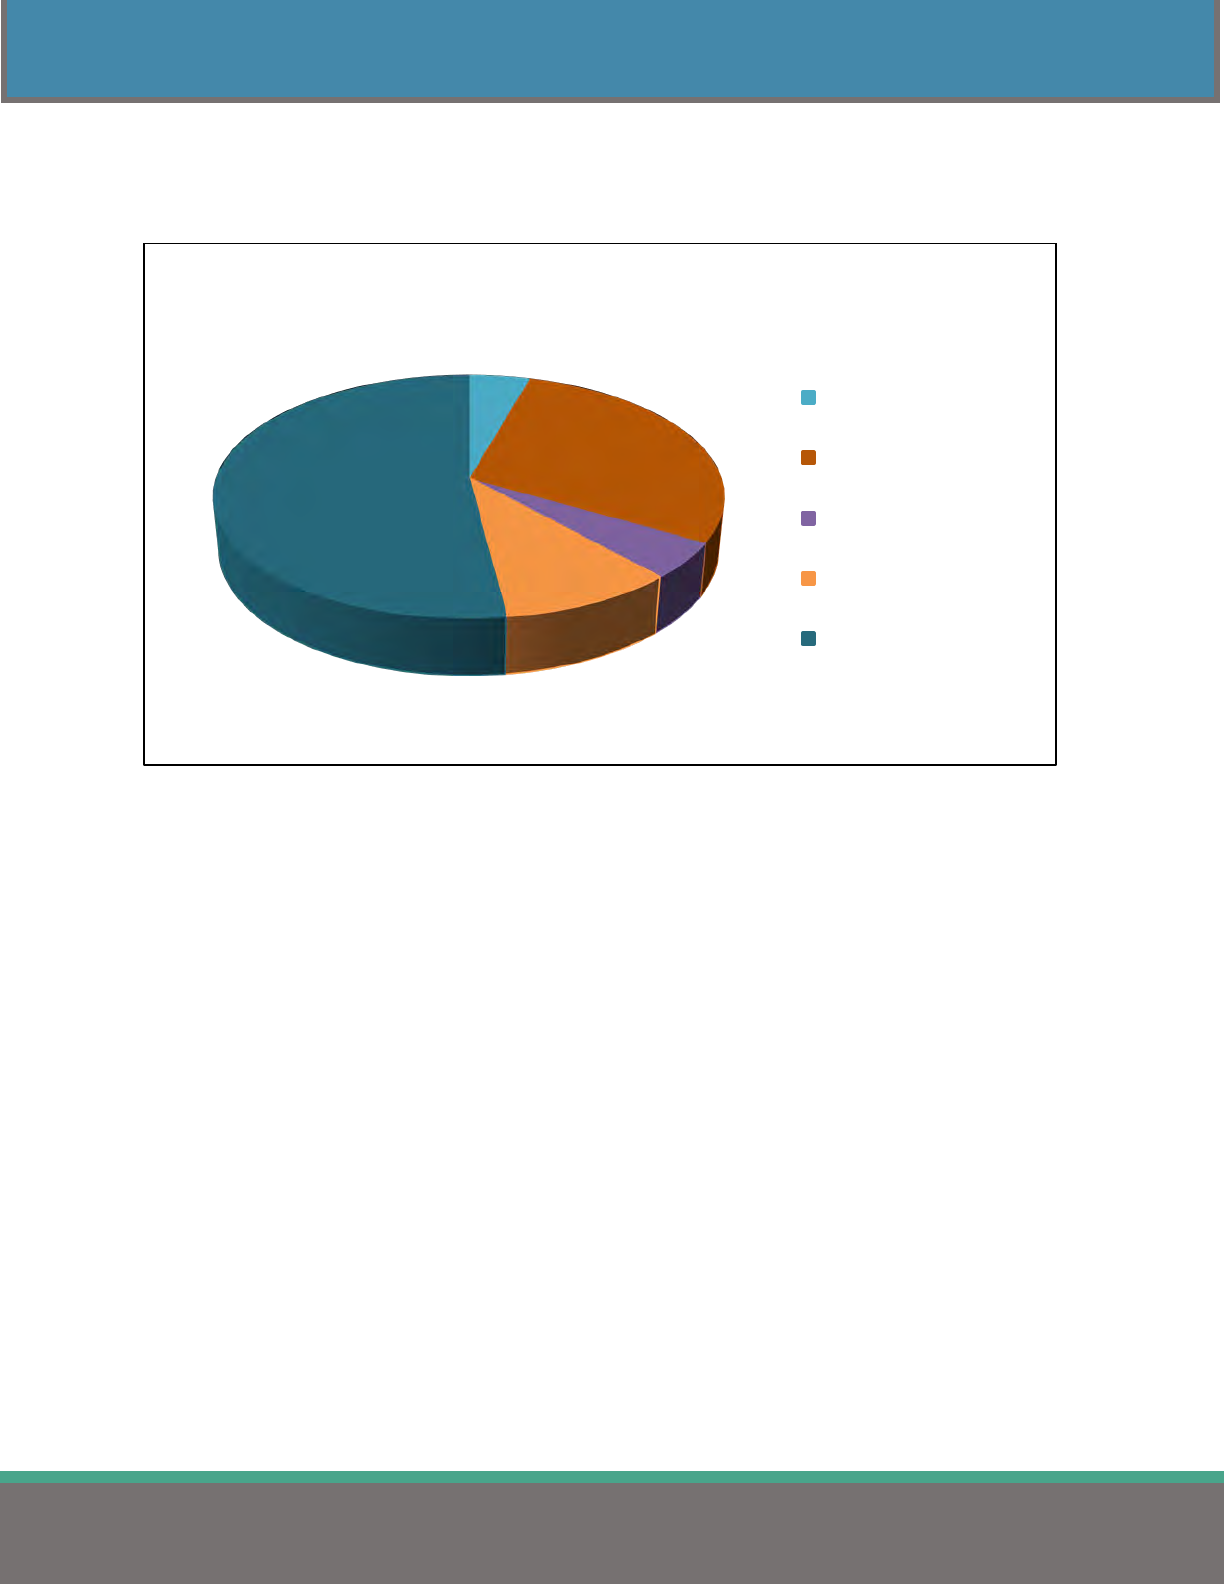
59
COST SAVINGS
2023 HEALTH INSURANCE REPORT
Figure 22 illustrates the frequency of each type of spousal restriction.
Figure 22
4.4%
29.0%
4.9%
9.7%
52.0%
Frequency of Types of Spousal Restrictions
Incentive offered
Requirement to take other
insurance as primary
Penalty Charged
Not Eligible
No Restrictions
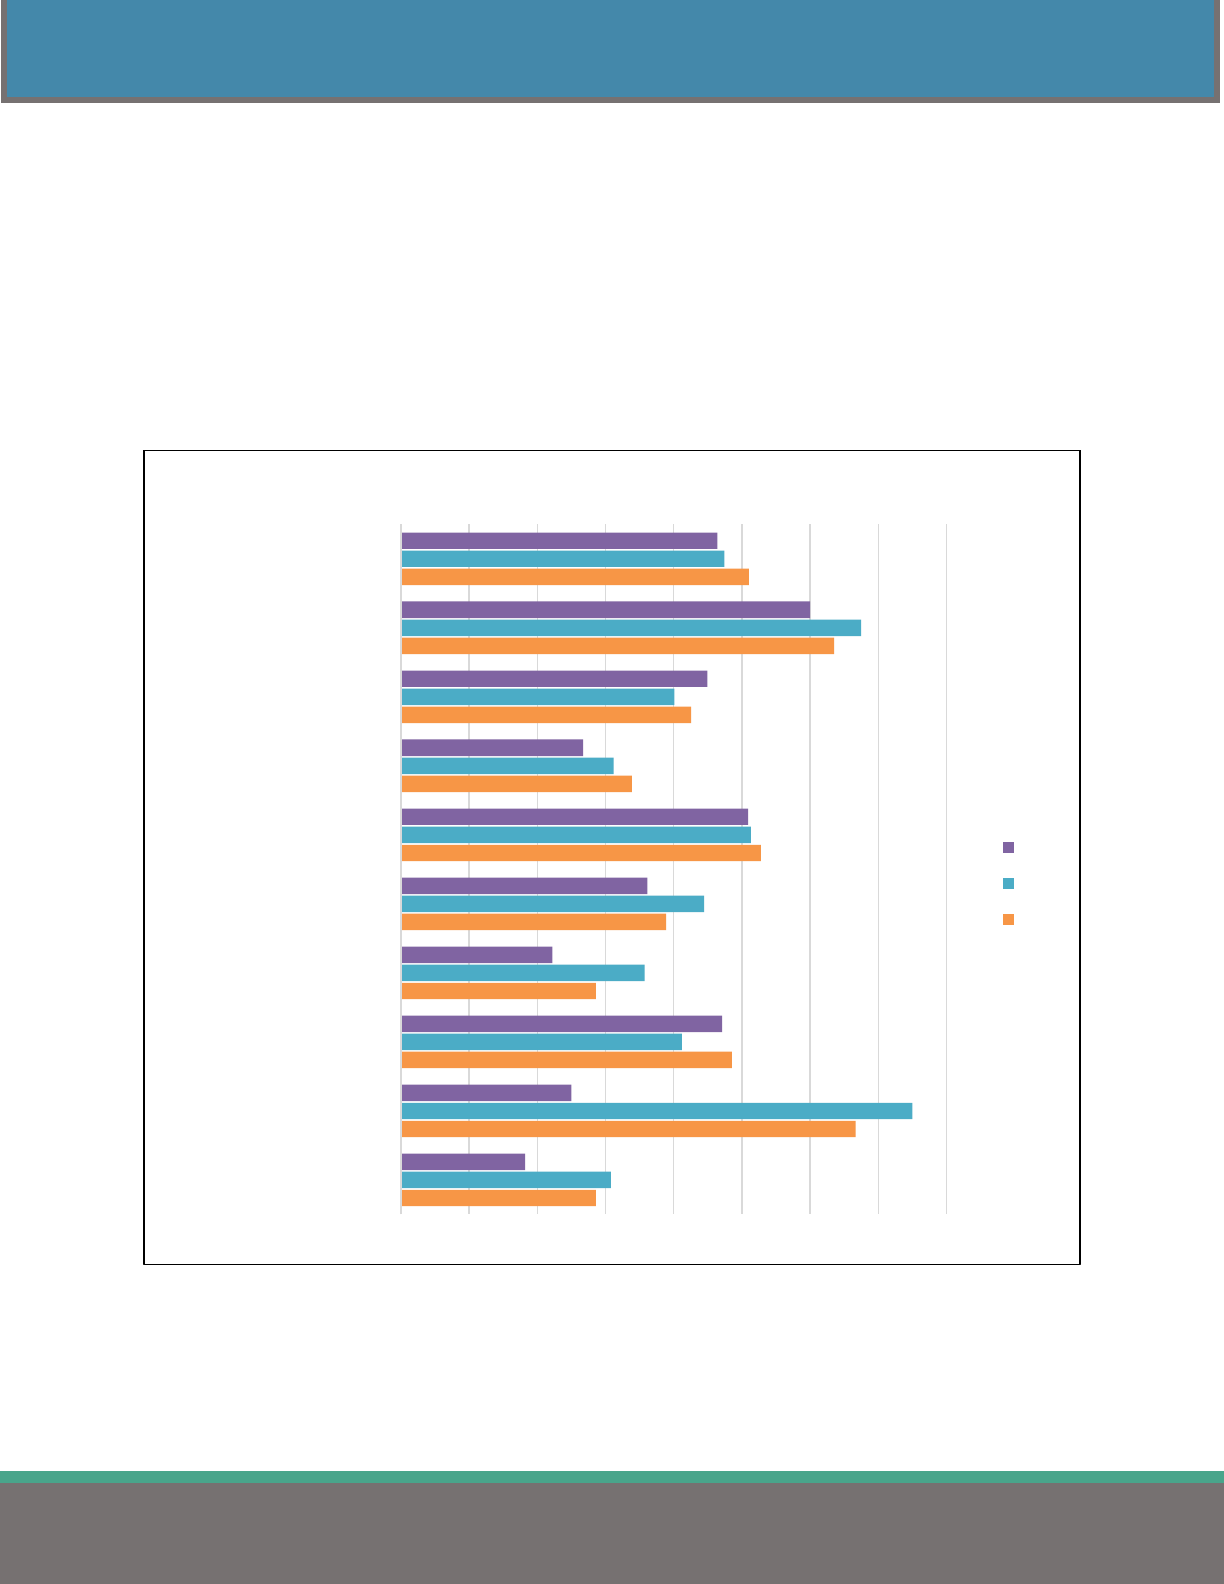
60
COST SAVINGS
2023 HEALTH INSURANCE REPORT
DEPENDENT ELIGIBILITY AUDIT
Dependent Eligibility Audits (DEAs) identify individuals who do not qualify for the employer-offered
medical plan. The purpose of a DEA is to identify persons enrolled on the employer’s medical plan who
are no longer eligible for coverage. Examples include adult children no longer in school, full-time
students older than the maximum age allowed by the plan, ex-spouses, and other relatives not eligible for
coverage.
Figure 23 illustrates the number of employers by jurisdiction who have conducted a dependent eligibility
audit in the past three years.
Figure 23
18.2%
25.0%
47.1%
22.2%
36.1%
50.9%
26.7%
44.9%
60.0%
46.4%
0.0% 10.0% 20.0% 30.0% 40.0% 50.0% 60.0% 70.0% 80.0%
Regional Transit Authorities
Port Authorities
Metro Housing Authorities
Fire Districts
Colleges & Universities
School Districts & ESCs
Townships
Cities
Counties
STATEWIDE
Percent of Employers with Dependent Eligibility Audit
2023
2022
2021
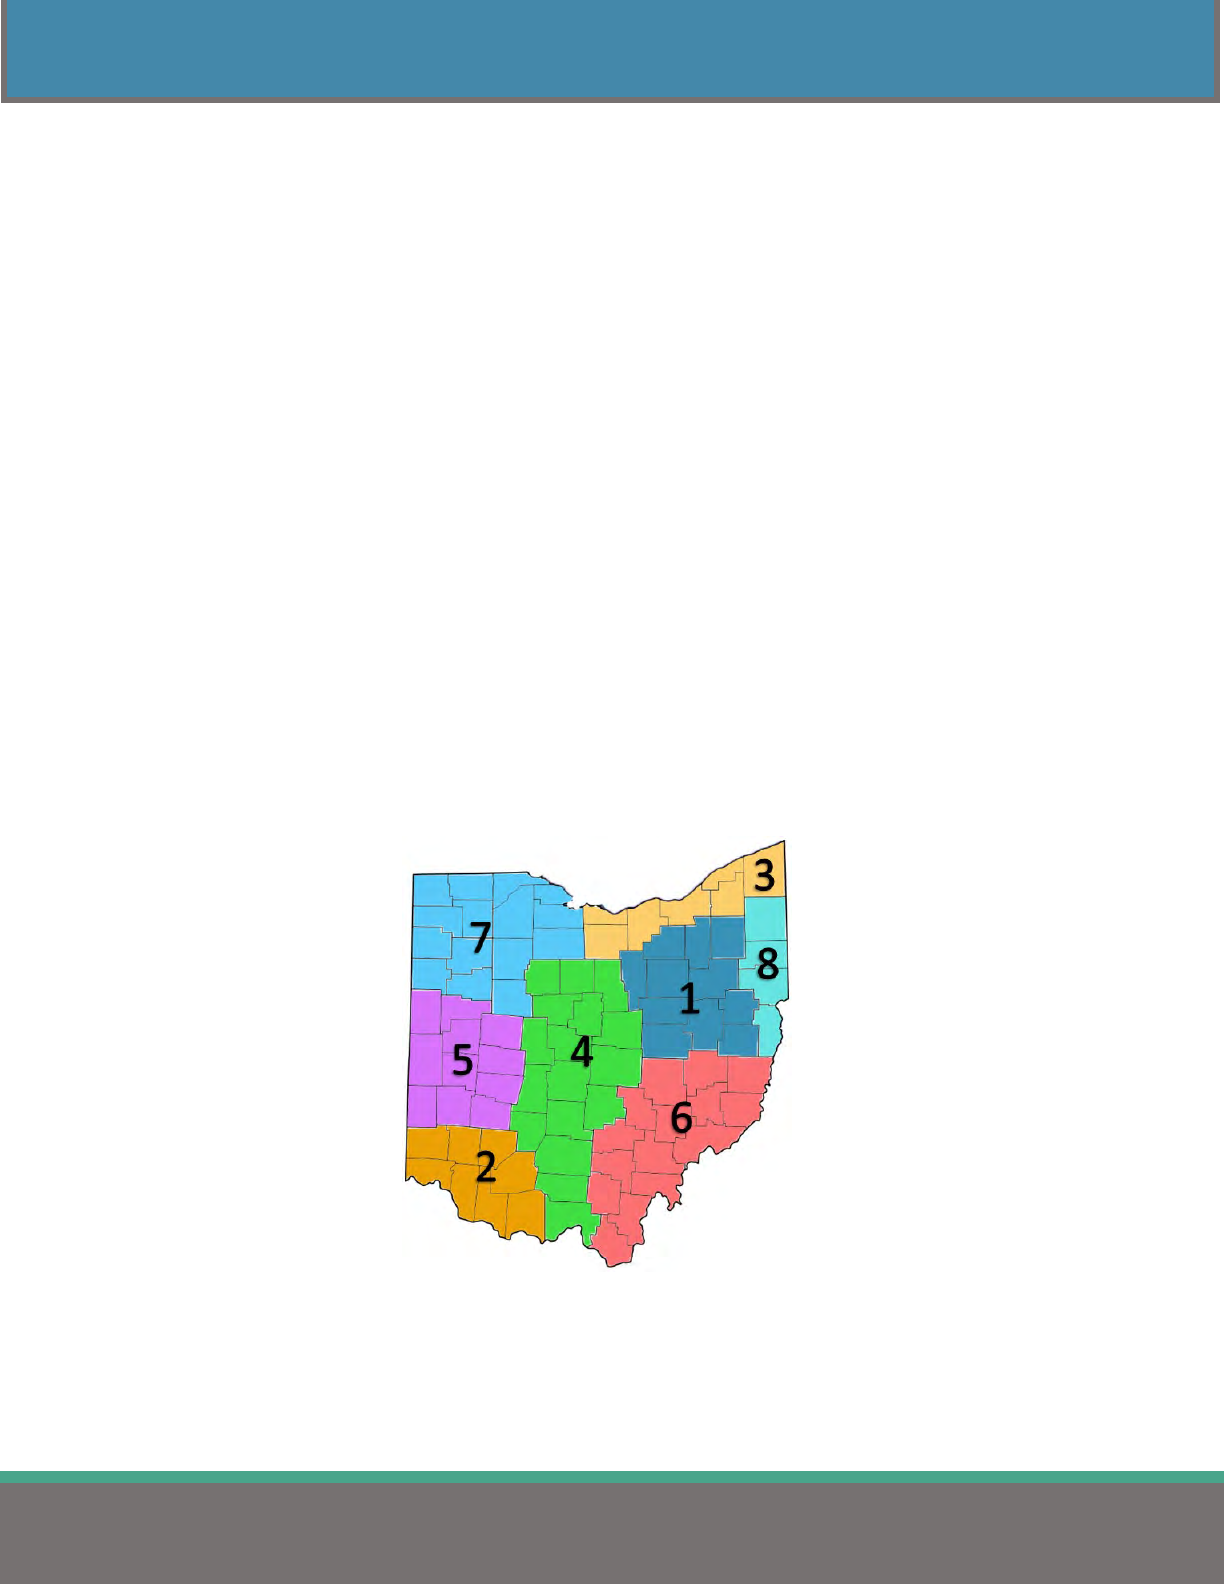
61
DEFINITIONS
2023 HEALTH INSURANCE REPORT
DEFINITIONS
• Each Region consists of several geographically proximate counties. The county groupings, which
SERB’s Bureau of Mediation originally developed for the purpose of developing fact finder and
conciliation panels, are as follows:
1 - Akron/Canton: Ashland, Carroll, Coshocton, Harrison, Holmes, Medina, Portage, Stark,
Summit, Tuscarawas & Wayne.
2 - Cincinnati: Adams, Brown, Butler, Clermont, Clinton, Hamilton, Highland & Warren.
3 - Cleveland: Ashtabula, Cuyahoga, Erie, Geauga, Huron, Lake, & Lorain.
4 - Columbus: Crawford, Delaware, Fairfield, Fayette, Franklin, Knox, Licking, Madison,
Marion, Morrow, Pickaway, Pike, Richland, Ross, Scioto, Union, & Wyandot.
5 - Dayton: Auglaize, Champaign, Clark, Darke, Greene, Logan, Mercer, Miami, Montgomery,
Preble, & Shelby.
6 - Southeast Ohio: Athens, Belmont, Gallia, Guernsey, Hocking, Jackson, Lawrence, Meigs,
Monroe, Morgan, Muskingum, Noble, Perry, Vinton, & Washington.
7 - Toledo: Allen, Defiance, Fulton, Hancock, Hardin, Henry, Lucas, Ottawa, Paulding, Putnam,
Sandusky, Seneca, Van Wert, Williams, & Wood.
8 - Warren-Youngstown: Columbiana, Jefferson, Mahoning, & Trumbull.

62
DEFINITIONS
2023 HEALTH INSURANCE REPORT
• Employees Covered refers to the total number of employees the employer has on staff eligible for
medical coverage.
• Exclusive Provider Organization (EPO): “An Exclusive Provider Organization Plan is a managed
care plan where services are covered only if you go to doctors, specialists, or hospitals in the plan’s
network (except in an emergency).” (Health Insurance Marketplace. https://www.healthcare.gov/
glossary/exclusive-provider-organization-EPO-plan. Retrieved on June 14, 2023.)
• High Deductible Health Plan (HDHP): “A High Deductible Health Plan is a plan with a higher
deductible than a traditional insurance plan. The monthly premium is usually lower, but you pay more
health care costs yourself before the insurance company starts to pay its share (your deductible). A
high deductible plan (HDHP) can be combined with a health savings account (HSA), allowing you to
pay for certain medical expenses with money free from federal taxes.
For 2022, the IRS defines a high deductible health plan as any plan with a deductible of at least
$1,400 for individual or $2,800 for family coverage. An HDHP’s total yearly out-of-pocket expenses
(including deductibles, copayments, and coinsurance) can’t be more than $7,050 for an individual or
$14,100 for a family. (This limit doesn't apply to out-of-network services.)” (Health Insurance
Marketplace. https://www.healthcare.gov/glossary/high-deductible-health-plan/. Retrieved on June
14, 2023.)
• Health Maintenance Organization (HMO): A “Health Maintenance Organization is a type of
health insurance plan that usually limits coverage to care from doctors who work for or contract with
the HMO. It generally won't cover out-of-network care except in an emergency. An HMO may
require you to live or work in its service area to be eligible for coverage. HMOs often provide
integrated care and focus on prevention and wellness.” (Health Insurance Marketplace.
https://www.healthcare.gov/ glossary/health-maintenance-organization-HMO/. Retrieved on June 14,
2023.)
• Point of Service (POS): “A point-of-service plan is a type of managed care plan that is a hybrid of
HMO and PPO plans. Like an HMO, participants designate an in-network physician to be their
primary care provider. But like a PPO, patients may go outside of the provider network for health care
services. When patients venture out of the network, they’ll have to pay most of the cost unless the
primary care provider has made a referral to the out-of-network provider. Then the medical plan will
pick up the tab.” (Small Business Majority. https://healthcoverageguide.org/reference-
guide/coverage-types/point-of-service-plan-pos/. Retrieved on June 14, 2023.)
• Preferred Provider Organization (PPO): “A Preferred Provider Organization is a type of health
plan that contracts with medical providers, such as hospitals and doctors, to create a network of
participating providers. You pay less if you use providers that belong to the plan’s network. You can
use doctors, hospitals, and providers outside of the network for an additional cost.” (Health Insurance
Marketplace. https://www.healthcare.gov/glossary/preferred-provider-organization-ppo/. Retrieved on
June 14, 2023.)
• Health Savings Account (HSA): “A health savings account is a tax-exempt trust or custodial
account you set up with a qualified HSA trustee to pay or reimburse certain medical expenses you
incur. You must be an eligible individual to qualify for an HSA.” (Internal Revenue Service.
https://www.irs.gov/publications/p969/index.html. Retrieved on June 14, 2023.)

63
DEFINITIONS
2023 HEALTH INSURANCE REPORT
• Health Reimbursement Account (HRA): “A Health Reimbursement Account is an arrangement that
is funded solely by an employer, and that reimburses an employee for medical care expenses (as
defined under Code § 213(d)) incurred by the employee, or his spouse, dependents, and any children
who, as of the end of the taxable year, have not attained age 27, up to a maximum dollar amount for a
coverage period. IRS Notice 2002-45, 2002-02 C.B. 93; Revenue Ruling 2002-41, 2002-2 C.B. 75.
This reimbursement is excludable from the employee’s income. Amounts that remain at the end of the
year generally can be used to reimburse expenses incurred in later years.” (Internal Revenue Service.
https://www.irs.gov/pub/irs-drop/n-13-54.pdf. Retrieved on June 14, 2023.)

State Employment Relations Board
65 East State Street, 12th Floor
Columbus, OH 43215-4213
(614) 644-8573 (Main) | (614) 466-3074 (Fax)
hps://serb.ohio.gov
