Morbidity and Mortality Weekly Report
Weekly / Vol. 72 / No. 22 June 2, 2023
U.S. Department of Health and Human Services
Centers for Disease Control and Prevention
Community Water Fluoridation Levels To Promote Effectiveness and
Safety in Oral Health — United States, 2016–2021
Theresa J. Boehmer
1
; Srdjan Lesaja, MS
2
; Lorena Espinoza, DDS
1
; Chandresh N. Ladva, PhD
1
Drinking water fluoridated at the level recommended by the
U.S. Public Health Service (USPHS) reduces dental caries (cav-
ities) by approximately 25% in children and adults (1). USPHS
recommends fluoride levels to achieve oral health benefits and
minimize risks associated with excess fluoride exposure. To
provide the benefits of community water fluoridation, water
systems should target a level of 0.7 mg/L and maintain levels
≥0.6 mg/L (2). The Environmental Protection Agency (EPA)
sets a safety standard at 2.0 mg/L to prevent mild or moderate
dental fluorosis, a condition that causes changes in the appear-
ance of tooth enamel caused by hypermineralization resulting
from excess fluoride intake during tooth-forming years (i.e.,
before age 8 years). During 2016–2021, fluoride measurements
for 16.3% of population-weighted monthly fluoride measure-
ments (person-months) reported by community water systems
to CDC’s Water Fluoridation Reporting System (WFRS)
were <0.6 mg/L; only 0.01% of person-months exceeded
2.0 mg/L. More than 80% of population-weighted fluoride
measurements from community water systems reporting to
WFRS were above 0.6 mg/L. Although 0.7 mg/L is the rec-
ommended optimal level, ≥0.6 mg/L is still effective for the
prevention of caries. A total of 4,080 community water systems
safely fluoridated water 99.99% of the time with levels below
the secondary safety standard of 2.0 mg/L. Water systems are
encouraged to work with their state programs to report their
fluoride data into WFRS and meet USPHS recommendations
to provide the full benefit of fluoridation for caries prevention.
Monthly data from WFRS during 2016–2021 were analyzed
for water systems that added fluoride (adjusting systems);
these systems provide monthly average fluoride levels in mg/L.
These monthly average fluoride levels were compared for two
goals: prevention and safety. For prevention, reported levels
were compared with 0.7 mg/L, the USPHS-recommended
optimal fluoride level for preventing caries (3). For safety
(i.e., to minimize potential fluorosis)* (4), reported fluoride
levels were compared with the EPA’s secondary maximum
contaminant level (SMCL), of 2.0 mg/L. All analyses were
conducted using SAS (version 9.4; SAS Institute) and R (ver-
sion 4.1.3; The R Foundation). This activity was reviewed by
CDC and was conducted consistent with applicable federal
law and CDC policy.
†
Water system populations were obtained from WFRS for
each year during 2016–2021 (5). These populations are
updated periodically by the states directly to WFRS or annually
* EPA also sets a maximum contaminant level (MCL) of 4.0 mg/L to prevent
bone disease and mottling of teeth from fluorosis.
†
5 C.F.R. part 46, 21 C.F.R. part 56; 42 U.S.C. Sect. 241(d); 5 U.S.C. Sect.
552a; 44 U.S.C. Sect. 3501 et seq.
INSIDE
597 Evaluation of the Cherokee Nation Hepatitis C Virus
Elimination Program — Cherokee Nation,
Oklahoma, 2015–2020
601 Estimates of SARS-CoV-2 Seroprevalence and
Incidence of Primary SARS-CoV-2 Infections Among
Blood Donors, by COVID-19 Vaccination Status —
United States, April 2021–September 2022
606 Notes from the Field: Pediatric Intracranial Infections —
Clark County, Nevada, January–December 2022
608 Notes from the Field: Update on Pediatric
Intracranial Infections — 19 States and the District
of Columbia, January 2016–March 2023
611 QuickStats
Continuing Education examination available at
https://www.cdc.gov/mmwr/mmwr_continuingEducation.html

Morbidity and Mortality Weekly Report
594 MMWR / June 2, 2023 / Vol. 72 / No. 22 US Department of Health and Human Services/Centers for Disease Control and Prevention
The MMWR series of publications is published by the Office of Science, Centers for Disease Control and Prevention (CDC), U.S. Department of Health and Human
Services, Atlanta, GA 30329-4027.
Suggested citation: [Author names; first three, then et al., if more than six.] [Report title]. MMWR Morb Mortal Wkly Rep 2023;72:[inclusive page numbers].
Centers for Disease Control and Prevention
Rochelle P. Walensky, MD, MPH, Director
Debra Houry, MD, MPH, Chief Medical Officer and Deputy Director for Program and Science
Rebecca Bunnell, PhD, MEd, Director, Office of Science
MMWR Editorial and Production Staff (Weekly)
Charlotte K. Kent, PhD, MPH, Editor in Chief
Rachel Gorwitz, MD, MPH, Acting Executive Editor
Jacqueline Gindler, MD, Editor
Debbie Dowell, MD, MPH, Guest Science Editor
Paul Z. Siegel, MD, MPH, Associate Editor
Mary Dott, MD, MPH, Online Editor
Terisa F. Rutledge, Managing Editor
Teresa M. Hood, MS, Lead Technical Writer-Editor
Glenn Damon, Jacqueline Farley, MS,
Tiana Garrett-Cherry, PhD, MPH, Ashley Morici,
Stacy Simon, MA, Morgan Thompson, Suzanne Webb, PhD,
Technical Writer-Editors
Martha F. Boyd, Lead Visual Information Specialist
Alexander J. Gottardy, Maureen A. Leahy,
Julia C. Martinroe, Stephen R. Spriggs, Tong Yang,
Visual Information Specialists
Quang M. Doan, MBA, Phyllis H. King,
Terraye M. Starr, Moua Yang,
Information Technology Specialists
MMWR Editorial Board
Timothy F. Jones, MD, Chairman
Matthew L. Boulton, MD, MPH
Carolyn Brooks, ScD, MA
Virginia A. Caine, MD
Jonathan E. Fielding, MD, MPH, MBA
David W. Fleming, MD
William E. Halperin, MD, DrPH, MPH
Jewel Mullen, MD, MPH, MPA
Jeff Niederdeppe, PhD
Patricia Quinlisk, MD, MPH
Patrick L. Remington, MD, MPH
Carlos Roig, MS, MA
William Schaffner, MD
Morgan Bobb Swanson, BS
Ian Branam, MA,
Lead Health Communication Specialist
Kiana Cohen, MPH, Symone Hairston, MPH,
Leslie Hamlin, Lowery Johnson,
Health Communication Specialists
Dewin Jimenez, Will Yang, MA,
Visual Information Specialists
by CDC from EPA’s State Drinking Water Information System.
Population-weighted monthly fluoride levels (person-months)
were calculated by multiplying each average monthly fluoride
level by the size of the population served by each water system.
Data are typically reported to WFRS on a monthly, quar-
terly, or yearly basis. Participation across states varies based on
fluoride-reporting requirements, drinking water or oral health
program staffing limitations, and fluoridation program funding
status. Among approximately 54,000 water systems in WFRS,
a total of 5,888 adjust fluoride levels and serve a population
of more than 200 million persons (145 million directly and
an additional 55 million through water systems that purchase
fluoridated water from adjusted water systems). Among the
systems in WFRS, a total of 4,080, serving a population of
124,616,896, provided at least 1 month of data during the
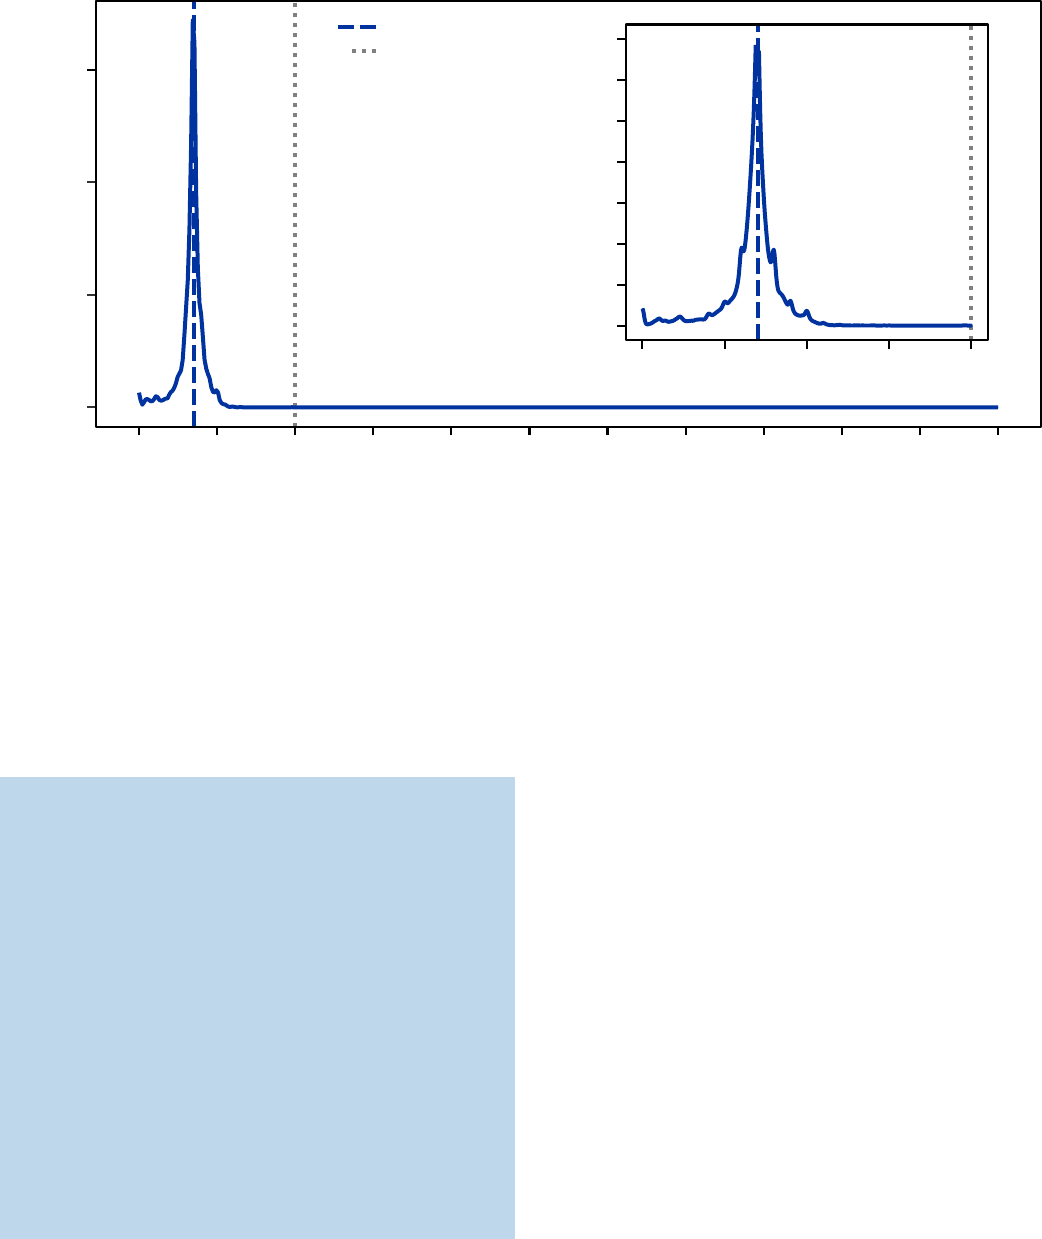
study period. Among 7,936,442,898 person-months during
2016–2021, only 796,283 (0.01%) exceeded the SMCL
§
;
16.3% were below 0.6 mg/L, and 83.7% of person-months
operated between 0.6 mg/L and 2.0 mg/L with the largest peak
in data at the 0.7 mg/L target (Figure).
Discussion
In this examination of the performance of U.S. water systems
reporting fluoride levels from the perspectives of preventing
caries and supporting established safety standards, the most
§
Fluoride levels rarely exceeded the MCL (0.002%).
common person-month fluoride level was the USPHS-
recommended level of 0.7 mg/L and fluoride levels rarely
exceeded the SMCL (0.01%). SMCL exceedances should be
minimized to reduce dental fluorosis. Dental caries are one of
the most common preventable chronic diseases among U.S.
children: approximately one in four children living below the
federal poverty level experiences untreated caries (6). Optimal
levels of water fluoridation prevent caries by providing frequent
and consistent contact with low levels of fluoride, ultimately
reducing tooth decay by 25% in children and adults (7). Water
systems that consistently and optimally fluoridate support the
reduction of tooth decay. Suboptimal water systems in which
fluoride concentrations are <0.6 mg/L are both ineffective in
using resources and in supporting the oral health of their com-
munities. Optimal fluoridation can be maintained with routine
maintenance and monitoring, which provide protection from
equipment malfunction, disruptions in fluoride supply, and
periodic system shutdowns.
¶
Water fluoridation promotes health equity through its
proven effects on decreasing caries, reducing costs to families,
and being readily available at the tap. In light of these benefits,
Healthy People 2030, an ongoing initiative to improve popu-
lation health, set the objective to increase the proportion of
U.S. residents served by optimally fluoridated water systems
¶
https://www.cdc.gov/mmwr/PDF/rr/rr4413.pdf
Morbidity and Mortality Weekly Report
MMWR / June 2, 2023 / Vol. 72 / No. 22 595
US Department of Health and Human Services/Centers for Disease Control and Prevention
FIGURE. Density estimation of population-weighted monthly average fluoride levels — United States, 2016–2021
0
1
2
3
4
5
6
7
0.5 1.00.0 1.5 2.0
Monthly average uoride level (mg/L)
0
2
4
6
987654321 100 11
Monthly average uoride level (mg/L)
Density of person-months
0.7 mg/L uoride target
2.0 mg/L uoride SMCL
Density of person-months
Abbreviation: SMCL = secondary maximum contamination level.
to 77.1% from 73.0% in 2018 (8). Currently, programs
nationwide receive a net savings of $6.5 billion per year by
averting direct dental treatment costs (tooth restorations and
extractions) and indirect costs (follow-up treatment and losses
of productivity) (9). After community water fluoridation was
discontinued in Juneau, Alaska, for example, a higher number
of caries-related procedures among persons aged <18 years was
documented, particularly in persons born after cessation of
Summary
What is already known about this topic?
Community water fluoridation delivers cavity-preventing
fluoride to everyone with access. The U.S. government sets
optimal fluoridation at 0.7 mg/L and a safety standard at
2.0 mg/L.
What is being added by this report?
During 2016–2021, a total of 4,080 community water systems
safely fluoridated water 99.99% of the time, with levels below
the secondary safety standard of 2.0 mg/L. However, 16.3% of
nearly 8 billion population-weighted monthly fluoride measure-
ments were <0.6 mg/L, placing the prevention of cavities
in jeopardy.
What are the implications for public health practice?
Water system managers are encouraged to work with their state
programs to report fluoride data to CDC and meet U.S. Public
Health Service recommendations to provide the full benefit of
cavity prevention through water fluoridation.
fluoridation, highlighting the long-term oral health benefits
of supporting access to fluoridated water (10).
The findings in this report are subject to at least two limita-
tions. First, CDC relies on state oral health and drinking water
programs to report operational information; 31% of adjust-
ing systems (5,888) did not report any fluoride levels during
2016–2021. Second, population values for all water systems
are obtained from EPA’s State Drinking Water Information
System federal database at the state’s discretion; however, addi-
tions and deletions of water systems and associated fluoridation
status must be received from the state programs. As a result,
counts of water system and information might differ from
other publicly available community water system databases.
Reporting in WFRS might be increased by improving data
sharing between state drinking water and oral health pro-
grams, especially in states where water system data are entered
into WFRS by the oral health program. Methods to increase
reporting can include creating a data-sharing memorandum of
understanding between the two programs and implementing
a state policy that requires water systems to conduct monthly
recording and reporting to the state.
Thousands of fluoride-adjusting community water systems
reach approximately 200 million persons in the United States.
To promote receipt of the full benefits of community water
fluoridation, water systems must manage resources to meet
the established 0.7 mg/L target consistently, especially those

Morbidity and Mortality Weekly Report
596 MMWR / June 2, 2023 / Vol. 72 / No. 22 US Department of Health and Human Services/Centers for Disease Control and Prevention
serving communities where fluoride measurements were
<0.6 mg/L. CDC carefully and continuously monitors emerg-
ing research about the benefits and risks of fluoride exposure
so that recommendations are evidence-based. CDC continues
to emphasize the importance of community water fluoridation
at the recommended level of 0.7 mg/L as the cornerstone of
dental caries prevention in the United States.** Water systems
are encouraged to work with their state programs to report their
fluoride data into WFRS and meet USPHS recommendations
to provide the full benefit of fluoride in caries prevention.
Maintaining and improving access to optimally fluoridated
water remains a vital, safe, and successful method for reduc-
ing dental caries and their associated costs for communities
and families.
** https://www.cdc.gov/fluoridation/guidelines/cdc-statement-on-community-
water-fluoridation.html
Corresponding author: Theresa J. Boehmer, [email protected].
1
Division of Oral Health, National Center for Chronic Disease Prevention and
Health Promotion, CDC;
2
DB Consulting Group, Inc., Bethesda, Maryland.
All authors have completed and submitted the International
Committee of Medical Journal Editors form for disclosure of potential
conflicts of interest. No potential conflicts of interest were disclosed.
References
1. CDC. Community water fluoridation. Atlanta, GA: US Department of
Health and Human Services, CDC; 2020. https://www.cdc.gov/
fluoridation/index.html
2. Heller KE, Eklund SA, Burt BA. Dental caries and dental fluorosis at varying
water fluoride concentrations. J Public Health Dent 1997;57:136–43.
PMID:9383751 https://doi.org/10.1111/j.1752-7325.1997.tb02964.x
3. US Department of Health and Human Services. Public Health Service
recommendation for fluoride concentration in drinking water for
prevention of dental caries. Fed Regist 2015 May 1:10201:24936–47.
https://www.federalregister.gov/documents/2015/05/01/2015-10201/
public-health-service-recommendation-for-fluoride-concentration-in-
drinking-water-for-prevention-of
4. Environmental Protection Agency. Drinking water requirements for
states and public water systems: drinking water regulations. Washington,
DC: Environmental Protection Agency; 2022. https://www.epa.gov/
dwreginfo/drinking-water-regulations
5. CDC. Community water fluoridation: estimating community water
system populations. Atlanta, GA: US Department of Health and Human
Services, CDC; 2020. https://www.cdc.gov/fluoridation/statistics/
estimating-cws-populations.htm
6. Griffin SO, Regnier E, Griffin PM, Huntley V. Effectiveness of fluoride
in preventing caries in adults. J Dent Res 2007;86:410–5.
PMID:17452559 https://doi.org/10.1177/154405910708600504
7. Community Preventive Services Task Force. Dental caries (cavities):
community water fluoridation. Atlanta, GA: US Department of Health
and Human Services, CDC; 2021. https://www.thecommunityguide.
org/findings/dental-caries-cavities-community-water-fluoridation.html
8. CDC. Community water fluoridation: 2018 fluoridation statistics.
Atlanta, GA: US Department of Health and Human Services, CDC;
2020. https://www.cdc.gov/fluoridation/statistics/2018stats.htm
9. O’Connell J, Rockell J, Ouellet J, Tomar SL, Maas W. Costs and savings
associated with community water fluoridation in the United States.
Health Aff (Millwood) 2016;35:2224–32. PMID:27920310 https://
doi.org/10.1377/hlthaff.2016.0881
10. Meyer J, Margaritis V, Mendelsohn A. Consequences of community
water fluoridation cessation for Medicaid-eligible children and
adolescents in Juneau, Alaska. BMC Oral Health 2018;18:215.
PMID:30545358 https://doi.org/10.1186/s12903-018-0684-2
