
A fifty-year look at divorces in
Canada,1970to2020
Released at 8:30 a.m. Eastern time in The Daily, Wednesday, March 9, 2022
Highlights
• The number of divorces recorded in2020(42,933) was the lowest since1973.
• Barriers to accessing court services during the COVID-19pandemic likely contributed to the decrease in
divorce applications and granted divorces in2020.
• The decrease in the divorce rate since1991is linked to the aging of the married population.
• Since the mid-2000s, age-specific divorce rates have been declining most rapidly for young adults while they
have plateaued for persons aged50and over.
• Almost one-third of divorces are now the result of a joint application by both spouses.
• In2019, Canada had the second lowest crude divorce rate among G7countries.
• In the period from2016to2020, divorce rates were highest in Yukon and Alberta and lowest in Nunavut and
Newfoundland and Labrador.
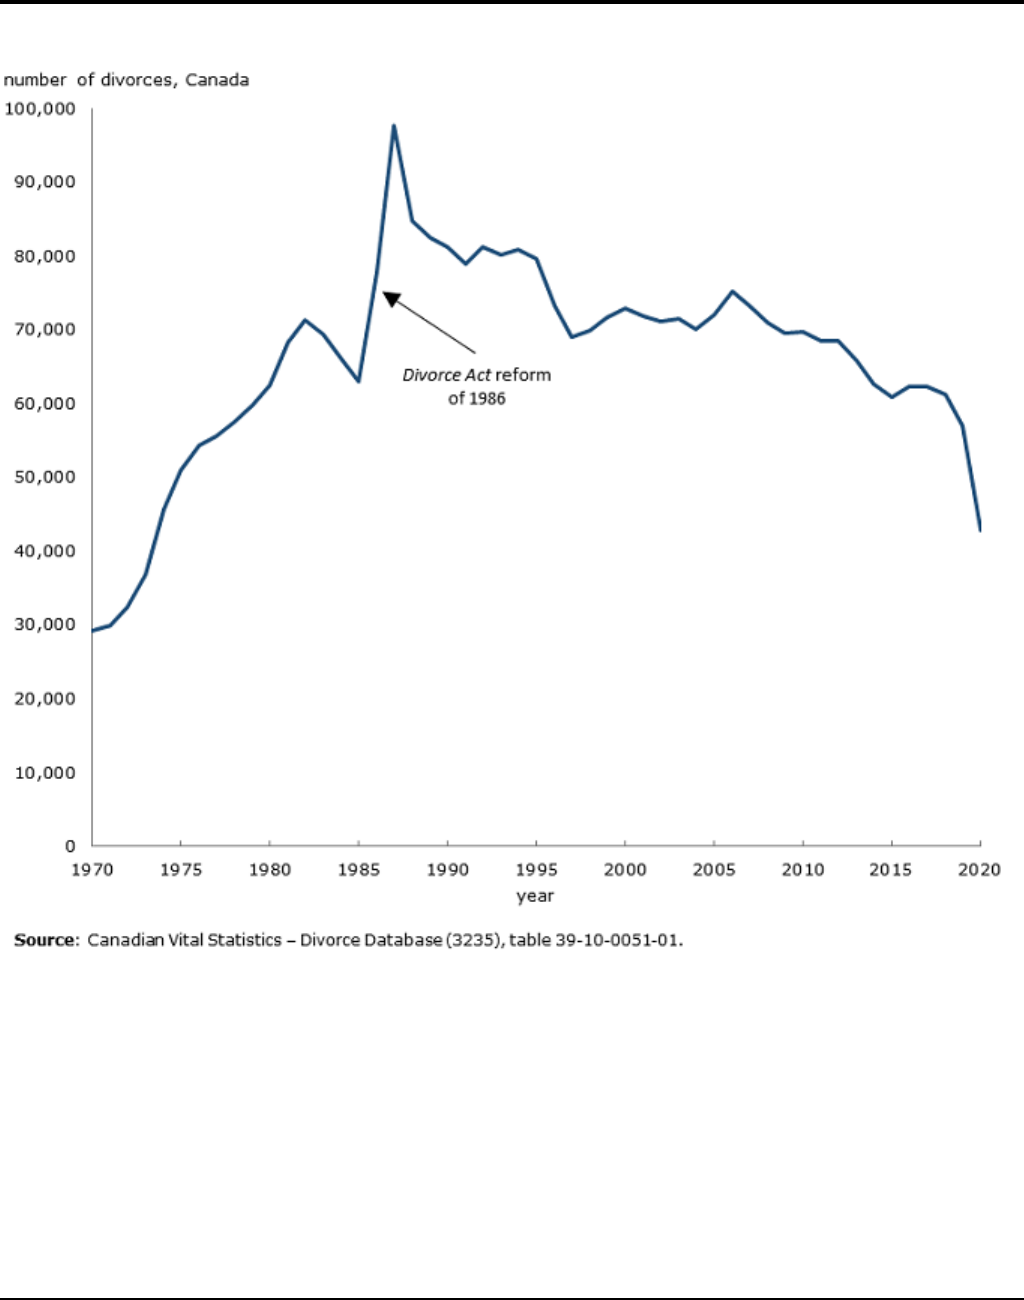
Sharp decrease in divorces between2019and2020
In2020, there were42,933divorces granted in Canada, a sharp decrease from the56,937divorces recorded
in2019. While the number of divorces in the country has been generally declining for many years, this25% annual
drop is the largest since the Divorce Act of1968came into force. Difficulties accessing courts services during the
COVID-19pandemic likely contributed to this decrease which coincides with the onset of the pandemic.
The number of divorces in2020was the lowest since1973and less than half the highest number recorded in1987.
That year,97,773divorces were granted following amendments to the Divorce Act that reduced the minimum period
of separation required before being granted a "no-fault" divorce from three years to one year.
The Daily, Wednesday, March 9, 2022
Component of Statistics Canada catalogue no. 11-001-X
2
Infographic 1– General decline in the number of divorces in the past decades, but sharper
decrease in2020
The pandemic has created obstacles for the processing of divorce cases
Public health measures introduced during the pandemic were likely important drivers of the relatively low number of
divorces recorded in2020. In fact, lockdowns, slowed court proceedings, the adjournment of less urgent cases, and
the temporary closure of some courts created barriers to accessing court services.
The social and economic disruptions associated with the pandemic may also have led to a change in the number of
couples seeking to divorce. However, this specific effect cannot yet be seen in divorce statistics for the year2020.
In the case of 'no-fault' divorce applications—which have traditionally constituted the majority of
applications—couples must separate for at least one year before a divorce may be granted. As a result, the full
impact of these disruptions on the number of divorces will only begin to be seen in2021.
The Daily, Wednesday, March 9, 2022
Component of Statistics Canada catalogue no. 11-001-X
3
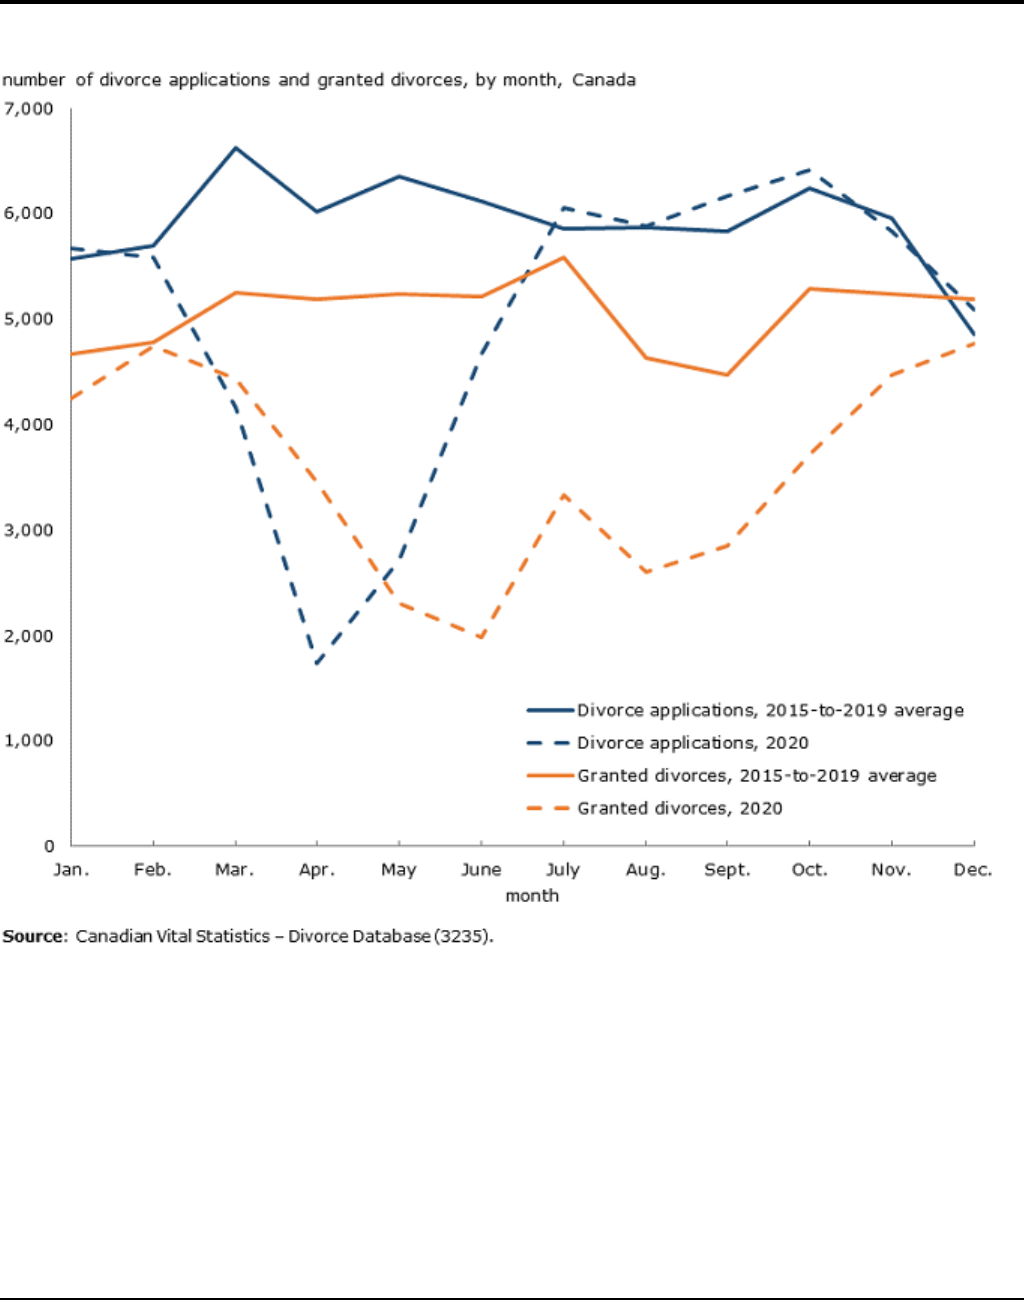
Infographic 2– Sharp decrease in divorce applications and granted divorces in the early months
of the pandemic
The monthly number of divorce applications filed with the courts declined markedly beginning in March2020.
However, by July2020, the number of applications had recovered to a level similar to that of previous years.
The number of divorces granted each month by the courts also fell at the beginning of the pandemic. However,
unlike the number of applications, the number of divorces granted in December2020had yet to return to the level
of recent pre-pandemic years. A similar pattern was found in a case study of monthly divorces in five American
states.
In addition, the time elapsed between the filing of the divorce application and the granting of the divorce has
increased since the start of the pandemic. While the median duration of this process was4.8months for divorces
granted in2018and2019, it increased by a month in2020(5.8months).

The Daily, Wednesday, March 9, 2022
Component of Statistics Canada catalogue no. 11-001-X
4
Fewer divorces in all provinces in2020
All provinces experienced a decrease in the number of divorces between2019and2020. The decrease was
particularly strong in Ontario (-36%). In the other provinces, the decrease was between11% (New Brunswick)
and22% (Alberta).
In contrast, the number of divorces remained stable in the territories, with the exception of Nunavut where annual
fluctuations are common given the low number of divorces granted each year.

The Daily, Wednesday, March 9, 2022
Component of Statistics Canada catalogue no. 11-001-X
5
Table 1
Drop in the number of divorces in all provinces between 2019 and 2020
2019 2020 2019 to 2020
number of divorces
% change
Canada 56,937 42,933 -24.6
Newfoundland and Labrador 729 618 -15.2
Prince Edward Island 240 204 -15.0
Nova Scotia 1,395 1,149 -17.6
New Brunswick 1,185 1,056 -10.9
Quebec 9,681 8,559 -11.6
Ontario 22,377 14,223 -36.4
Manitoba 2,037 1,782 -12.5
Saskatchewan 1,893 1,566 -17.3
Alberta 8,673 6,801 -21.6
British Columbia 8,589 6,849 -20.3
Yukon 81 78 -3.7
Northwest Territories 45 45 0.0
Nunavut 12 3 -75.0
Source(s): Canadian Vital Statistics – Divorce Database (3235), table 39-10-0051-01.
Divorce statistics reflect only part of all union dissolutions
A divorce is a legal process that ends a marriage. Therefore, divorce statistics do not cover the separations of
married couples nor the dissolutions of common-law couples.
Most married couples separate before filing for divorce, and some separated couples may never legally
divorce. Moreover, since the share of common-law couples—for whom divorce does not apply—has increased
from6% of all couples in Canada in1981to21% in2016, divorce statistics increasingly underestimate total
conjugal instability. This is particularly true in Quebec and the territories, where common-law unions are more
prevalent.
Although divorce statistics do not reflect all union dissolutions, they provide valuable information on the state of
marriage as an institution in Canada. They are also the only annual statistics available on union dissolutions,
since no official record is kept of the separation of married or common-law couples.
The2017General Social Survey on the family provides the most recent survey-based information on the
separation of married and common-law couples.
The2021Census of Population will provide statistical information on the number of Canadians currently
divorced, separated, married or living common law.
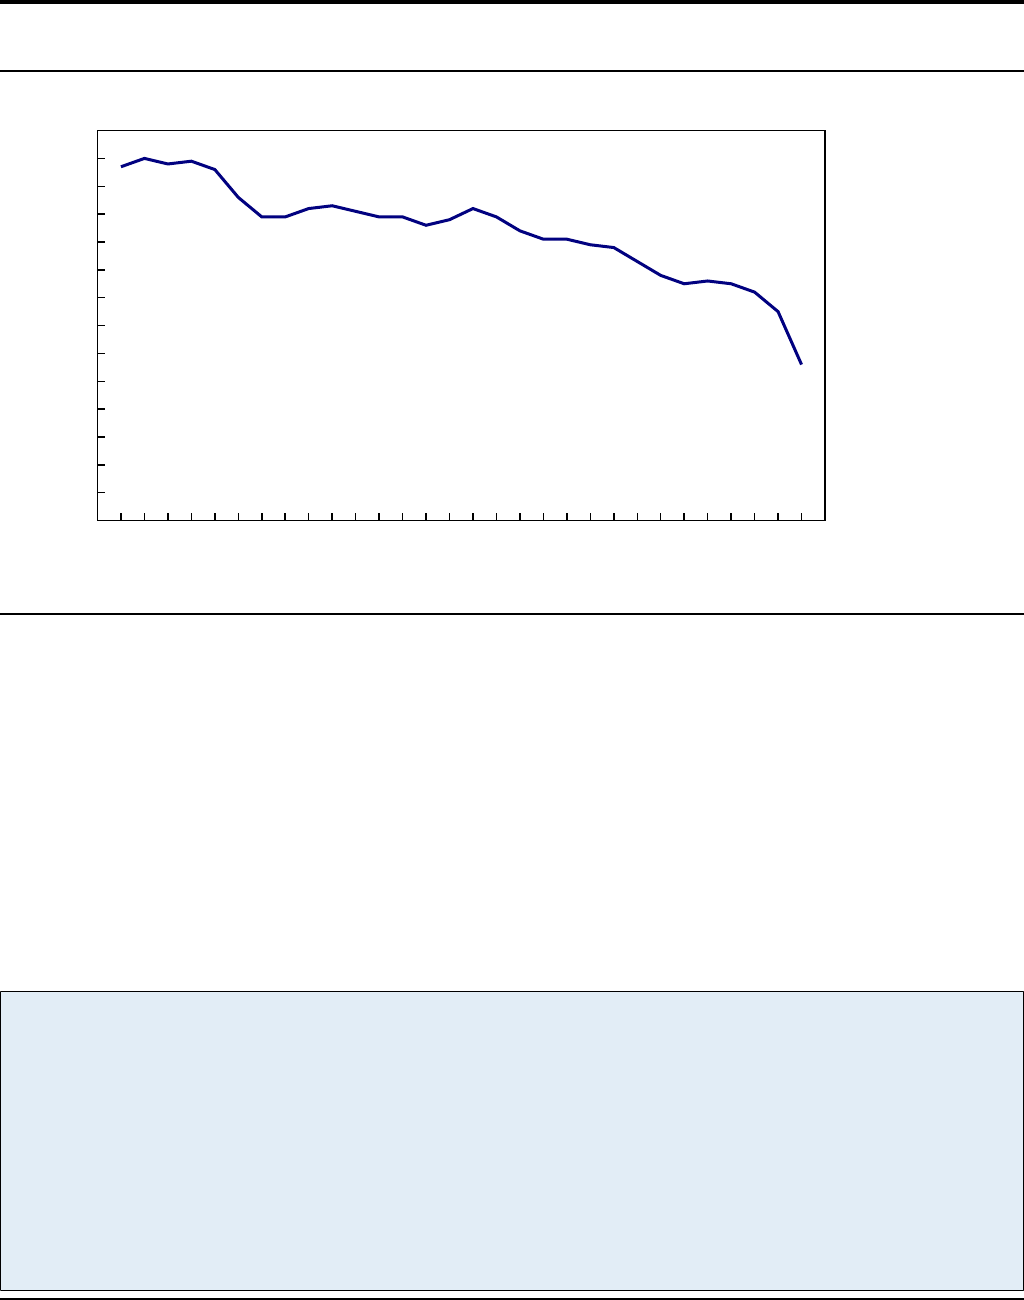
Falling divorce rate since1991is linked to the aging of the married population
The decrease in the number of divorces over the last three decades has occurred despite growth in the population
at risk of divorce, that is, married persons. As a result, the divorce rate—which corresponds to the number of
persons who divorce per1,000married persons—decreased from12.7per1,000in1991to7.5per1,000in2019,
and fell further to5.6per1,000in2020.
The Daily, Wednesday, March 9, 2022
Component of Statistics Canada catalogue no. 11-001-X
6
Chart 1
Steady decline of the divorce rate since1991
number of persons who divorced per 1,000 married persons, Canada
0
1
2
3
4
5
6
7
8
9
10
11
12
13
14
1991 1994 1997 2000 2003 2006 2009 2012 2015 2018
Source(s):Canadian Vital Statistics – Divorce Database (3235), table 39-10-0051-01.
Two key societal changes have contributed to the general decrease in the divorce rate observed over the last three
decades: aging of the married population and a lowered tendency to divorce among younger married adults in
particular.
The married population is getting older because of the general population aging, but also because younger
generations of Canadians are choosing common-law unions more often (see Box Divorce statistics reflect only part
of all union dissolutions) and, when they do marry, they do so at an older age than the generations that preceded
them. Since age-specific divorce rates are generally lower among older adults than among younger adults, the
aging of the married population has led to a decline in the divorce rate.
Also, age-specific divorce rates have not changed uniformly. While divorce rates among married persons younger
than50remain higher than those among older persons, they have declined markedly, especially in recent years.
Demographers and sociologists often attribute this decrease, also seen in other countries, to a growing selectivity of
marriage. That is, as proportionally fewer persons choose to marry, those that do might increasingly come from a
distinct subgroup that has some combination of characteristics that favours a long-lasting marriage.
New today!
Today, Statistics Canada unveils a series of new tables: Number of divorces and divorce indicators
(39-10-0051-01), Mean age and median age at divorce and at marriage, for persons who divorced in a given
year, by sex or gender (39-10-0052-01), Number of persons who divorced in a given year and divorce rate
per1,000married persons, by age group and sex or gender (39-10-0053-01), and Number of divorces and
divorce rate per1,000marriages, by duration of marriage (39-10-0054-01).
As part of Statistics Canada's commitment to increase Canadians' statistical literacy and to make this
information publicly available, the new tables offer users the ability to search, use and analyze information on
various indicators related to divorces.
The Daily, Wednesday, March 9, 2022
Component of Statistics Canada catalogue no. 11-001-X
7
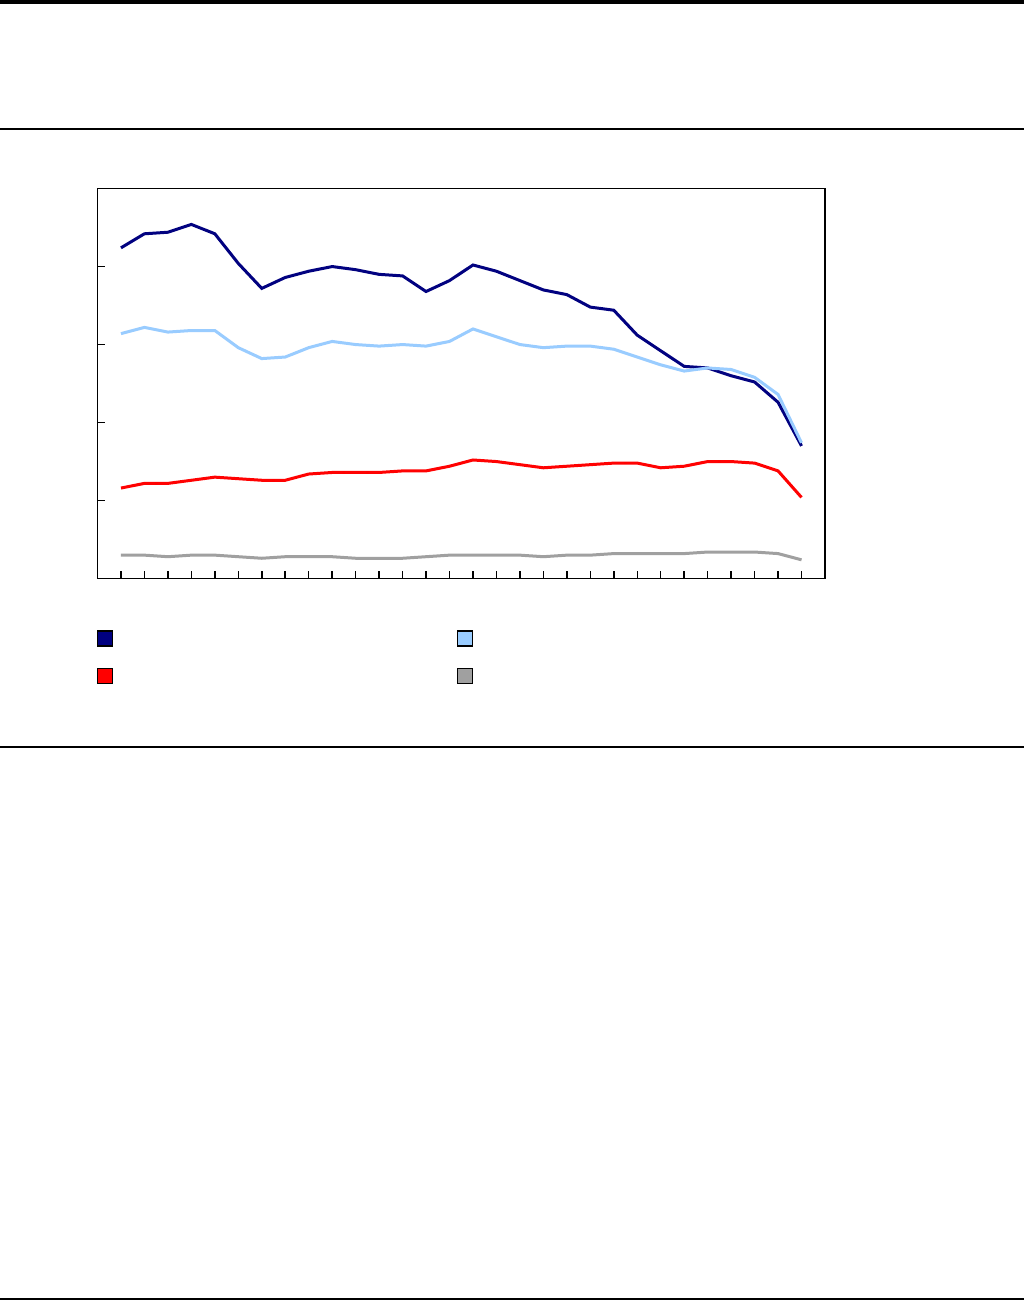
Chart 2
Over the last thirty years, age-specific divorce rates fell for young adults, but rose slightly for
older adults. The pandemic-related decrease in2020is observed in all age groups
number of persons who divorced per 1,000 married persons, Canada
0
5
10
15
20
25
1991 1994 1997 2000 2003 2006 2009 2012 2015 2018
15 to 34 years 35 to 49 years
50 to 64 years 65 years and over
Source(s):Canadian Vital Statistics – Divorce Database (3235), table 39-10-0053-01.
Growth in "grey divorce" halted
In comparison with younger adults, divorce among persons aged50years and older, sometimes dubbed "grey
divorce," remains a relatively rare event. The divorce rate in this age group did rise by26%
between1991and2006(from4.2to5.3per1,000) but has remained fairly stable since, notwithstanding the lower
values for2020. The rise of grey divorce in Canada, which coincided with the arrival of the baby-boom cohort into
this age group, was however quite modest compared with the doubling of levels observed in the United States over
a similar period.
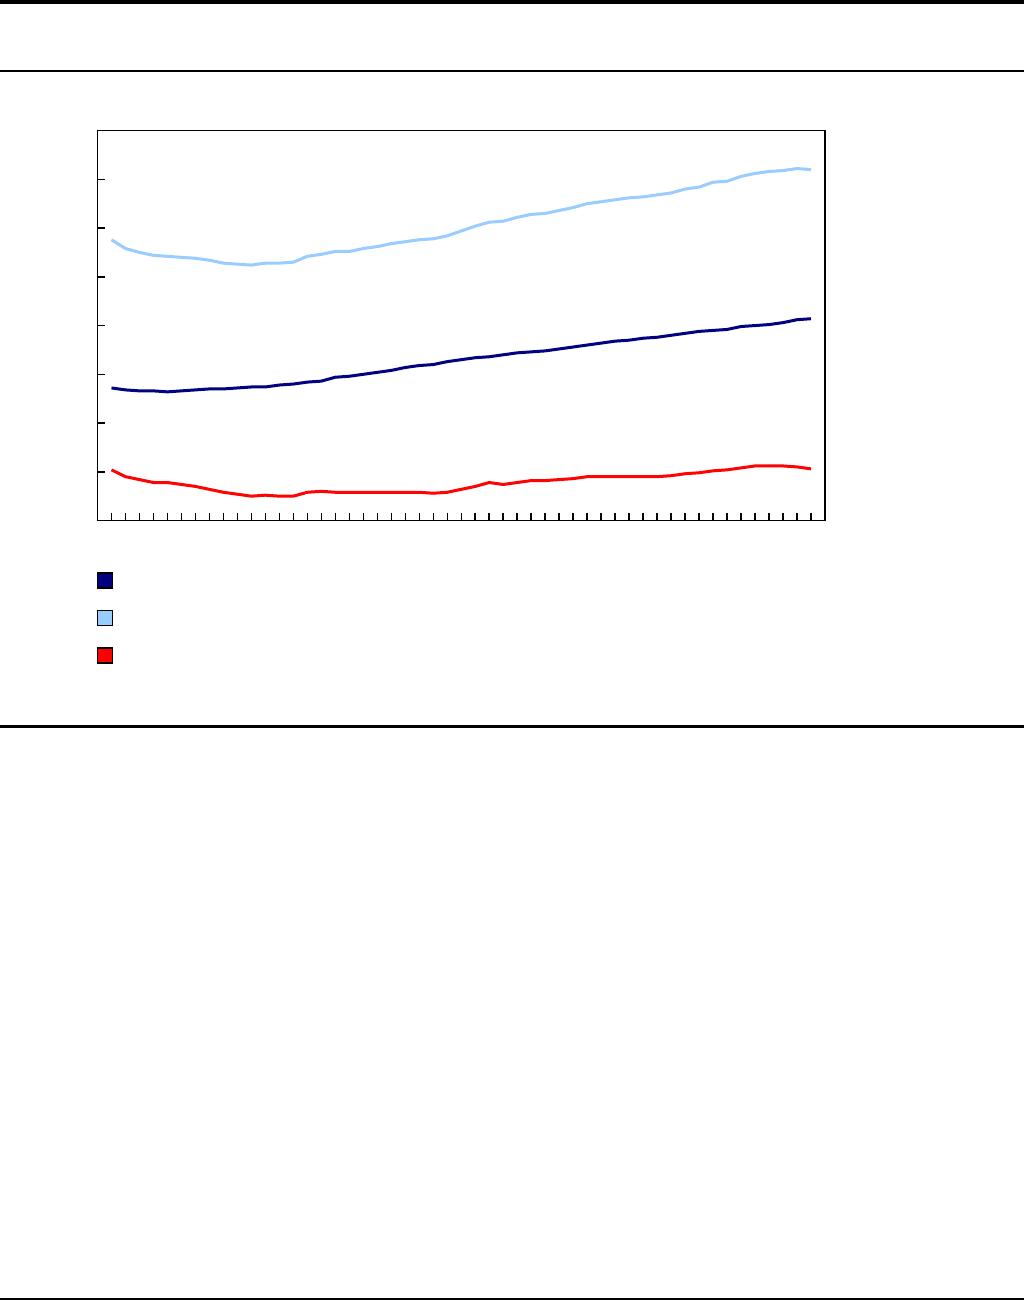
Divorces occurring at increasingly older ages
The average age at divorce has been rising almost continuously since it reached a low point of36.2years in1980.
More recently, it has been closer to46years.
This gradual increase in the average age at divorce is mainly the result of a continuous increase in the age at
marriage of those who divorce, but also of an increase in the duration of marriages ending in divorce.
The Daily, Wednesday, March 9, 2022
Component of Statistics Canada catalogue no. 11-001-X
8
Chart 3
Steady rise in the average age at divorce
mean age or mean duration in years, Canada
10
15
20
25
30
35
40
45
50
1970 1975 1980 1985 1990 1995 2000 2005 2010 2015 2020
Age at marriage of the persons who divorced
Age at divorce
Duration of marriage at divorce
Source(s):Canadian Vital Statistics – Divorce Database (3235), table 39-10-0052-01.
The average age at marriage for persons who divorced was23.7years in1980, increasing to30.7years in2020.
Similarly, the average duration of marriages ending in divorce rose from12.5years in1980to15.3years in2020.
Because women often marry at a younger age than men, women also divorce at a younger age. In2017, the latest
year for which this information is available nationally, the average age at divorce was44.5years for women
and47.0years for men.
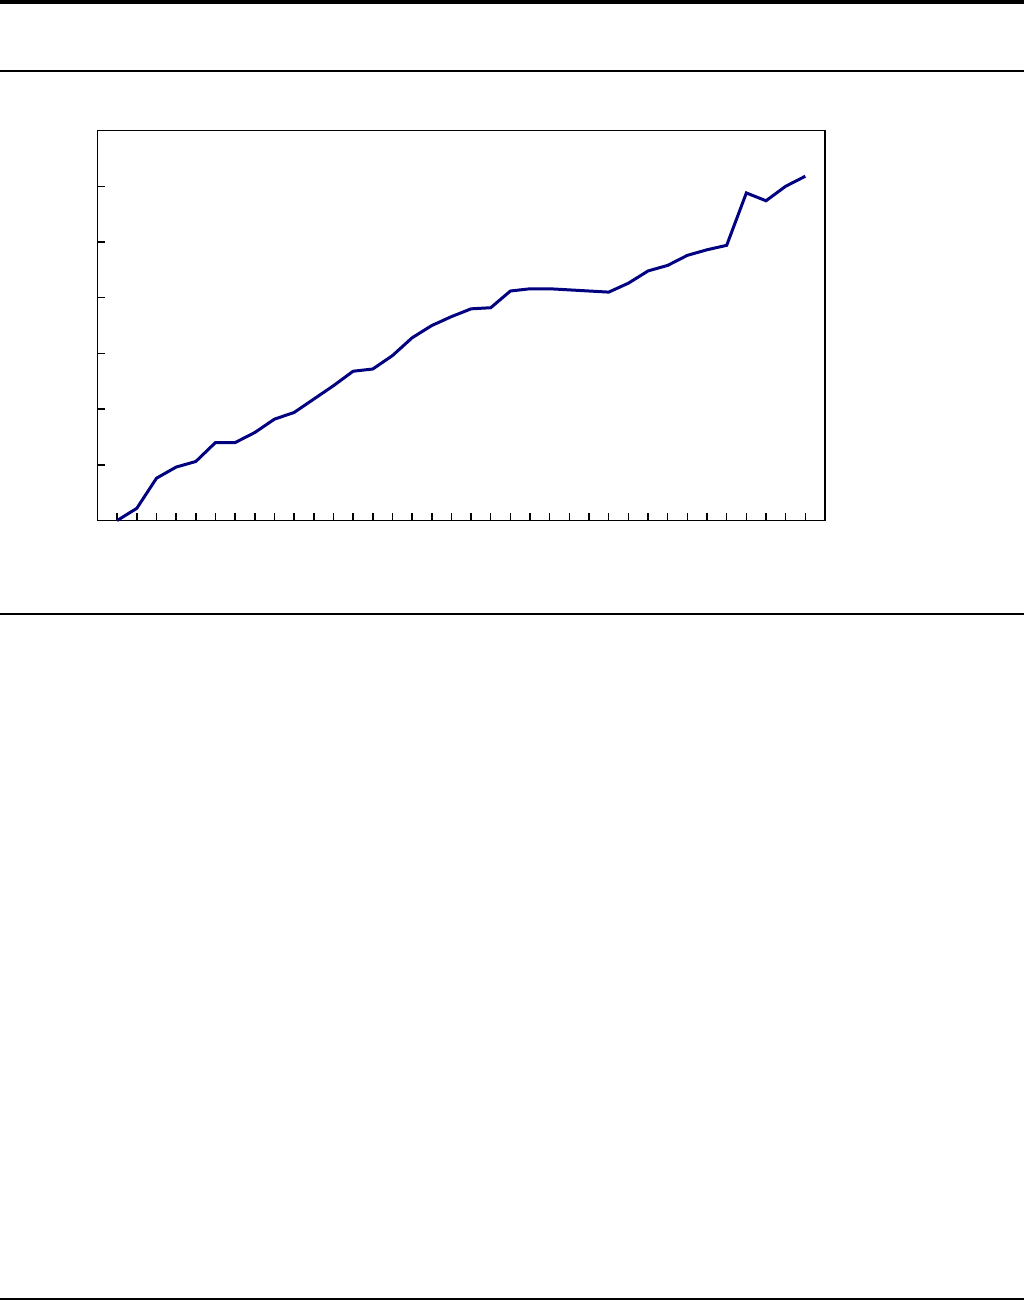
Almost one-third of divorces are now the result of a joint application by both spouses
Following the revision of the Divorce Act that came into force in1986, it became possible for both spouses to file
jointly for a divorce. The proportion of couples who file jointly has grown steadily from4% in1987to31% in2020.
This suggests a growing tendency among couples to mutually agree upon the broad terms of their divorce before
proceeding with a formal application to the courts.
The Daily, Wednesday, March 9, 2022
Component of Statistics Canada catalogue no. 11-001-X
9
Chart 4
Proportion of divorce applications filed jointly continues to increase
% of applications that are filed jointly, Canada
0
5
10
15
20
25
30
35
1985 1988 1991 1994 1997 2000 2003 2006 2009 2012 2015 2018
Source(s):Canadian Vital Statistics – Divorce Database (3235), table 39-10-0051-01.
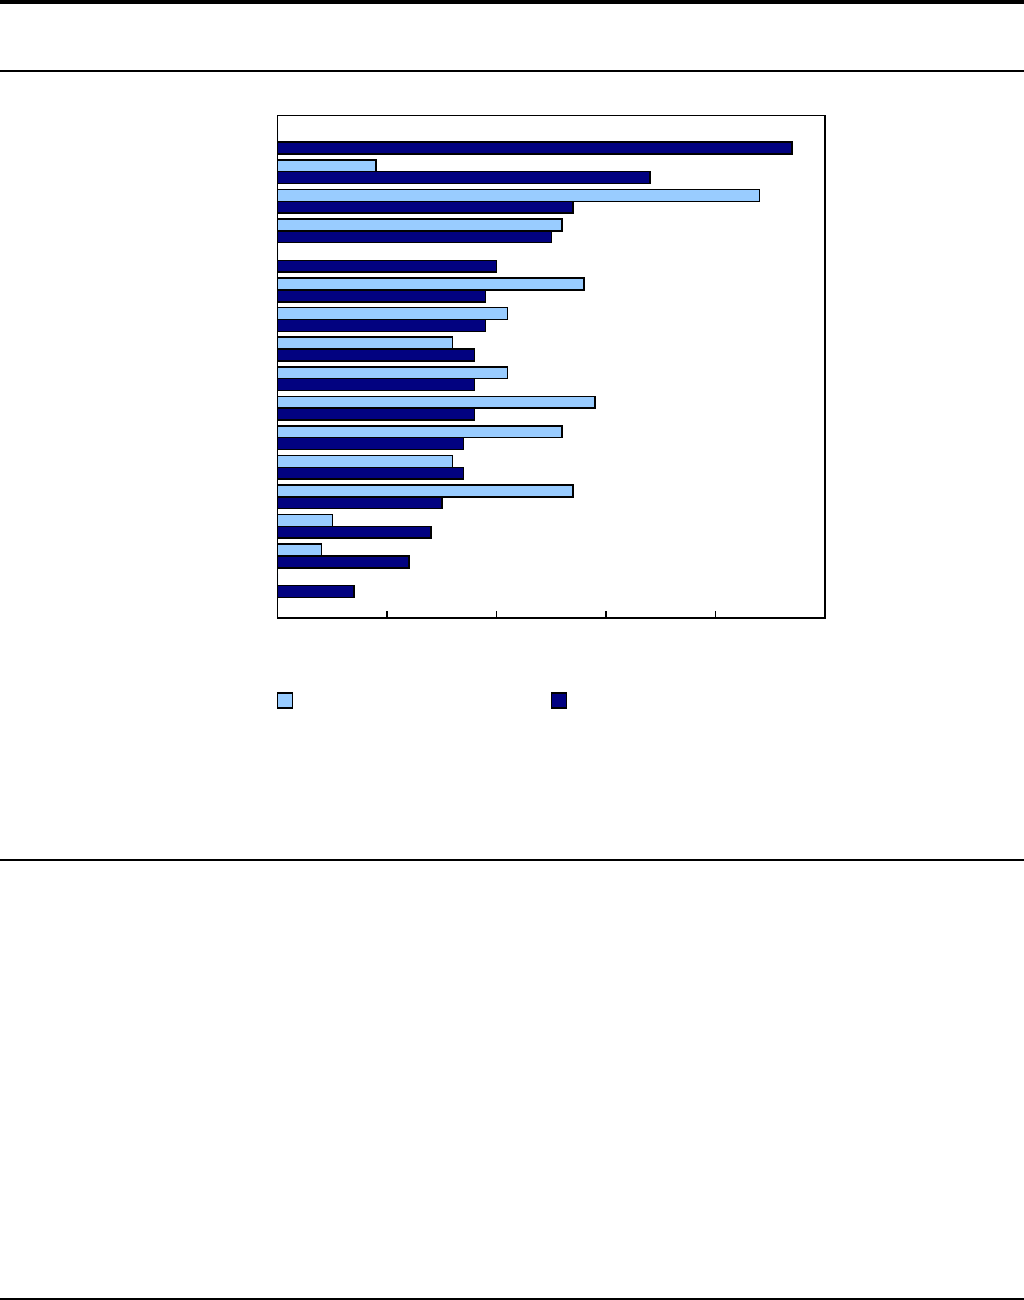
In2019, Canada has the second lowest crude divorce rate among G7countries
Given recent trends, Canada now has a comparatively low number of divorces. For instance, in2019, among
G7countries, Canada had the second lowest crude divorce rate (CDR) after Italy and a CDR44% lower than the
United States (the highest in the group). Canada's CDR was also below the average of the Organisation for
Economic Co-operation and Development (OECD) countries and of the European Union.
Note that these comparisons are based on the CDR, which corresponds to the number of divorces
per1,000persons (of all ages, married or not). While the CDR is the most widely available divorce indicator, it does
not account for international variations in the share of the population that is married and thus at risk of divorcing. For
instance, the large decline of the CDR in Canada between1995and2019is partly due to the growth of
common-law unions during this period.
The Daily, Wednesday, March 9, 2022
Component of Statistics Canada catalogue no. 11-001-X
10
Chart 5
From an international perspective, there are relatively few divorces in Canada
Russian Federation
China
United States
Sweden
OECD
Australia
France
European Union
Germany
United Kingdom
New Zealand
Japan
Canada
Italy
Mexico
Ireland
0 1 2 3 4 5
number of divorces per 1,000 persons
1995 2019
Note(s):Data presented for2019are from an earlier year for Russia (2013), France (2016), the United Kingdom (2016), Mexico (2018), and Ireland
(2017).2019data for the United States exclude the states of California, Hawaii, Indiana, Minnesota, and New Mexico. Data for the European Union are an average
of the27member states as of2020; the2019value is an estimate. Data for the Organisation for Economic Co-operation and Development (OECD) are an average
of36member states using data from previous years when2019was unavailable.
(...)not applicable
Source(s):Canadian Vital Statistics – Divorce Database (3235), table 39-10-0051-01,2020China Statistical Yearbook, Eurostat's divorce indicators, OECD's
marriage and divorce rates.
Wide but declining variation in divorce rates across the provinces and territories
Echoing the situation at the national level, the divorce rate for married persons followed a downward trend in every
province and territory from1991to2020. Although the variation in divorce rates between the provinces and
territories has decreased over time, there are still significant differences across the country. Over the5-year period
from2016to2020, the divorce rate was highest in Yukon (13persons divorced per1,000married persons) and
Alberta (10per1,000married persons), while it was lowest in Nunavut (2per1,000married persons) and
Newfoundland and Labrador (6per1,000married persons).

The Daily, Wednesday, March 9, 2022
Component of Statistics Canada catalogue no. 11-001-X
11
Table 2
Decline in divorce rates in all the provinces and territories in the last decades
1991 to 1995 2016 to 2020
number of persons who divorced per 1,000 married persons
Canada 12.8 7.7
Newfoundland and Labrador 7.9 6.2
Prince Edward Island 8.8 6.6
Nova Scotia 11.3 7.3
New Brunswick 9.4 7.4
Quebec 14.3 8.0
Ontario 12.2 7.2
Manitoba 11.4 7.1
Saskatchewan 10.6 7.7
Alberta 14.1 9.7
British Columbia 14.2 7.5
Yukon 17.7 12.8
Northwest Territories
1
11.0 7.5
Nunavut
1
11.0 2.4
1. For 1991 to 1995, Nunavut and Northwest Territories were a single territory.
Source(s): Canadian Vital Statistics – Divorce Database (3235).
Looking ahead
The number of divorces expected for2021will depend largely on two factors:1) whether the pandemic prompted a
lower or higher number of married couples to separate in2020than would have normally been the case, and2)
whether the family court system was able to process divorce applications at levels similar to pre-pandemic years or
even to surpass these levels to catch up on cases that were delayed in2020.
In2021, the first substantial amendments to the Divorce Act in over20years came into force. This revision, which
promotes the best interests of children, does not modify the grounds on which divorce can be sought. However, it
does encourage out-of-court dispute resolution, including family mediation, which could reduce the length of the
divorce process and increase the proportion of joint applications.
Note to readers
Today, Statistics Canada is releasing new data on divorces for the years2009to2020. Data for2019and2020are considered
preliminary and the number of divorces for these years may be underestimated. Revised data for the years1970to2008are also being
released.
These statistics are from the Canadian Vital Statistics - Divorce Database, a program that processes information collected from the
Department of Justice Canada's Central Registry of Divorce Proceedings (CRDP). The CRDP maintains a record of all divorce
applications filed with courts across the country since the Divorce Act came into force on July2,1968.
The information that the CRDP is mandated to collect from the courts has varied over the years. In2013, for example, the CRDP stopped
collecting data on the date of separation, reasons for divorce, number of dependents and parenting (child custody) arrangements.

The Daily, Wednesday, March 9, 2022
Component of Statistics Canada catalogue no. 11-001-X
12
Available tables:39-10-0051-01 to39-10-0054-01 .
Definitions, data sources and methods: survey number 3235.
For more information, or to enquire about the concepts, methods or data quality of this release, contact us
(toll-free1-800-263-1136;514-283-8300; [email protected]) or Media Relations
