STATISTICAL ANALYSIS OF HEBREWS 1
“Who Wrote the Epistle, God Only Knows”: A Statistical Authorial Analysis of Hebrews in
Comparison with Pauline and Lukan Literature
Benjamin Erickson
A Senior Thesis submitted in partial fulfillment
of the requirements for graduation
in the Honors Program
Liberty University
Spring 2024
STATISTICAL ANALYSIS OF HEBREWS 2
Acceptance of Senior Honors Thesis
This Senior Honors Thesis is accepted in partial
fulfillment of the requirements for graduation from the
Honors Program of Liberty University.
_________________________
Andrew Volk, M.S., M.Ed.
Thesis Chair
_________________________
Jillian Ross, Ph.D.
Committee Member
_________________________
James H. Nutter, D.A.
Honors Director
________________________
Date
STATISTICAL ANALYSIS OF HEBREWS 3
Abstract
The authorship of Hebrews has been a point of contention for scholars for the past two millennia.
While the epistle is traditionally attributed to Paul, many scholars assert that it carries thematic,
structural, and stylistic differences from the remainder of his extant epistles; therefore, many
other possible authors have been proposed. Of these, only Luke has other New Testament
writings. Therefore, this project conducts a statistical comparison of Hebrews to the Pauline and
Lukan corpora using stylometric authorial analysis methods. This analysis demonstrates that
Hebrews is stylistically closer to Lukan literature than Pauline (but not to a significant degree),
and thus concludes that Luke is a possible but not definite author (or possibly a co-author).
STATISTICAL ANALYSIS OF HEBREWS 4
“Who Wrote the Epistle, God Only Knows”: A Statistical Authorial Analysis of
Hebrews in Comparison with Pauline and Lukan Literature
The date was November 16, 2022. It was the final round of the Jeopardy! Tournament of
Champions, with three contestants locked in a heated battle to emerge as the season champion.
On this day, the third game of the final, the Final Jeopardy question read as follows: “Paul’s
letter to them is the New Testament epistle with the most Old Testament quotations”
(Willingham, 2022, para. 3). Sam Buttrey, the leader at the time, gave the answer “Who are the
Romans?”—and was deemed incorrect. No, according to the clue’s authors, the correct answer
was the one given by Amy Schneider—“Who are the Hebrews?”
This response immediately sparked a backlash of online controversy from Jeopardy! fans
and casual observers alike, centered around the clue’s assertion that Hebrews was a Pauline
work. Jeopardy! later defended the clue by asserting that they based it on the King James Bible,
which traditionally ascribes Hebrews to Paul (Willingham, 2022). Indeed, Hebrews was
traditionally attributed to Paul for the first millennium and a half of church history. But was this
justified? Should we consider the author of Hebrews to be Paul, or someone else, or is there
insufficient evidence in support of anyone?
This project seeks to answer that question statistically, analyzing the literary style of
Hebrews in comparison with other New Testament literature, to see if light can be shed on the
age-old debate of its authorship. First, a brief overview of the authorship question will be
presented. Then, the methodology of this study will be outlined and the foundational
mathematical principles explained. Finally, the results of the study will be presented and their
implications explored. Is statistical analysis—hard numbers—capable of lending weight to the
seemingly insoluble problem that has generated debate among biblical scholars for millennia? In
STATISTICAL ANALYSIS OF HEBREWS 5
order to answer this question, it is necessary to first outline background information on Hebrews
and its authorship.
Authorship of Hebrews
The book of Hebrews itself is replete with mystery in many ways: though categorized as
an epistle, it lacks an epistolary greeting, conclusion, and even explicit enumeration of an author
(Grindheim, 2023). Additionally, the moniker “Epistle to the Hebrews” is not canonical but
traditional, and so even its originally intended audience is unknown. Its plethora of Old
Testament references, unique structure, and plentitude of hapaxes (words used only once in the
New Testament) provide ample fodder for biblical scholars. In particular, the authorship of
Hebrews represents a long-standing open question within biblical studies. As early as the 200s
AD, the church father Origen delivered this famous exposition of the quandary (italics added):
But I would say that the thoughts are the apostle’s [Paul’s], but the diction and
phraseology belong to some one who has recorded what the apostle said, and as one who
noted down at his leisure what his master dictated. If then any church considers this
epistle as coming from Paul, let it be commended for this, for neither did those ancient
men deliver it as such without cause. But who it was that really wrote the epistle, God
only knows. The account, however, that has been current before us is, according to some,
that Clement who was bishop of Rome wrote the epistle; according to others, that it was
written by Luke, who wrote the Gospel and the Acts. (Eusebius, 1850, 6.25.11-13)
Origen states that, even by his time so early in church history, the authorship of Hebrews was
considered uncertain, despite its traditional attribution to Paul (referred to by Origen and others
of his time as “the apostle”). Indeed, throughout centuries of church history, Hebrews was often
categorized with the Pauline epistles, including to strengthen its canonical status early on
STATISTICAL ANALYSIS OF HEBREWS 6
(Ellingworth, 1993). It would certainly seem that the default authorial candidate should be the
author of almost half of the books of the New Testament (including the vast majority of the
epistles).
However, as pointed out by Origen himself, several issues underlie the belief that Paul
wrote the book of Hebrews. First, every Pauline epistle contains traditional features of a Roman
letter such as a greeting at the beginning and autobiographical information. However, Hebrews
lacks most of these features (Thompson, 2008). Additionally, many assert that the style and word
choice of Hebrews is dissimilar to that utilized by Paul in his other epistles (Wagner, 2010). For
example, Hebrews frequently utilizes the hortatory subjunctive (“let us”) instead of the typical
Pauline imperative (Thompson, 2008). Finally and perhaps most significantly, Hebrews seems
(based on internal evidence) to have not been written by one who had been directly taught by
Christ. Hebrews 2:3 reads in part, “[The message of salvation] was declared at first by the Lord,
and it was attested to us by those who heard” (English Standard Bible, 2001). The author of
Hebrews clearly classifies himself as a second-degree recipient of the gospel, not as one who
heard it directly from Jesus’ lips. Paul, however, clearly does consider himself a direct
eyewitness of Christ’s resurrection and one who was taught by him. He says in Galatians 1:11-
12, “For I would have you know, brothers, that the gospel that was preached by me is not man’s
gospel. For I did not receive it from any man, nor was I taught it, but I received it through a
revelation of Jesus Christ.” This would seem to preclude Paul excluding himself from “those
who heard.” Nevertheless, this fact does not provide a final nail in the coffin, due to some debate
surrounding the word ἐβεβαιώθη (Aland et al., 2014, Hebrews 2:3). Although this word is
translated as “attested” by the ESV, it can also mean “confirmed,” thereby not necessarily
excluding the author from having heard the gospel firsthand as well (Danker, 2000, p. 99).
STATISTICAL ANALYSIS OF HEBREWS 7
However, most scholars would assert that this provides at least some evidence against Pauline
authorship.
This evidence against Paul leaves the field wide open, and indeed many other possible
authors for Hebrews have been proposed: Luke, Clement of Rome (both referenced by Origen),
Apollos (Martin Luther’s favorite possibility), or Barnabas (favored by the church father
Tertullian), among others (Wagner, 2010). One modern theory even asserts that Priscilla could
have written Hebrews, a creative suggestion that meets its unfortunate demise when the author
refers to himself with a masculine participle (διηγούμενον) in Hebrews 11:32 (Griffith, 2005).
Other biblical scholars have propounded hybrid theories that involve co-authorship,
dictation and editing, or the use of an amaneusis (scribe). Origen himself seems to have hinted at
this possibility with his statement that the ideas of Hebrews were Pauline but that they were
possibly written by another (Thomas, 2019). The most popular of these theories holds that
Hebrews consists of content that was preached by Paul on one of his missionary journeys, then
written down and edited by Luke. Several pieces of evidence support this possibility. First, it is
known from the book of Acts that Luke and Paul traveled together, based on the fact that Luke
switches to first-person pronouns beginning in Acts 16:6. Therefore, Luke would have had ample
opportunity to hear Paul preach many times, and he likely would have recorded much of what
Paul said to gain material for what ended up becoming the book of Acts. Additionally, this would
make sense of the fact that Hebrews utilizes the most Old Testament references of any epistle
since Paul, as a result of his Jewish upbringing, would have been extremely well-versed in the
Old Testament and would have referenced it liberally in his sermons to Jewish audiences.
Moreover, this theory explains the overall structure of Hebrews: alternating sections of
exposition and application, followed by a larger application at the end.
STATISTICAL ANALYSIS OF HEBREWS 8
Authors Analyzed
Of the panoply of possible penners, only Paul and Luke wrote other extant New
Testament literature that could serve as a point of comparison for Hebrews. Therefore, these two
authors will be considered in this study. For each, a corpus (conglomerated body of all writings)
will be created. The Pauline corpus will be considered to consist of the thirteen epistles explicitly
attributed to Paul (though some are disputed by critical scholars). The Lukan corpus will consist
of Luke and Acts. Hebrews will be compared to these corpora using methods from stylometry.
Before proceeding with the methodology and results of the study, it is necessary to gain a broad
overview of stylometry and its associated data analytical techniques.
Stylometry
Stylometry—the statistical analysis of literary style—has exploded onto the scene in the
past few decades as a method of literary analysis and authorship attribution. It has been utilized
for such wide-reaching applications as analyzing the Federalist Papers (Mosteller & Wallace,
1963), Shakespeare plays (Craig & Kinney, 2009), Beatles songs (Whissell, 1996), and many
others. Before applying this technique to Hebrews, it is necessary to explicate the mathematical
underpinnings for stylometry. The basic process of stylometry consists of representing each
relevant text as a vector, measuring the distance between pairs of vectors, and exploring the
resulting distances in an attempt to discover patterns in the textual data.
Tokenization
The initial step in stylometry is the tokenization of the corpus of texts in question
(Stamatatos, 2009). This consists of stripping the corpus of punctuation and capitalization,
thereby leaving the rudimentary source text. This reduced text is then split into tokens, which can
be whole words or sequences of m consecutive letters (typically m = 2 or 3, referred to as
STATISTICAL ANALYSIS OF HEBREWS 9
bigrams and trigrams, respectively), depending on the particular analysis being performed. The
tokens are then ranked by proportional frequency of appearance within the corpus. Each specific
stylometric analysis then considers the n most frequently appearing tokens within the corpus
(typically 50 ≤ n ≤ 500).
After this, the proportional frequencies of each of these n tokens in each text under
consideration is determined (Stamatatos, 2009). From these n frequencies, an n-dimensional
vector is constructed for each individual text, with each component corresponding to the token
with that frequency rank in the corpus. For example, if “and” is the second most common word
in the corpus, and Text A has a frequency of 0.08 for “and,” then the second component of Text
A’s vector would be 0.08. Once these vectors have been constructed, each component is
separately standardized across all texts in the corpus and replaced by its z-score. For example, if
Text A’s proportional frequency for “and” is one standard deviation above the mean frequency of
“and” across all texts, its second component would now be 1. This ensures homogeneity of
comparison across iterations of the stylometry algorithm and variation of texts under
consideration. The result of applying this procedure is that each text under consideration is now
represented by a vector in n-dimensional space, where n is the number of tokens under
consideration in the stylometric analysis.
Vector Distance
Once texts have been converted to standardized vectors, meaningful comparison between
texts can be performed by comparing their representative vectors. This comparison typically
consists of calculating the pairwise distance between all combinations of two vectors in the
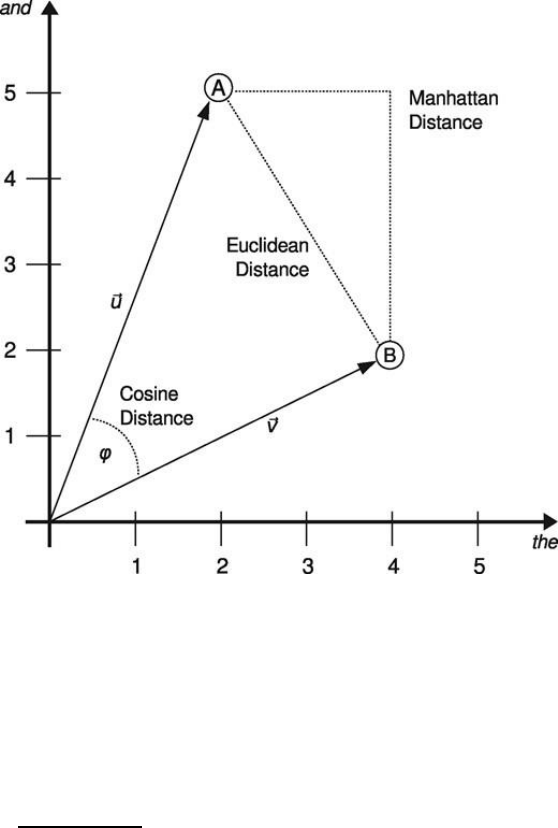
corpus (Burrows, 2002). This distance can be calculated in several basic ways, displayed in
Figure 1.
STATISTICAL ANALYSIS OF HEBREWS 10
Figure 1
Visualization of Distance Metric Possibilities
Note. This graph displays several methodologies of computing the distance between two
vectors. From “Understanding and explaining Delta measures for authorship attribution,” by
S. Evert et al., 2017, Digital Scholarship in the Humanities, 32, p. ii7.
The first way to calculate vector distance is the standard Euclidean distance between vectors,
, corresponding to the L
2
norm of the difference vector. This is the most intuitive
conception of distance; it simply represents the straight-line distance between the heads of the
vectors in n-dimensional space. Another possible and frequently used distance metric, however,
is the Manhattan distance (so named for its resemblance to city blocks). This is calculated by
, and corresponds to the L
1
norm of the difference vector. It essentially considers the
vector differences in each dimension separately, then sums them across all dimensions. Finally,

STATISTICAL ANALYSIS OF HEBREWS 11
the cosine distance between two vectors is (intuitively enough) the cosine of the angle between
them, calculated by
. This is equivalent to normalizing the vectors by length
and taking the Euclidean distance between them (Evert et al., 2017).
These basic distance metrics also form the foundation for more complex distance metrics
utilized in stylometry that take into account the context of these vectors. The distance metric
utilized in this study is Eder’s Delta (Eder, 2015), which weights earlier components in the
vectors more heavily, based on the fact that they represent more frequent (and thus often more
important) words. This distance metric is frequently utilized for highly inflected languages
(languages in which words assume spelling changes such as affixes, prefixes, or stem changes to
reflect their grammatical categories), such as biblical Greek (Eder and Górski, 2022). In inflected
languages, more common words (such as conjunctions and prepositions) are much less likely to
be inflected, thus encoding more information about an author’s tendential word usage; therefore,
it is logical to weight them more heavily in analysis of authorial style.
Once a distance metric is prescribed, the pairwise distance Δ is calculated between all
texts in the corpus under consideration (Evert et al., 2017). These pairwise distances are then
loaded into an N x N dissimilarity matrix M (N the number of texts in the corpus), where M
ij
=
Δ(x
i,
x
j
) (x
n
the n
th
text in the corpus). This dissimilarity matrix forms the backbone for the
statistical analysis conducted on the corpus. This specifically takes the form of unsupervised
learning techniques, a general term for statistical models describing data with no response
variable. These techniques are appropriate in this setting because, rather than trying to predict a
specific characteristic of texts in the corpus, the goal is merely to determine their degree of
similarity to one another. Two such techniques broadly utilized in stylometry are principal
component analysis (abbreviated PCA) and hierarchical clustering. These two methodologies
STATISTICAL ANALYSIS OF HEBREWS 12
will be discussed and their relative strengths and weaknesses analyzed, particularly in a
stylometric setting.
Principal Component Analysis
PCA is a method for distilling high-dimensional data into a low-dimensional
representation capturing the maximum possible amount of information (James, 2013). Each of
these dimensions is referred to as a “principal component” of the data. The first principal
component is obtained by finding the maximum-variance linear combination of the p features:
where this combination is normalized by the constraint
. The coefficients
are
referred to as the loadings of the first principal component. Once the first principal component
has been calculated, all the variance it represents is removed from the data, and the second
principal component is calculated in the same way on the de-varianced data. This process is
continued until it is determined that a sufficient percentage of the total variance has been
explained.
PCA is utilized for several applications in statistical analysis more broadly (James, 2013).
First, it is frequently applied to reduce the number of features in model development. Rather than
including every feature from the original dataset, a model will only include the first few principal
components, simplifying the model and eliminating multicollinearity. A weakness of PCA in this
setting, however, is that the resulting model can be difficult to interpret due to the additional
obfuscation provided by the PCA loadings. Additionally, PCA is frequently utilized as a pattern-
finding and visualization tool, which is its most common application in a stylometric setting due
to its conduciveness to unsupervised learning. Recall, in the setting of stylometry, every feature
of the original data is nothing more than standardized word frequencies in each text under
STATISTICAL ANALYSIS OF HEBREWS 13
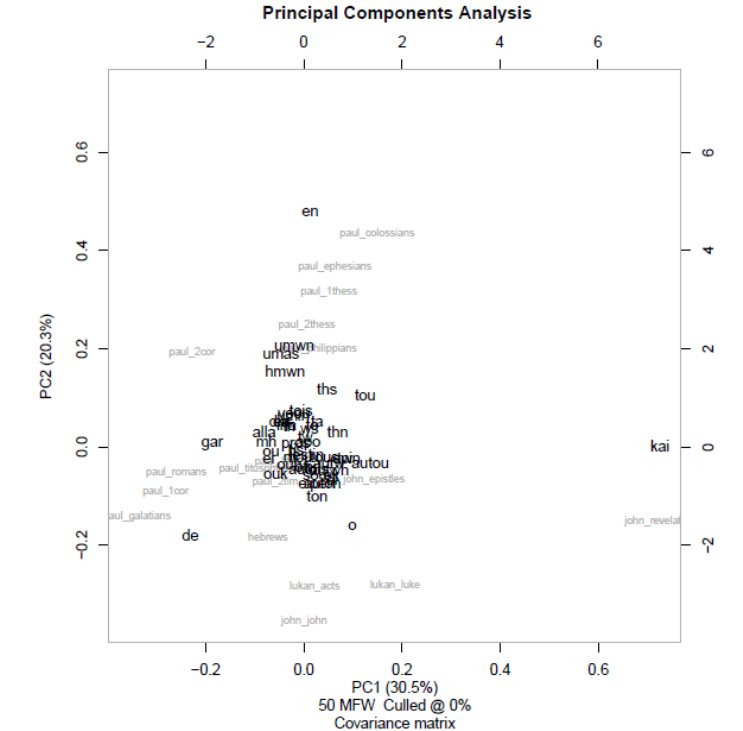
consideration. Therefore, the loadings of PCA assign principal component scores to both the
words and the texts, allowing both to be visualized together. An example is displayed in Figure 2.
Figure 2
Example of PCA
Note. This graph demonstrates principal component analysis. Each of the two dimensions
represents one principal component of the data, and data points’ proximity on the graph tends to
be indicative of proximity within the data set. Produced using the stylo package in R.
STATISTICAL ANALYSIS OF HEBREWS 14
This displays a PCA of words and biblical books on the same graph. This style of two-
dimensional visualization easily lends itself to viewing clusters or patterns that may be present in
the data but difficult to discern from the raw high-dimensional data.
Principal component analysis in the setting of stylometry has several key strengths and
weaknesses (James, 2013). One strength, discussed above, is its ability to produce meaningful
and informative visualizations. Another is its ability to investigate the tendential usage of words
for different texts, due to comparison of the principal component loadings (for the words) and
scores (for the texts); this is typically most effective when using a larger number of principal
components. This breakthrough was reached when stylometry researchers began applying PCA
to vectors of words rather than text blocks (Binongo & Smith, 1999). Another is its stability: it is
not highly sensitive to hyperparameters such as distance metric, number of most frequent words,
and others. However, PCA does bring the weakness of its inability to break data into clusters, an
unfortunate drawback for stylometry in which the goal of analysis is often authorship attribution
(which involves classification into clusters or categories).
Cluster Analysis
Another unsupervised learning technique popular in stylometry is cluster analysis.
Several types of cluster analysis are regularly performed in statistical settings (James, 2013).
One, K-means clustering, assigns a specific number of clusters to the data. Each data point is
initially randomly assigned to a cluster. Then, in the first iteration, each point is moved to the
cluster whose centroid it is closest to. This process continues until the clusters stabilize. This
algorithm is relatively stable as far as its cluster assignments; however, it comes with the
disadvantage of requiring the number of clusters to be specified in advance.
STATISTICAL ANALYSIS OF HEBREWS 15
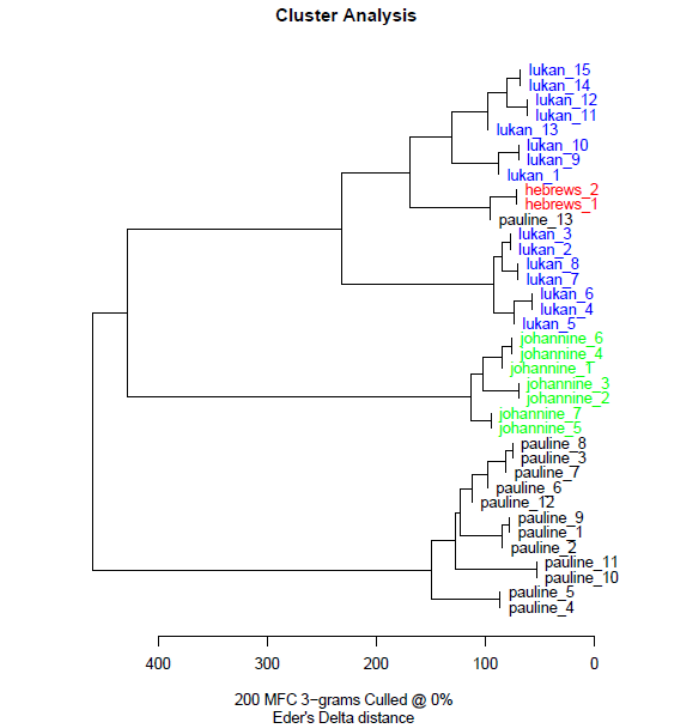
Figure 3
Example of Cluster Analysis
Note. This graph displays hierarchical clustering. Data points clustered together tend to be closer
together in the data set. Produced using the stylo package in R.
The other algorithm, far more popular in stylometric analysis, is hierarchical clustering
(James, 2013). Hierarchical clustering begins with every observation as its own cluster. Then, in
every step, it fuses the two closest clusters, and the distance between them is recorded. This
continues until there is just one cluster containing all the observations. The various fusion
heights for the different clusters lend themselves to a visualization known as a dendrogram,
demonstrated in Figure 3. The horizontal axis represents the distance at which the particular
STATISTICAL ANALYSIS OF HEBREWS 16
cluster in question is joined, beginning from the leaves on the right and culminating in the single
large cluster containing all observations (note: the colors are not utilized in clustering; they are
merely for visualization). Unlike K-means clustering, hierarchical clustering can produce any
desired number of clusters based on the distance at which the clusters are “cut.” For example, in
Figure 3, a cut height of 300 yields three clusters, while a cut height of 200 yields four clusters.
Hierarchical clustering is where the choice of vector distance described earlier comes to bear
most prominently, due to the fact that cluster formation is completely dependent on the distance
between clusters as measured by the chosen distance metric. This makes the selection of metric
and justification thereof extremely vital.
Like PCA, and indeed any statistical analysis technique, hierarchical clustering presents
several characteristic strengths and weaknesses (James, 2013). Its first strength, like PCA, is its
robust visualization ability. It concisely displays the distance between observations in the data
set, as well as how they agglomerate and the relationships between these agglomerations.
Another strength is its fairly obvious ability to split observations into clusters, which is
indispensable for stylometric techniques that attempt to categorize texts into several “buckets” or
clusters based on authorship. However, it also has several critical weaknesses that must be borne
in mind. The first is its instability—it is extremely sensitive to small changes in the
hyperparameters (such as distance metric, linkage type, etc.). Additionally, in the context of
unsupervised learning, the clusters are extremely difficult to verify, making it hazardous to draw
many definitive conclusions from a cluster analysis.
Concluding Summary of Stylometry
Stylometry is a technique used to statistically analyze literary style by representing
various literary texts as vectors of words, then calculating the distance between those vectors to
STATISTICAL ANALYSIS OF HEBREWS 17
determine how stylistically different two texts are. An examination of the statistical techniques
often utilized in stylometry demonstrate that they have many strengths making them conducive
to a stylometric setting, and thus provide robust and meaningful insight into textual data,
provided their various weaknesses are appreciated and dealt with adequately. Before describing
how these techniques were applied to Hebrews, it is necessary to more broadly examine
statistical analyses that have been performed on biblical literature.
Biblical Statistical Analysis
Statistical analysis of biblical literature is not unprecedented; indeed, a plethora of studies
have purported to draw insights about biblical literature, particularly authorship, from statistical
analysis. Such analysis can take several specific forms. First, and perhaps most common, is the
study of characteristic words (i.e. words that are utilized by only one New Testament author, or
in only one New Testament book). This includes studying the proportion of hapaxes (words used
only once in the NT) in each book. It also includes considering words used far more by one
author than another. An example of this type of study is a general analysis of Hebrew hapaxes
by Frederick Greenspahn (1980). Second, another class of studies considers characteristic
grammatical features, such as the prevalence of participles or imperatives in a particular author’s
writing. A characteristic example of this brand of analysis is Michael Hayes’ (2018) study of
relative clauses and attributive participles.
Nevertheless, these varieties of statistical analysis are rather naïve compared to the
holistic approach considered by stylometry since they are by nature ad hoc and consider only a
singular aspect of the text. Analysis of hapaxes overlooks the fact that the precise definition of a
hapax is somewhat nebulous and varies among different biblical scholars (Van Nes, 2018a).
Additionally, authors may utilize a word only once because it is a proper noun or because they
STATISTICAL ANALYSIS OF HEBREWS 18
are quoting or referencing an older text such as the Septuagint. In contrast, stylometry examines
the tendential word usage of authors, thereby yielding a more complete authorial fingerprint and
more apples-to-apples comparison. In view of this, stylometric analysis gives textual insight that
cannot be yielded by more rudimentary statistical techniques. Biblical stylometric analysis has
been performed, but it is rare. One example is a broad study by Kenneth Royal that attempts to
examine New Testament authorship using fairly rudimentary stylometric techniques (2012).
These statistical analysis techniques are most commonly utilized to test purported Pauline
literature, examining if biblical books that bear Paul’s name were in fact written by him. This
research is typically performed by scholars in a critical scholarship tradition who hold that many
books of the New Testament were pseudonymous. An example is a study by Jermo van Nes
(2018b) on the Pastoral Epistles that compares them to the remainder of the Pauline corpus.
Sometimes, as in the case of the Van Nes study, Paul is assumed to be an author of a particular
subset of his corpus, and the remaining epistles are evaluated on this basis (Van Nes, 2018b).
However, no studies have used these techniques to analyze Hebrews based on the assumption
that Paul did in fact write all epistles bearing his name. Therefore, this analysis fills a significant
gap in the existing research in both its methodology and its focus.
Methodology
The Greek text of the New Testament required some manipulation in order to be readied
for stylometric analysis. The source of the Greek text was the sacred package in R (Coene).
This provided the entire text of the Greek New Testament in an easily-manipulable format. The
raw text was first stripped of punctuation, accent marks, and breathing marks, in order to more
accurately categorize the tokens appearing in each text. Accent marks and breathing marks were
removed because they can shift depending on the specific form of the word under consideration;
STATISTICAL ANALYSIS OF HEBREWS 19
therefore, retaining them would differentiate tokens that should not be differentiated. An example
is an enclitic, which is a word that in certain situations is unaccented and pronounced with the
previous word (Baker, 2010). The text was then transliterated into the English alphabet utilizing
a bijective transliteration technique so no information was lost or gained. As a result, some letters
were transliterated in a non-traditional way (e.g., φ as f, η as h, etc.), but this was necessary for
full textual compatibility.
After transliteration, other textual transformation techniques were considered. One such
technique was stemming, in which each word is replaced by its characteristic “root” word. This
is beneficial because it paints a clearer picture of the true vocabulary choices made by authors,
particularly for heavily inflected languages such as biblical Greek. However, the decision was
made to not utilize stemming because it eliminates information about the specific form of words
used (e.g. the case of nouns, tense of verbs, etc.). This information can capture another aspect of
authorial style and thus was deemed worthy of retaining in this analysis. Essentially the same
task as stemming can be accomplished by considering n-grams (i.e., sequences of n consecutive
letters, not full words) because these often reflect the root portion of a word.
Once the original text had been transformed, the actual analysis was performed using the
R stylo package, utilized for stylometric analysis (Eder et al., 2016). This package was
developed by a team of quantitative linguists in 2016 in order to perform common stylometric
analyses quickly and easily. It features an intuitive graphical user interface for exploratory data
analysis and various outputs, including distance tables and several often-used graphs.
The texts under consideration in this analysis were the Pauline corpus, the Lukan corpus,
Hebrews, and the Johannine corpus. The Johannine corpus was included as a reality-check point
of comparison, since biblical scholars do not posit that John wrote Hebrews. Thus, if Hebrews
STATISTICAL ANALYSIS OF HEBREWS 20
corresponds more closely to the Johannine corpus from a stylometric standpoint than to the
Pauline or Lukan, this would provide reasonably strong evidence that neither Paul or Luke
authored Hebrews.
Results
Analysis Macro-Parameters
Comparative analysis was performed in three ways based on how the literature was split.
An extremely zoomed-out approach was first taken that examined the individual corpora as
complete entities. This left only four “texts” in the corpus to analyze (the Pauline, Lukan, and
Johannine corpora plus Hebrews). This zoomed-out approach yielded some insight but failed to
supply a comprehensive picture, so more granularity was added by examining each individual
book separately (with some shorter books, such as the Johannine epistles and Titus/Philemon,
combined to create an adequate sample size within each book). This separation by book gave an
opportunity for significant insight into the effectiveness of stylometry when applied to biblical
literature. Specifically, it allowed a test of whether books known to have been written by the
same author were in fact categorized together. If this were not the case, it would cast serious
doubt on whether any insight whatsoever could be yielded from this analysis. Separation by book
would also help answer the question of whether, in the process of inspiration, authorial
distinctions and unique styles were preserved. Finally, a further level of detail was added by
obtaining systematic samples from each book and comparing them. This allowed for further
internal comparison of authorial corpora, as well as an examination of how internally consistent
each individual book was with respect to word choice.
The texts were also tokenized in several different ways: by words, by bigrams (sequences
of two letters), and trigrams (sequences of three letters). These synergized to provide a
STATISTICAL ANALYSIS OF HEBREWS 21
reasonably comprehensive picture of word choice, case and tense markers, and other word
features. Once the textual breakdown was determined, investigation was primarily performed
through the aforementioned unsupervised learning techniques of cluster analysis and principal
component analysis.
Results—Complete Corpora
The picture yielded by lumping all texts in a corpus together is helpful in some ways due
to the large-scale insight it yields and the comparison of the corpora as complete entities.
Nevertheless, because only four entities are under consideration, visualization methods such as
PCA and hierarchical clustering are distinctly unhelpful. Far more useful is an examination of the
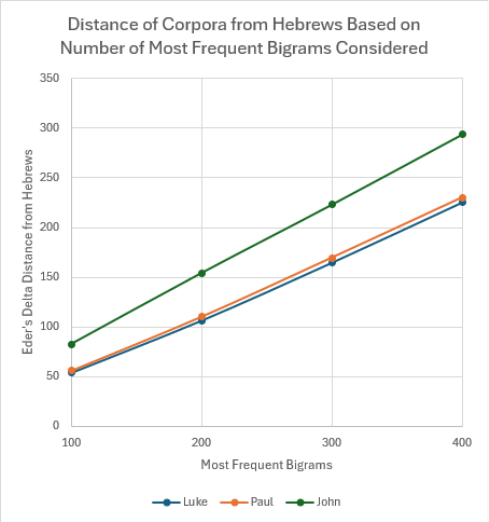
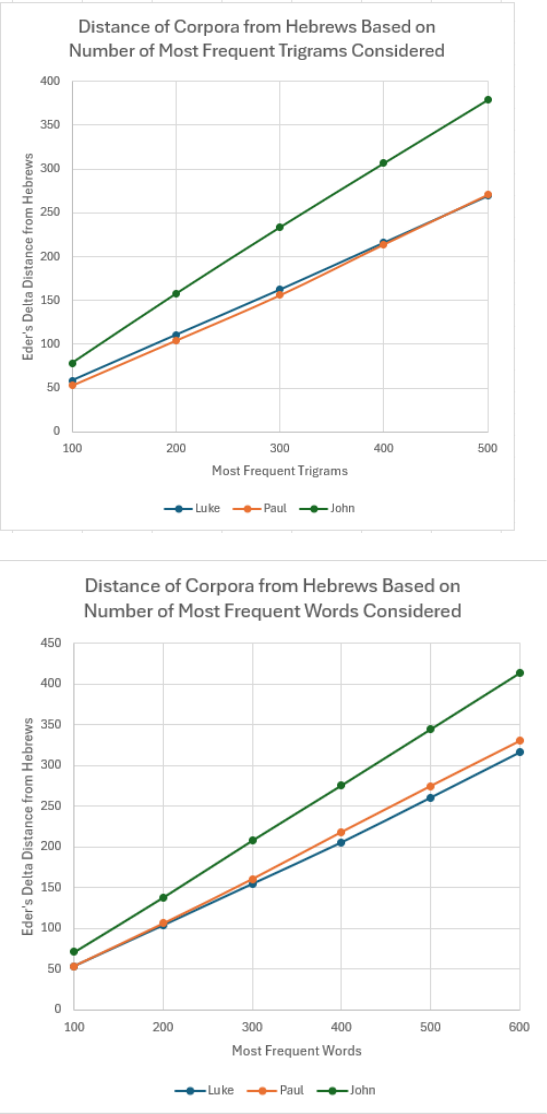
distance metrics between texts, specifically between Hebrews and all other corpora. Figure 4
displays the Eder’s Delta distances produced by analyzing various numbers of most frequent
words, bigrams, and trigrams.
Figure 4
Dissimilarity Between Hebrews and Lukan, Pauline, and Johannine Corpora
STATISTICAL ANALYSIS OF HEBREWS 22
Note. In each graph, the x-axis displays the number of most frequent tokens considered in each
analysis. The y-axis represents the Eder’s Delta dissimilarity between Hebrews and the corpus
indicated by the dot and line color (lower value indicates more similar to Hebrews).
STATISTICAL ANALYSIS OF HEBREWS 23
Hebrews’ level of similarity to the Pauline and Lukan corpus is extremely close. The
Lukan corpus is overall slightly more similar to Hebrews, but the margin is narrow and reverses
slightly when trigrams are under consideration. This yields the analysis inconclusive across all
frequency levels and all tokenizations. Unsurprisingly, the Johannine corpus displays an
extremely large level of dissimilarity to Hebrews by all metrics. This comparison is useful
because it considers the entire scope of an author’s writing in the New Testament, allowing the
broadest possible point of comparison for Hebrews to an author’s overall writing style. However,
comparing Hebrews to the entirety of the authors’ corpora clearly leaves much to be desired both
in conclusiveness and in granularity of insight. Therefore, it was determined that it would be
beneficial for the scope of consideration to be narrowed somewhat.
Results—Individual Books
Perhaps the most fascinating results are derived from an analysis of individual New
Testament books. As stated earlier, some books (Titus/Philemon and the Johannine epistles) were
combined to create an adequate sample size within each text. In this setting, the most insightful
results were derived from cluster analyses, due to this providing a coherent overall picture of
how all texts under consideration relate to one another. Although a relatively unstable
unsupervised learning technique (as referenced earlier), it can yield legitimate insights,
particularly if it is re-run with parameter variation, as it was in this case. As with complete
corpora, this analysis was performed with bigrams, trigrams, and words, as well as with various
numbers of each in hopes of providing a complete snapshot of how individual books compare.
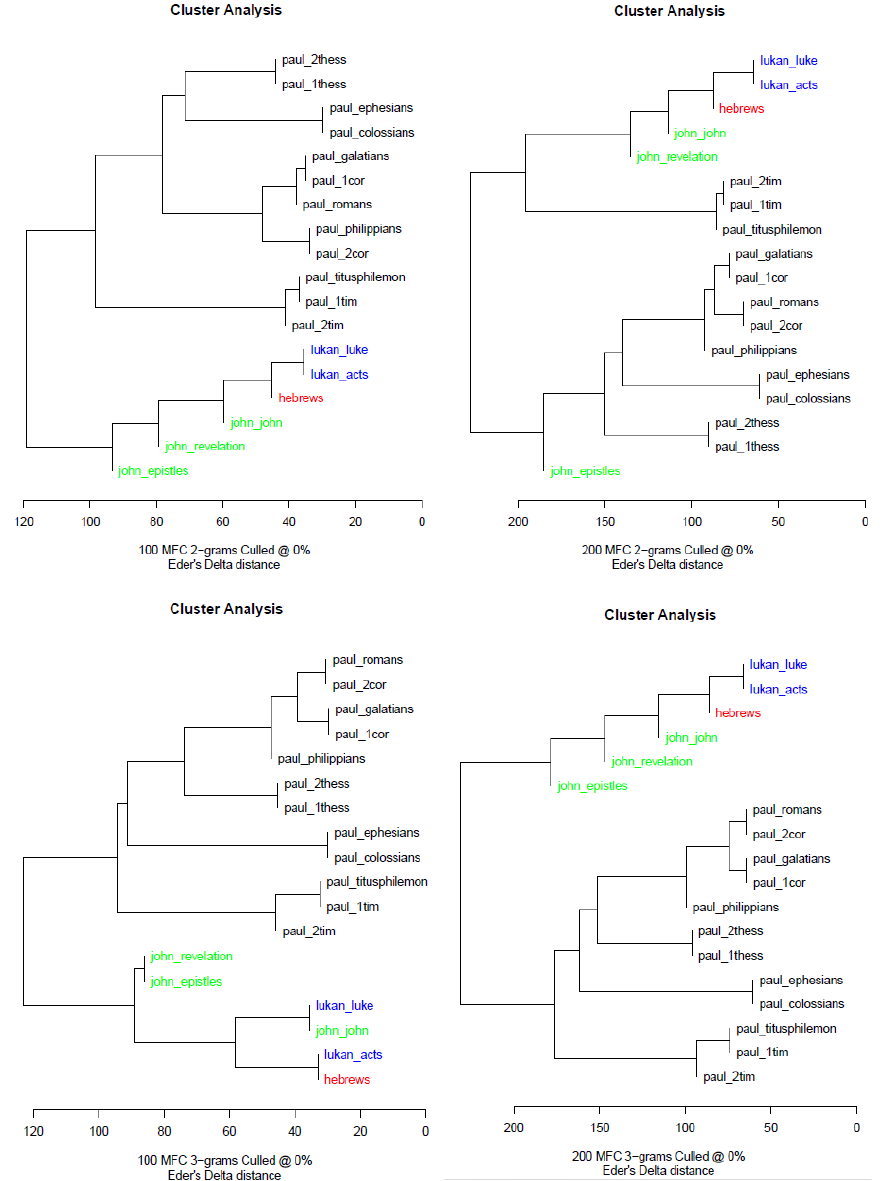
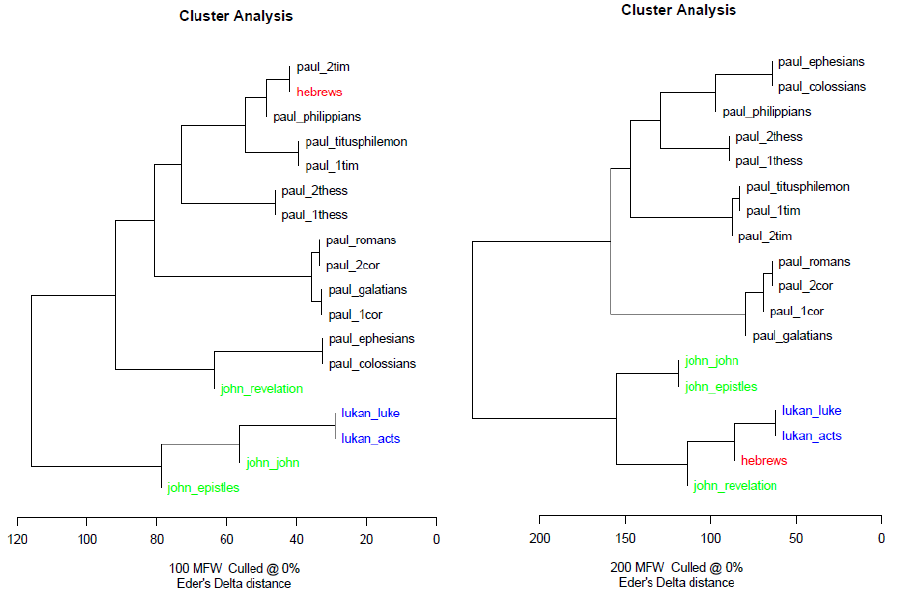
Figure 5 displays cluster analyses produced from the 100 and 200 most frequent bigrams,
trigrams, and words, respectively; books in the same color indicate the same author (with
Hebrews awarded its own color).
STATISTICAL ANALYSIS OF HEBREWS 24
Figure 5
Cluster Analyses for 100 and 200 Most Frequent Bigrams, Trigrams, Words in Individual Books
STATISTICAL ANALYSIS OF HEBREWS 25
Note. These six graphs display the results of performing hierarchical clustering on the 100 and
200 most frequent words, bigrams, and trigrams with individual biblical books.
Upon examination of these cluster analyses, an immediate and critical observation can be
made: books by the same author (demonstrated by the color-coding) have a very strong tendency
to cluster together, an effect seen most prominently in the Pauline literature. This gives cogent
evidence that cluster analysis does actually provide legitimate authorial insights. If this were not
the case, the books should be randomly scattered with no tendency for books by the same author
to cluster together. However, it is very clear that this is not the case, indicating that an authorial
“fingerprint” is in fact being captured. Therefore, since authorial clustering does occur, these
cluster analyses can yield some insight into the possible authorship of Hebrews.
The cluster analyses clearly have a strong propensity to categorize Hebrews with Lukan
literature: this holds for five of the six displayed cluster analyses. Even more striking, this
STATISTICAL ANALYSIS OF HEBREWS 26
categorization of Hebrews also holds for every cluster analysis performed with 300, 400, and 500
most frequent tokens (not pictured). The only cluster analysis that classifies Hebrews with
Pauline literature is the one that considers 100 MFW. Thus, cluster analysis of individual books
clearly favors Lukan authorship of Hebrews over Pauline. Though obviously inconclusive due to
the volatile nature of clustering and the narrow margin in the previous analysis of complete
corpora, this analysis of individual books does put weight behind Luke as a possible author (at
least compared to Paul).
Another fascinating insight from these graphs is derived from examining the Johannine
literature considered. Clearly, in contrast to Pauline and Lukan literature, the Johannine literature
did not always cluster together. Several possible reasons exist for this lack of cohesion. First,
John wrote three different genres of literature in the New Testament (narrative, epistle, and
apocalyptic/prophetic), which contributes to different word choice depending on the genre and
context within which he was writing. Second, the Johannine epistles are short even in aggregate,
possibly leading to higher variance due to a smaller sample size. Third, the book of Revelation
likely represents an outlier by New Testament standards due to its unique subject matter. Though
not directly impacting Hebrews authorship, this observation does testify to the impact of small
sample size and of genre on stylometric authorial analysis.
Other insights result from a consideration of principal component analysis (PCA) applied
to this data set. As discussed above, PCA reduces high-dimensional data to a low and
visualizable number of dimensions. In the case of stylometry, each original “dimension” is the
frequency of a specific word. Thus, the loadings of this PCA assign principal component scores
to the individual words. This allows the words and the books to be visualized together, with
STATISTICAL ANALYSIS OF HEBREWS 27
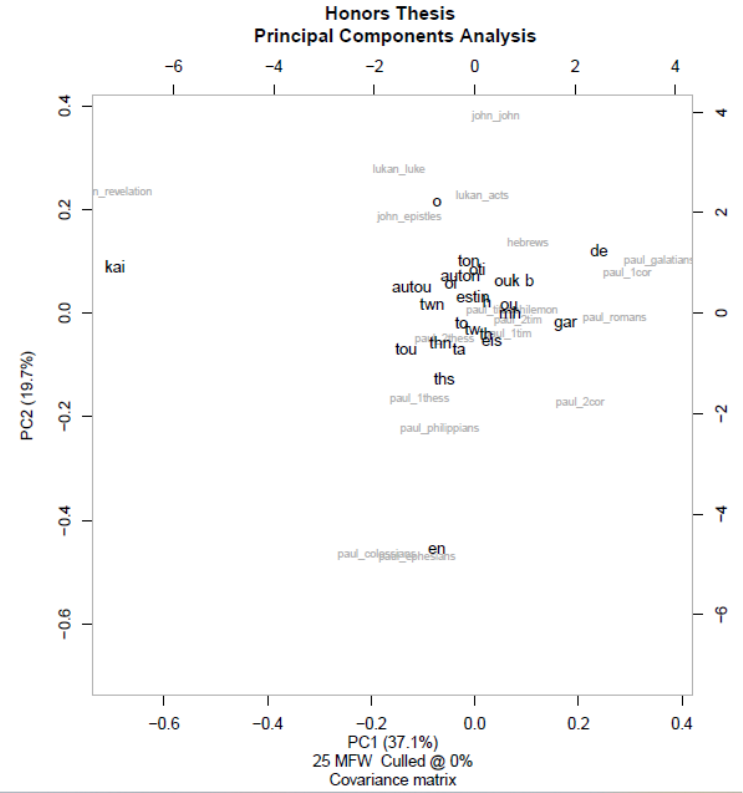
words tending to fall closer to books that use them more. Figure 6 displays a PCA of the 25 most
frequent words in the corpus under consideration.
Figure 6
PCA of 25 MFW with Individual Books
Note. This graph demonstrates principal component analysis performed on individual books,
considering the 25 most frequent words. Proximity of both Greek words and biblical books on
the graph tends to be indicative of proximity within the data set. Produced using the stylo
package in R.
STATISTICAL ANALYSIS OF HEBREWS 28
This PCA reduces 25 dimensions to two while retaining fully 56.8% of the variance,
indicating that the dimension reduction was effective. Since it does not retain all the variance
present, definitive conclusions are difficult to draw; however, observations can still be made
about tendential word usage. For example, the word ἐν (“in”) seems to strongly share principal
components with Ephesians and Colossians. The pairing of these two books is unsurprising since
they contain much of the same content (Best, 1997) and were closely linked in every cluster
analysis performed (as can be seen above). Similarly, the word καί (“and”) closely shares
principal components with Revelation. However, the articles all tend to be clumped near the
center, indicating their usage to be fairly uniform across all books considered. While no hard-
and-fast conclusions emerge from this analysis, it portends fertile ground for further word studies
in specific books.
Results—Systematic Sampling
Additional analysis was conducted on nonoverlapping samples of 3000 characters taken
from each book. This allowed for investigation of books’ internal cohesion (measured by
whether samples from the same book tended to cluster together). It additionally gives further
level of granularity in the analysis in case one part of a particular book represents a dramatic
outlier. Hierarchical clustering was the primary tool used to analyze these samples, and analysis
was performed for 100, 200, and 300 MFT for every method of tokenization. In these cluster
analyses, the segments from Hebrews were predominantly clustered along with Acts (specifically
the later chapters), lending further support (though not by any means definitive) to a Lukan
authorship being more likely than a Pauline. Additionally, authorial distinctions remain even
when the books are divided into smaller segments, with segments written by the same author
overwhelmingly being clustered together.
STATISTICAL ANALYSIS OF HEBREWS 29
Analysis
Summary of Results and Inferences
The analyses performed favor a Lukan authorship of Hebrews over a Pauline authorship.
This is indicated by an analysis of the complete corpora, which predominantly indicates the
Lukan corpus as having a smaller stylometric distance from Hebrews than the Pauline corpus
(albeit by a small margin). It is additionally supported by cluster analysis of the complete biblical
books, which overwhelmingly categorize Hebrews with Lukan literature. It is finally indicated
by systematic sampling from the books which clusters the samples from Hebrews with those
from Acts (even more closely than those from Acts cluster with those from Luke). These all give
indication that it is possible that Hebrews corresponds to a Lukan authorial style more closely
than to a Pauline. This result would certainly still be compatible with a co-authorship theory
because if Luke received teaching from Paul or another and transcribed it into epistolary form, he
would naturally leave his fingerprint of literary style or word choice on the resulting document.
Caveats
Several caveats must be addressed with respect to this conclusion. First, this study was
only able to analyze possible authors who had written other New Testament literature. This
excludes such legitimate candidates as Apollos, Barnabas, or Clement of Rome from
consideration. It is merely able to assess the comparative likelihood of Paul and Luke as authors.
Moreover, this study primarily featured unsupervised learning techniques, which are relatively
unstable and volatile, so any conclusions drawn based on these should be treated with a healthy
level of skepticism and confirmed through other analyses if possible. Finally, the advantage of
Luke over Paul was very narrow (especially when examined from the perspective of complete
corpora), and therefore should not be misconstrued to be definitive or completely conclusive.
STATISTICAL ANALYSIS OF HEBREWS 30
Despite these limitations, however, this research still provides fascinating, meaningful, and
nontrivial insight into the literary style of Hebrews as compared with other New Testament
books.
Further Research
This research—bringing stylometry to bear on New Testament literature—could be
expanded upon in a variety of ways. First, future stylometric research could investigate the other
New Testament books that were not considered in this analysis, including performing a
comparative analysis to examine which New Testament authors are the most similar and
different. Second, it could investigate the possible stylistic variations between Jews and Gentiles
who authored New Testament literature to examine whether and how an author’s ethnic and
religious upbringing affected his word choice. Other research could focus on the Pauline corpus
to investigate how Paul’s literary style and word choice may have changed over time. Finally,
stylometric research could be performed on English translations of the Bible to see if authorial
word choice variations are retained in translation.
Conclusion
Jeopardy! fans were ultimately right to push back on the clue that implicitly ascribed
authorship of Hebrews to Paul. Although Paul was considered the traditional author for much of
church history, his literary style does not match well with the book of Hebrews, as evidenced by
statistical analysis that propounds Luke as a more likely author. Though the Hebrews authorship
debate will likely never be solved by biblical scholars and will continue as one of the most
prominent and fascinating open questions in biblical scholarship, this project filled a gap in the
existing research on the subject and provided a fresh perspective and insight into the debate,
thereby laying the foundation for other similar work to be completed on Hebrews and other
STATISTICAL ANALYSIS OF HEBREWS 31
biblical literature. The final word on the topic must belong to Origen of Alexandria: “Who it was
that really wrote the epistle, God only knows” (Eusebius, 1850, 6.25.13).
STATISTICAL ANALYSIS OF HEBREWS 32
References
Aland, B., Aland, K., Karavidopoulos, I. D., Martini, C. M., Metzger, B. M. & Strutwolf, H.
(Eds.). (2014). The Greek New Testament (5th ed.). Deutsche Bibelgesellschaft,
American Bible Society, United Bible Societies.
Baker, R. (2010). The accentuation of ancient Greek enclitics: A didactic simplification.
Classical World, 103(4), 529-530. https://doi.org/10.1353/clw.2010.0014.
Best, E. (1997). Who used whom? The relationship of Ephesians and Colossians. New Testament
Studies, 43(1), 72–96. https://doi.org/10.1017/S0028688500022505
Binongo, J., & Smith, M. (1999). The application of principal component analysis to stylometry.
Literary & Linguistic Computing, 14(4), 445–466. https://doi.org/10.1093/llc/14.4.445
Burrows, J. (2002). “Delta”: A measure of stylistic difference and a guide to likely authorship.
Literary & Linguistic Computing, 17(3), 267–287. https://doi.org/10.1093/llc/17.3.267
Coene, J. (2018). Sacred [R package]. Retrieved from http://sacred.john-coene.com/index.html
Craig, D. H., & Kinney, A. F. (2009). Shakespeare, computers, and the mystery of authorship.
Cambridge University Press.
Danker, F. W. (Ed.). (2000). A Greek-English lexicon of the New Testament and other early
Christian literature. University of Chicago Press.
Eder, M. (2015). Taking stylometry to the limits: Benchmark study on 5,281 texts from
Patrologia Latina. In Digital Humanities 2015: Conference Abstracts.
http://dh2015.org/abstracts.
Eder, M., & Górski, R.,L. (2022). Stylistic Fingerprints, POS-tags and Inflected Languages: A
Case Study in Polish. Cornell University Library, arXiv.org.
https://doi.org/10.1080/09296174.2022.2122751

STATISTICAL ANALYSIS OF HEBREWS 33
Eder, M., Rybicki, J., & Kestemont, M. (2016). Stylometry with R: A package for computational
text analysis. R Journal, 8(1), 107–121. https://doi.org/10.32614/RJ-2016-007
Ellingworth, P. (1993). The Epistle to the Hebrews: A commentary on the Greek text. W.B.
Eerdmans.
English Standard Bible. (2001). Crossway Books.
Eusebius of Caesarea (1850). Ecclesiastical History (C. F. Crusé, Trans.). Stanford & Swords.
(Original work published ca. 313-323)
Evert, S., Proisl, T., Jannidis, F., Reger, I., Pielström, S., Schöch, C., & Vitt, T. (2017).
Understanding and explaining Delta measures for authorship attribution. Digital
Scholarship in the Humanities, 32, ii4–ii16. https://doi.org/10.1093/llc/fqx023
Greenspahn, F. E. (1980). The number and distribution of hapax legomena in biblical
Hebrew. Vetus Testamentum, 30(1), 8–19. https://doi.org/10.2307/1517697.
Griffith, S. (2005). The epistle to the Hebrews in modern interpretation. Review and
Expositor, 102(2), 235-254. https://doi.org/10.1177/003463730510200206.
Grindheim, S. (2023). The letter to the Hebrews. William B. Eerdmans Publishing Company.
Hayes, M. E. (2018). An analysis of the attributive participle and the relative clause in the
Greek New Testament. Peter Lang Inc., International Academic Publishers.
James, G. (2013). An introduction to statistical learning: With applications in R. Springer.
Mosteller, F., & Wallace, D. L. (1963). Inference in an authorship problem. Journal of the
American Statistical Association, 58(302), 275–309.
https://doi.org/10.1080/01621459.1963.10500849

STATISTICAL ANALYSIS OF HEBREWS 34
Royal, K. (2012). Using objective stylometric techniques to evaluate New Testament
authorship. Journal of Multidisciplinary Evaluation, 8(19), 1–7.
https://doi.org/10.56645/jmde.v8i19.352
Stamatatos, E. (2009). A survey of modern authorship attribution methods. Journal of the
American Society for information Science and Technology, 60(3), 538-556.
Thomas, M. J. (2019). Origen on Paul’s authorship of Hebrews. New Testament Studies, 65(4),
598–609. https://doi.org/10.1017/S0028688519000274
Thompson, J. W. (2008). Hebrews. Baker Academic.
Van Nes, J. (2018a). Hapax legomena in disputed Pauline letters: A reassessment. Zeitschrift
Für Die Neutestamentliche Wissenschaft Und Die Kunde Der Älteren Kirche, 109(1),
118–137. https://doi.org/10.1515/znw-2018-0006
Van Nes, J. (2018b). Pauline language and the pastoral epistles: A study of linguistic
variation in the Corpus Paulinum. Brill.
Wagner, B. H. (2010). Another look at the authorship of Hebrews from an evangelical
perspective of church history. Journal of Dispensational Theology, 14(43), 45–53.
Whissell, C. (1996). Traditional and emotional stylometric analysis of the songs of Beatles Paul
McCartney and John Lennon. Computers and the Humanities, 30(3), 257–265.
http://www.jstor.org/stable/30200392
Willingham, A.J. (2022, November 18). ‘Jeopardy!’ fans are frustrated by this controversial
Bible clue. CNN. https://www.cnn.com/2022/11/17/entertainment/jeopardy-bible-
controversy-tournament-champions-cec/index.html
