
Getting Out the Vote With Postcards to
Voters: A Study of Best Practices
November 2019

Background
❖ Millions of postcards to voters were written and sent during the 2018 election cycle.
Field studies suggest that these postcards do have a positive impact on getting out the
vote.
❖ Postcard writers and list providers have varying opinions as to what constitutes the
most effective postcard writing protocols. Just a few of some widespread views are:
– The more artsy and decorated the postcard, the better.
– Handwritten is superior to anything pre-printed.
– The more information we provide about a candidate the better.
– It is best not to address a postcard to a voter by name.
❖ The purpose of this research is to understand whether any of these things make a
difference and, if so, to recommend some best practices to those who are using
postcards as a campaign tool, hosting postcard parties, providing address lists for
postcard writers, and writing postcards themselves.
2

Objectives
❖ The objectives of this research are to identify whether there are differences in postcard
effectiveness based on the format. Postcard effectiveness is defined as meaning that
the postcard:
– Is read, kept, and/or shared with others; and
– Enhances voter likelihood to pay attention to this election, vote, vote for the specific
candidate, and/or make sure people they know are registered to vote.
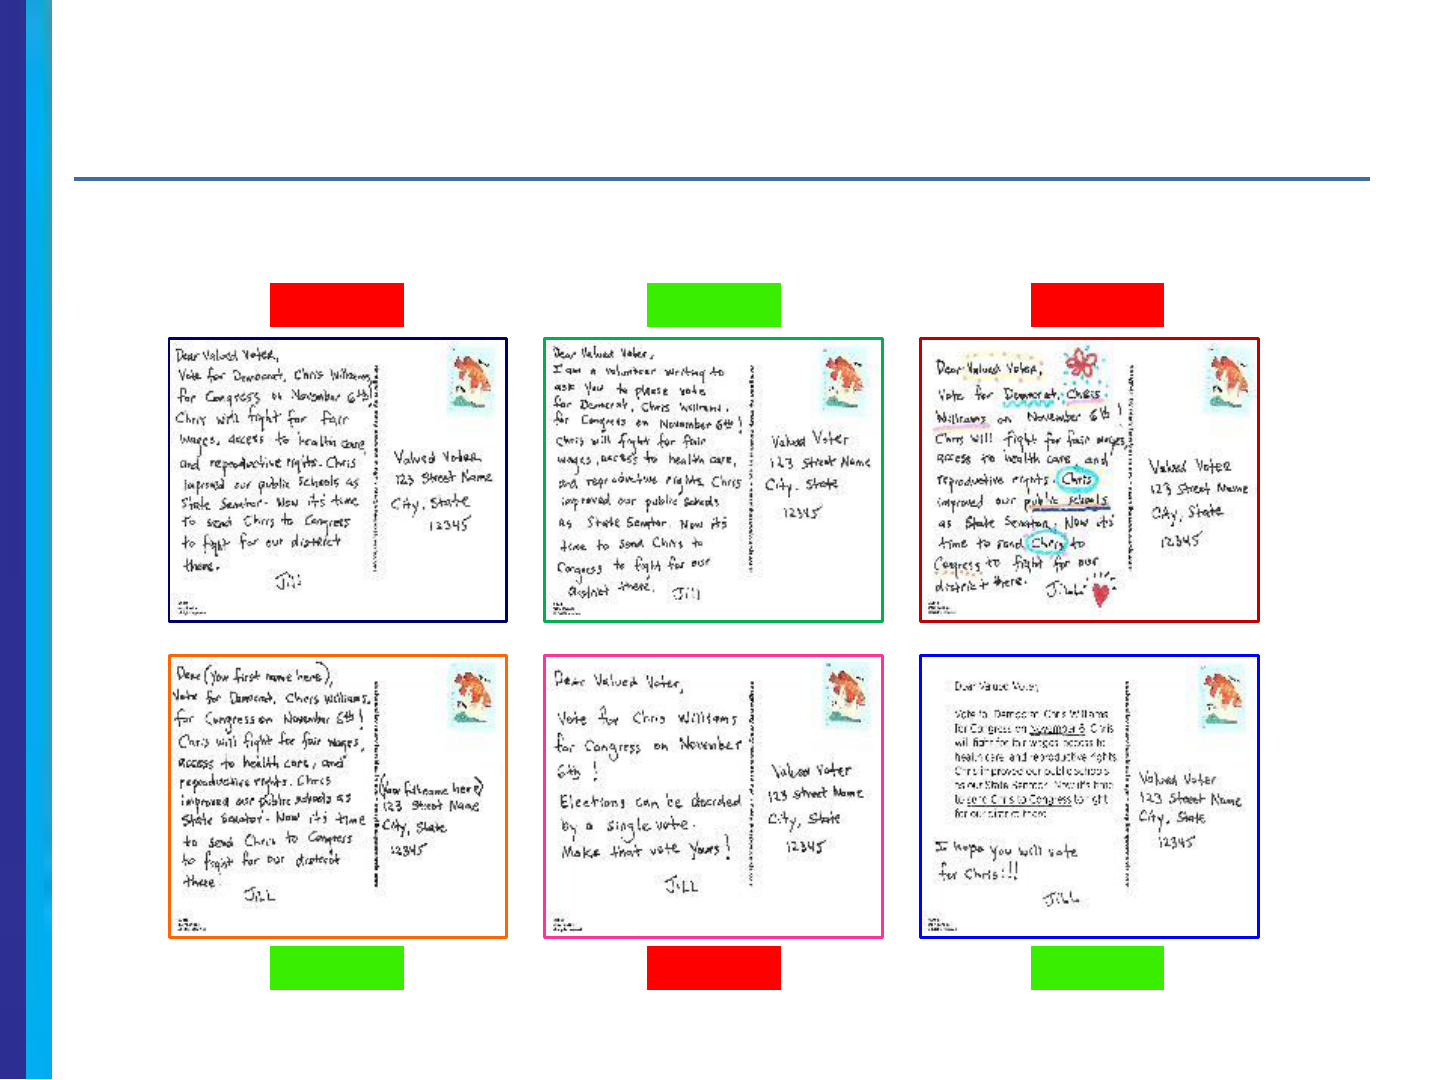
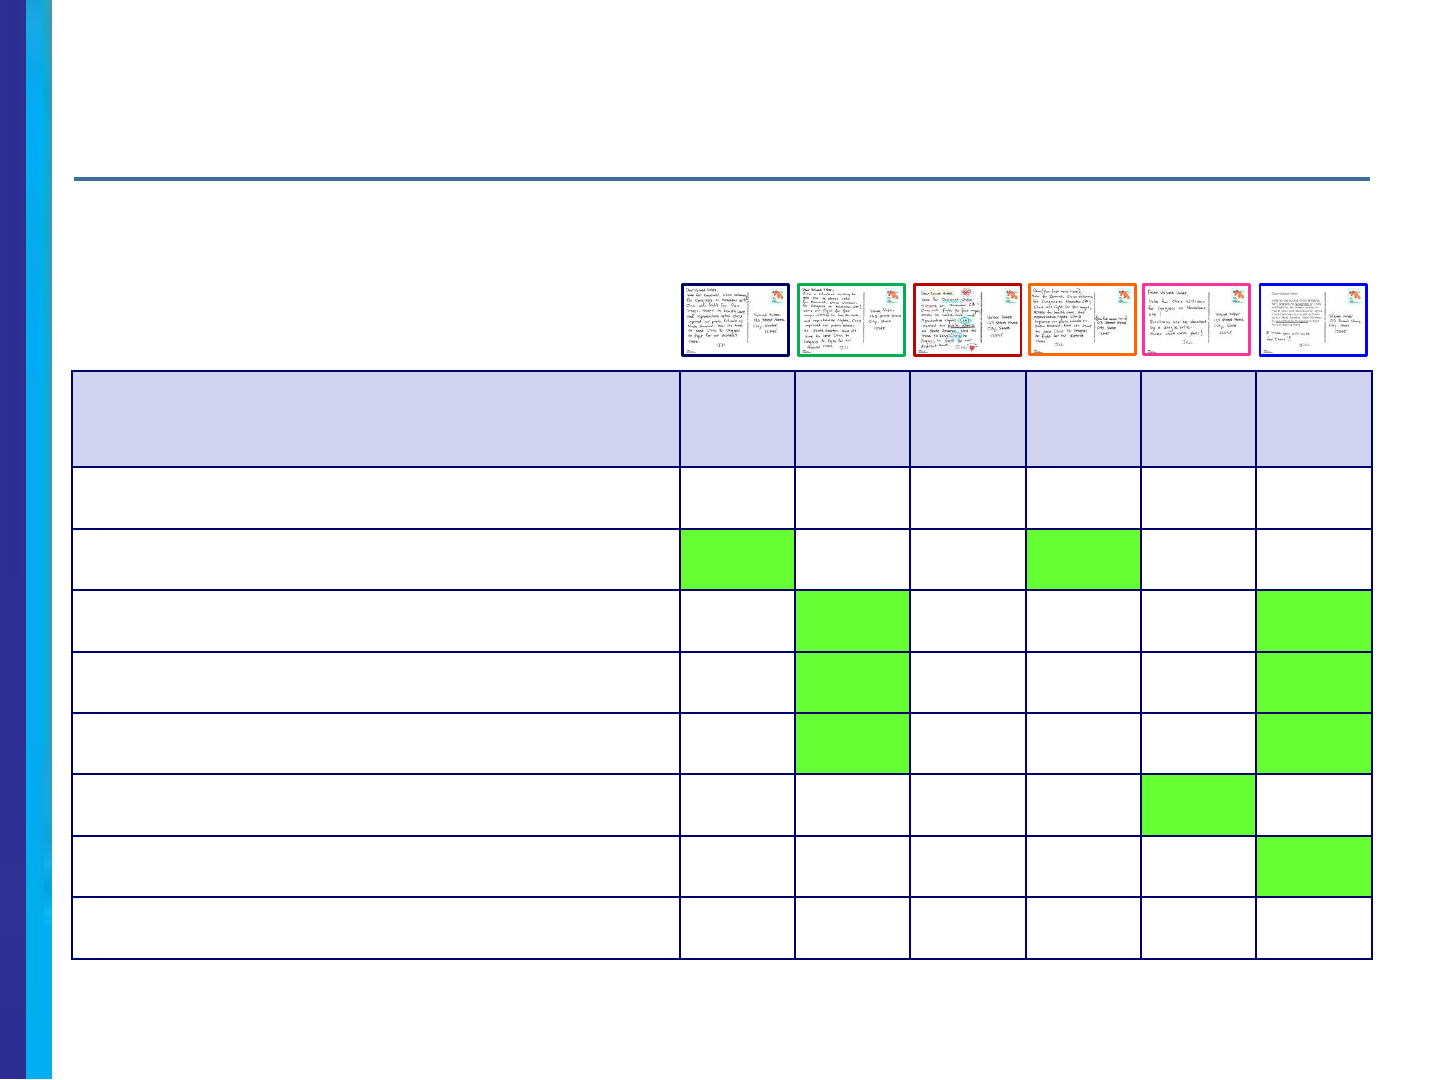
❖ Six different formats were tested as follows:
– Base—represents a typical hand-written message which asks the voter to vote for a
specific candidate on election day. This version is addressed to “Valued Voter.”
– Volunteer—same as Base case but adds a phrase at the beginning “I am a
volunteer asking you to please vote for….”
– Decorated—same as Base but includes colorful decorations
– With Name—same as Base but instead of Valued Voter, it says Dear (First Name
Here) and (Full Name) is noted as part of the address.
– Short—this version is very brief and leaves out any information related to the
candidate’s stand on the issues. It is simply a reminder to vote and to vote for this
candidate.
– Pre-printed—same as Base except all the base text is pre-printed leaving some
room for a handwritten closing and signature.
Screen shots of each of the six postcard versions tested are below.
3
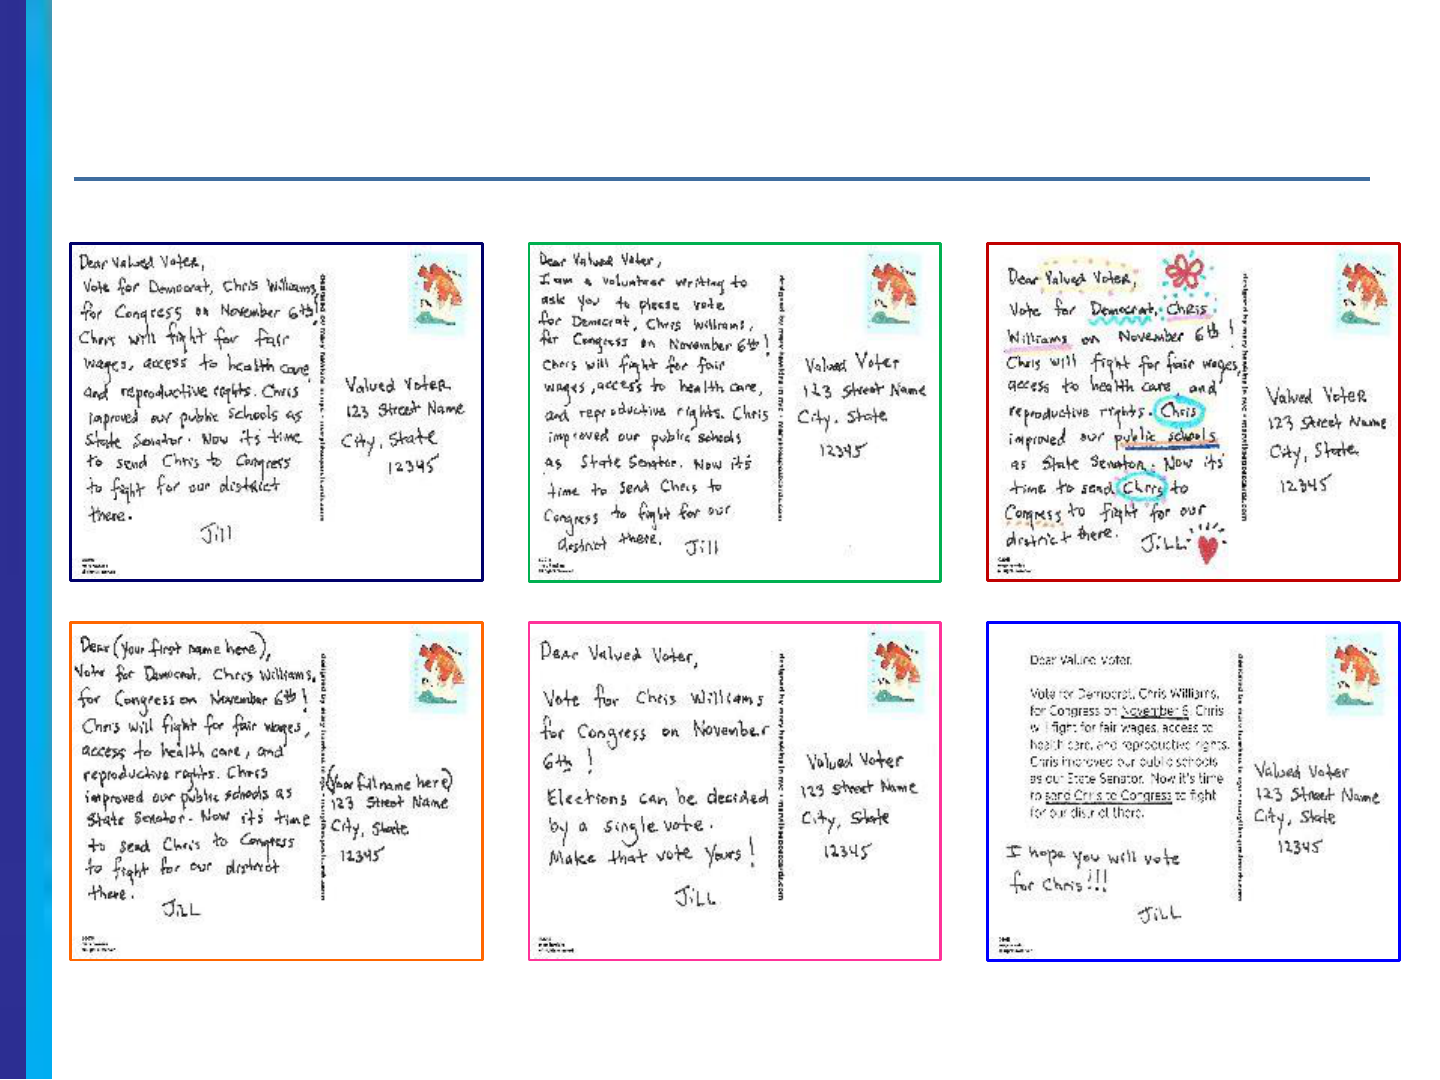
Six Postcards Tested
4
BASE VOLUNTEER DECORATED
WITH NAME SHORT PREPRINTED
All Postcards Shown Had the Same Back
5

Methodology
❖ Online interviews were conducted among registered Democrats as follows:
– 1,380 interviewed; 1,217 interviewed in-depth about the postcards*
– Six groups of ~200 respondents, each exposed to two versions of the postcard
– Quotas were set so each group of ~200 had readable bases of respondents by
gender, age, and region
❖ After exposure to one of the postcard versions, respondents were asked:
– Thoughts and feelings
– What would do with the postcard (read/skim/throw away/keep/share)
– Impact on likelihood to take action (pay attention to election, vote etc.)
– Likes/dislikes
❖ Following individual postcard evaluations, respondents were exposed to a second
version and asked their preference and reasons for preference
❖ Interviewing was conducted May 14-24, 2019
❖ Results have been tested for differences at the 90% confidence level and noted with
an A, B, C, D, E, F indicating as follows:
A. Significantly greater than Base
B. Significantly greater than Volunteer
C. Significantly greater than With Name
D. Significantly greater than Decorated
E. Significantly greater than Short
F. Significantly greater than Preprinted
6
*163 respondents indicated they would throw a postcard away without reading it. They were not interviewed in-depth.

Executive Summary
7

Overall Findings
❖ Prior studies have found that postcards to voters have a small positive effect on voter
turnout. The impact lies somewhere between purely commercial mailers and a phone
call—not as effective as a phone call but more effective than a commercial mailer. This
small, positive effect, however, adds up when millions of postcards are written by
volunteers -- which is what happened in the 2018 election cycle. Our study found that
such postcards appear to be more effective overall with younger voters (under 45)
than older voters (45+). In addition, Democratic voters residing in Red states were
more positively impacted by the postcards than those in Blue states. These two skews
could be helpful in prioritizing postcard writing efforts overall since we often know the
age, gender, and state of the voters who are targeted by postcarding efforts.
❖ While postcards are effective, little has been known about whether some postcard
formats are more effective than others. Led by market researcher Sandy Radoff, Blue
Wave Analytics, an all-volunteer group of experienced activists, designed a protocol to
test whether recipients are more likely to be mobilized by a postcard that is all
handwritten vs. partially pre-printed, decorated with colorful drawings vs. plain, greets
them by name vs. being sent to them with no name and various other possible
variations. (Details of how the study was done follow. An even more detailed report is
available upon request by emailing [email protected])
8

Overall Findings (Continued)
❖ The results are in and the format does, indeed, make a difference. While all formats
tested had a positive impact, some potential best practices which could boost the
postcards’ impact did emerge.
❖ Especially for the purposes of campaign mangers, the most important finding was that
partially preprinted text did just as well as all hand-written. It was easier to read
and more professional looking. However, leaving at least a small amount of room for a
handwritten note was an important way to give it a personal touch. The fact that this
version did well versus a typical all handwritten version is exciting because volunteers
can fill out and send more of these per hour enabling us to reach many more potential
voters. This version boosted the effectiveness among women, voters 45 years or
older, and those with household incomes under $75K. Consider partially preprinted
cards.
❖ When preprinted text isn’t possible, the quality of the handwriting makes a
difference. We selected someone with legible handwriting to create the prototype
postcards (see samples of what voters were reacting to on page X) and the single
biggest suggestion for improving the postcards was to make the handwriting neater
and more legible.
9

Overall Findings (Continued)
– Decorations are polarizing. While some very much liked decorations, an equal
proportion disliked them. This format was weakest among households with higher
incomes ($75K+).
– Beginning with the phrase “I am a volunteer writing to ask you to please vote
for………….” significantly enhanced the effectiveness of postcards. It explained
who the person signing the postcard was and it softened any resistance to
handwriting that might be at all illegible or unclear. This format was particularly
effective among women, voters 45 or older, and those in Red states.
– Addressing the recipient by name was generally preferred versus something
like “Dear Valued Voter”. However, these preferences were concentrated among
younger voters (under 45). Older voters were more likely to prefer receiving a card
addressed to “Dear Valued Voter” without their name.
– A very short get out and vote message without any information about the
candidate is the weakest format. While too much text can be problematic, simply
asking people to vote for a particular candidate with no information about the
candidate’s views was less effective than any of the other formats, all of which
provided a few facts about the candidate’s record.
❖ One final thing to consider that was not specifically tested but was mentioned in open
ended comments--Voters would love to see their polling place on the card. We
recommend including a suggestion to find that information at vote.org in your text.
10

Detailed Findings
11
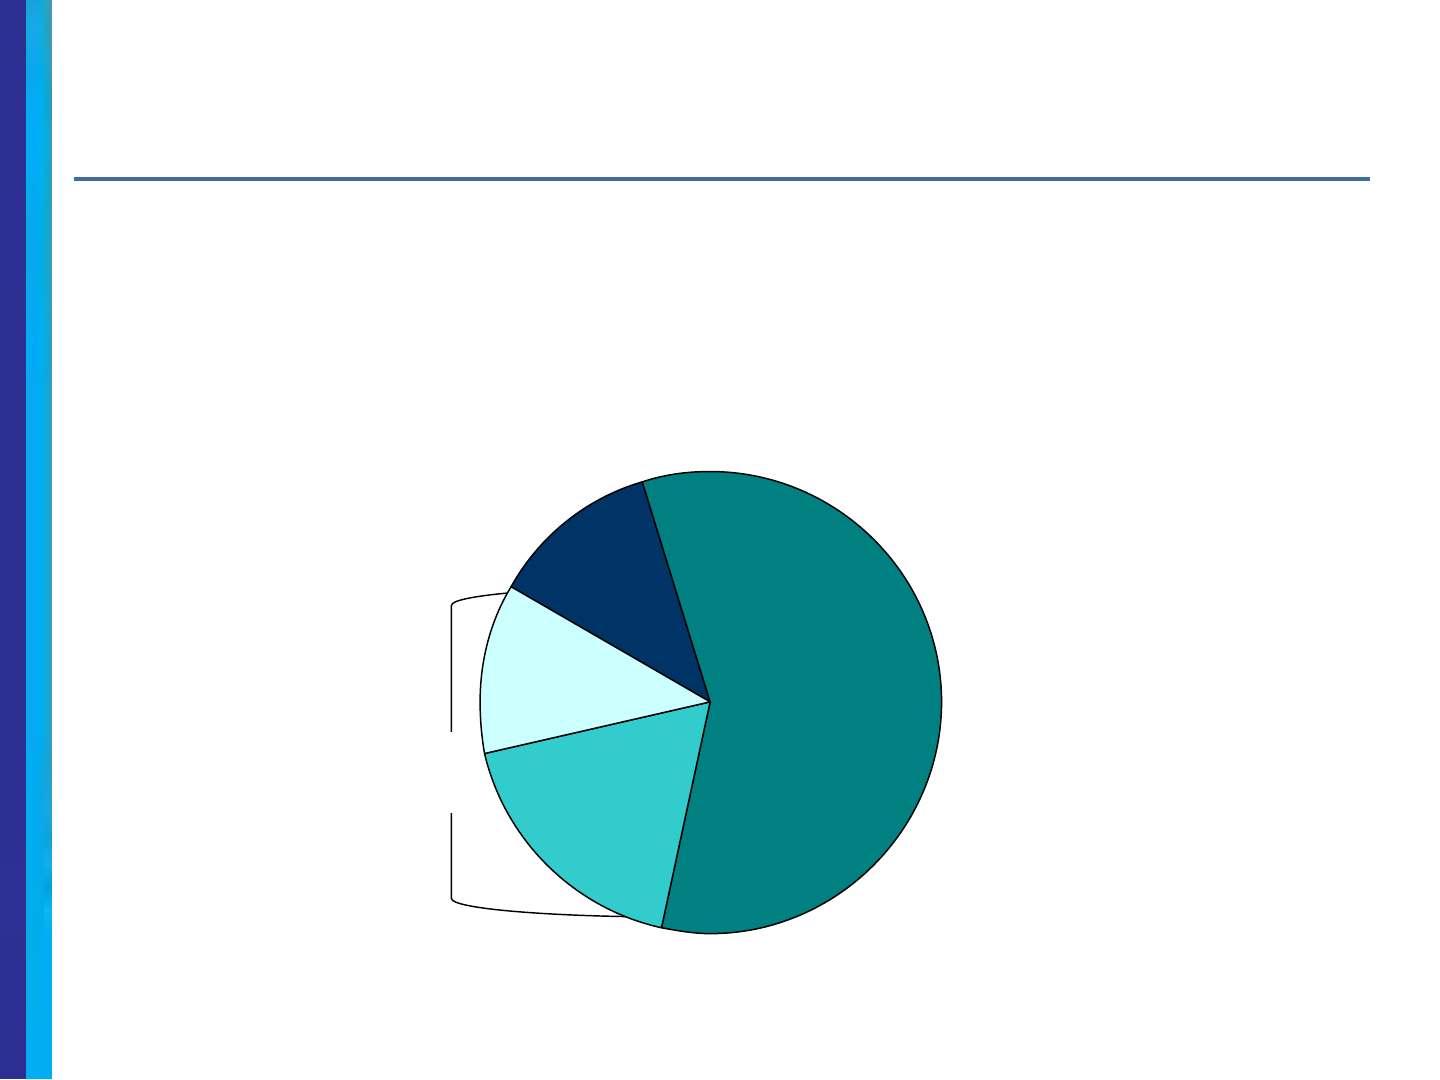
Keep/
Share
30%
Overall very good news*
❖ Registered Democrats like these postcards.
– Only 12% indicate they would throw it away without reading
– Over half would at least read/skim it before throwing it away
– Close to a third would keep it and/or share it
• 18% said they would keep it; 12% would share it
12
18%
12%
58%
12%
Throw
away
without
reading
Read/skim
throw away
Read/skim
keep
Read/skim
share
*Base=1,380 since it includes 163 respondents who were terminated after saying they would throw it away without reading it.
Q7: Which of the following best describes what you would do with this postcard?
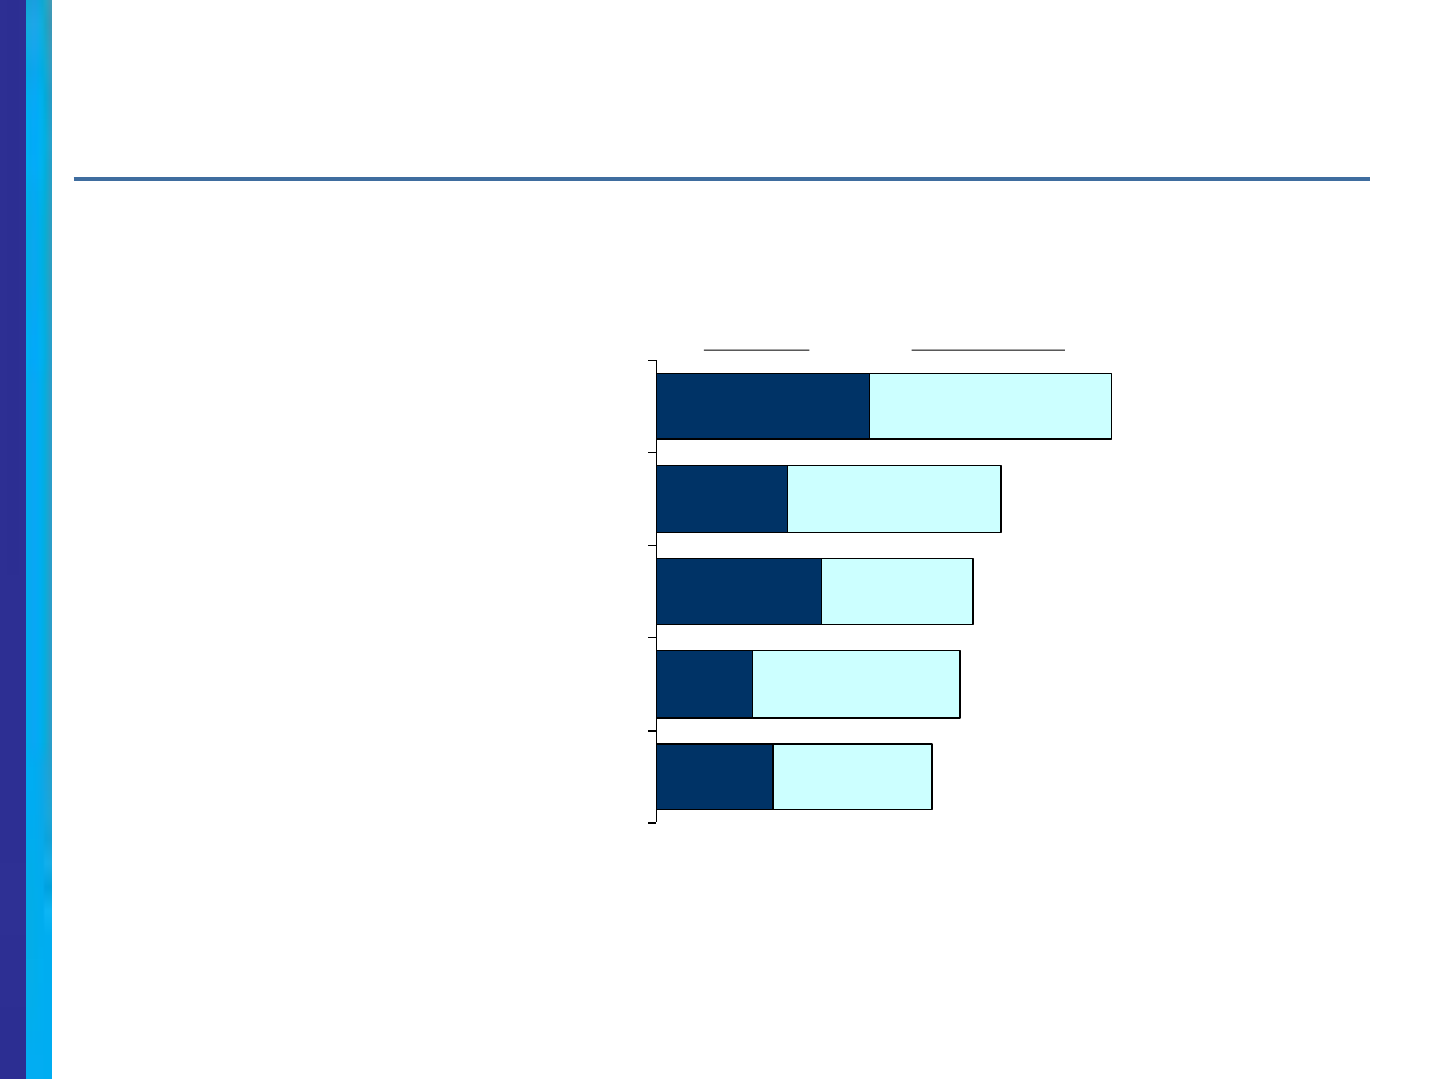
More good news………..
❖ These postcards would have impact
13
Any Action
Say they would pay more
attention to this election
Would be more likely to vote
Would be more likely to vote for
this candidate
Would be more likely to make
sure others are registered to vote
17%
30%
23%
50%
46%
40%
24%
14%
19%
31%
31%
35%
22%
44%
66%
Somewhat MoreMuch More
Q8: What impact, if any, would receiving this postcard have on your likelihood to do the things listed below? Much more likely, Somewhat more likely,
Neither more nor less likely, Somewhat less likely, Much less likely.
Gender Household Income
Males
(569)
%
Females
(647)
%
<$40K
(277)
%
A
$40K-
$75K
(237)
%
B
$75-$150K
(459)
%
C
$150K+
(235)
%
D
Would read/skim; then throw away 68 65 60 64 68
A
75
ABC
Would keep 20 21 25
D
21
D
21
D
13
Would share 12 14 15 15 12 12
More likely to take action
(Much more/somewhat more likely for 1+ items)
65 67 70
D
73
CD
66
D
54
More likely to pay attention to this election
(Much more/somewhat more)
51 51 55
D
57
D
51
D
39
More likely to vote
(Much more/somewhat more)
45 46 52
D
53
CD
46
D
29
More like to vote for this candidate
(Much more/somewhat more)
43 44 46
D
49
D
44
D
36
Make sure people are registered
(Much more/somewhat more)
41 39 48
CD
45
D
39
D
29
Summary of Key Measures in Total by Selected Subgroups
❖ Men and women respond equally well to the postcards.
❖ Those with household incomes (HHI) under $150K responded significantly more
positively than those with HHI above $150K.
14
A/F: Significantly higher than other group at the 90% confidence level.
Age Urban/Rural Children
<45
(592)
%
A
45+
(625)
%
B
Urban
(370)
%
C
Suburban/
Rural
(847)
%
D
Children
(374)
%
E
No
Children
(843)
%
F
Would read/skim; then throw away 62 71
A
59 70
C
64 68
Would keep 24
B
17 24
D
19 21 20
Would share 14 13 17
D
12 15 12
More likely to take action
(Much more/somewhat more likely for 1+ items)
73
B
60 69 65 75
F
62
More likely to pay attention to this election
(Much more/somewhat more)
57
B
46 58
D
48 61
F
47
More likely to vote
(Much more/somewhat more)
53
B
39 50
D
44 57
F
41
More like to vote for this candidate
(Much more/somewhat more)
50
B
38 48
D
42 53
F
39
Make sure people are registered
(Much more/somewhat more)
48
B
32 48
D
37 51
F
35
Summary of Key Measures in Total by Selected Subgroups
❖ Those under 45 years of age respond more positively than those 45+.
❖ Urban dwellers respond more positively than Suburban/Rural dwellers; this is likely
correlated with age.
❖ Those with children under 18 respond more positively than those without; again likely
correlated with age.
15
A/F: Significantly higher than other group at the 90% confidence level.
RED
States
(428)
%
A
BLUE
States
(789)
%
B
Would read/skim; then throw away 63 69
A
Would keep 37
B
31
Would share 17
B
11
More likely to take action
(Much more/somewhat more likely for 1+ items)
69 64
More likely to pay attention to this election
(Much more/somewhat more)
54 50
More likely to vote
(Much more/somewhat more)
49 44
More like to vote for this candidate
(Much more/somewhat more)
49
B
41
Make sure people are registered
(Much more/somewhat more)
45
B
38
Summary of Key Measures in Total by Selected Subgroups
❖ Those in Red States respond more positively than those in Blue States.
16
A/B: Significantly higher than other group at the 90% confidence level.

Analytic Note
A total of 1,380 respondents were screened. This included 163 who indicated
they would throw a postcard away without reading it. For the rest of this
report, we will focus on the 88% who would at least read or skim the postcard
which is a base of 1,217.
17
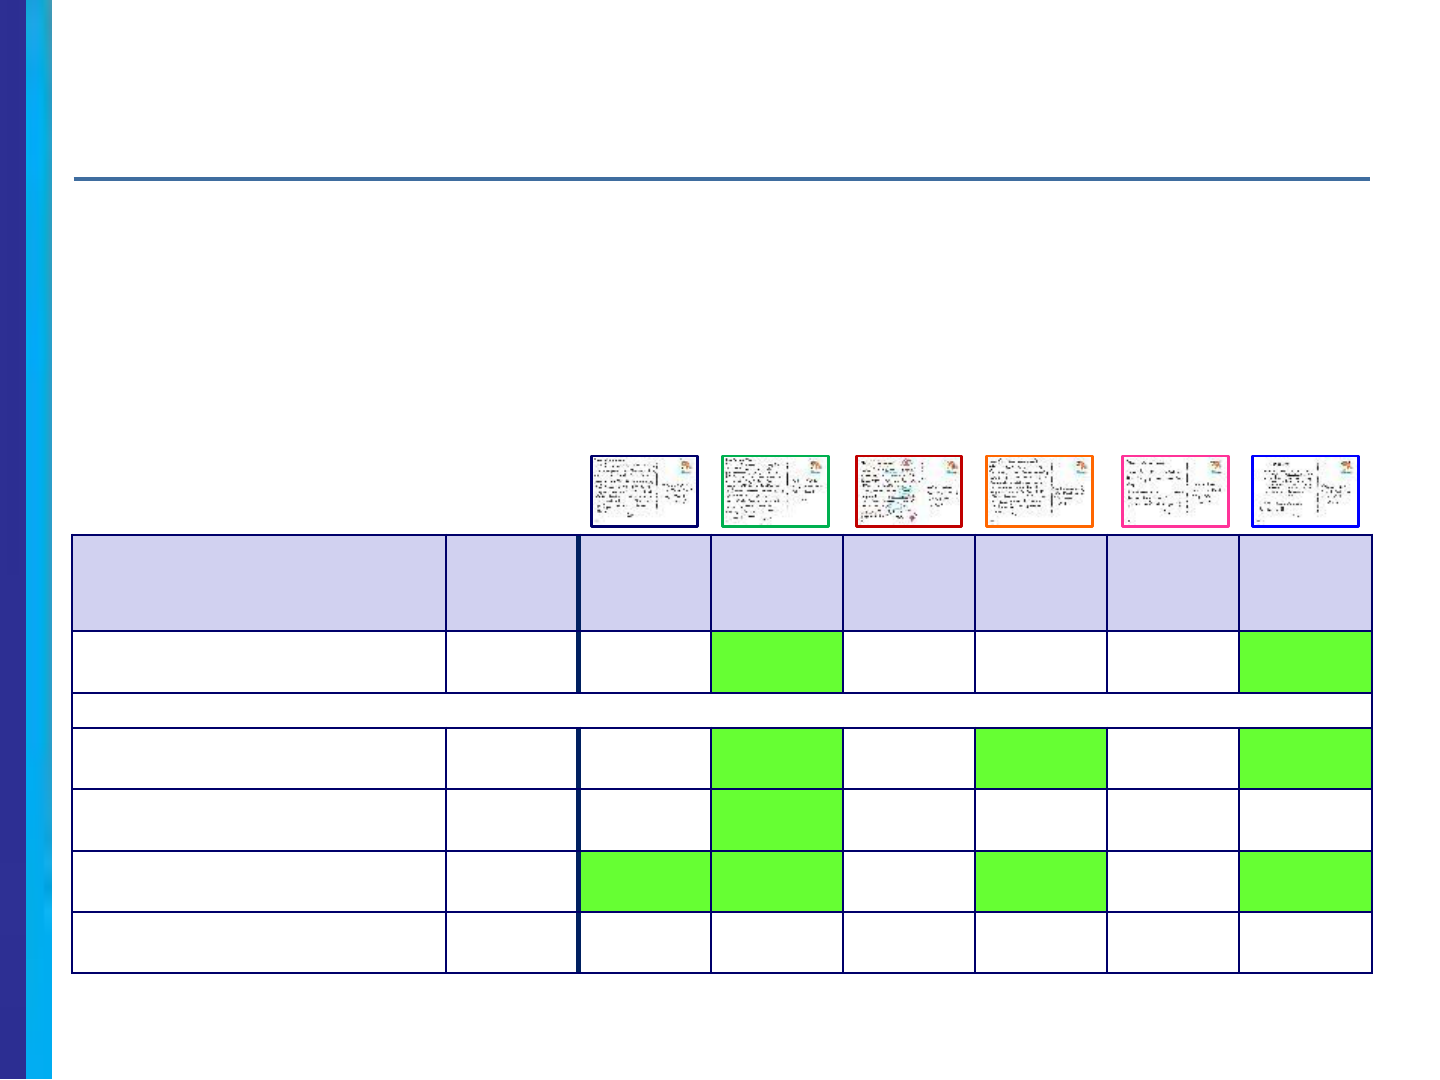
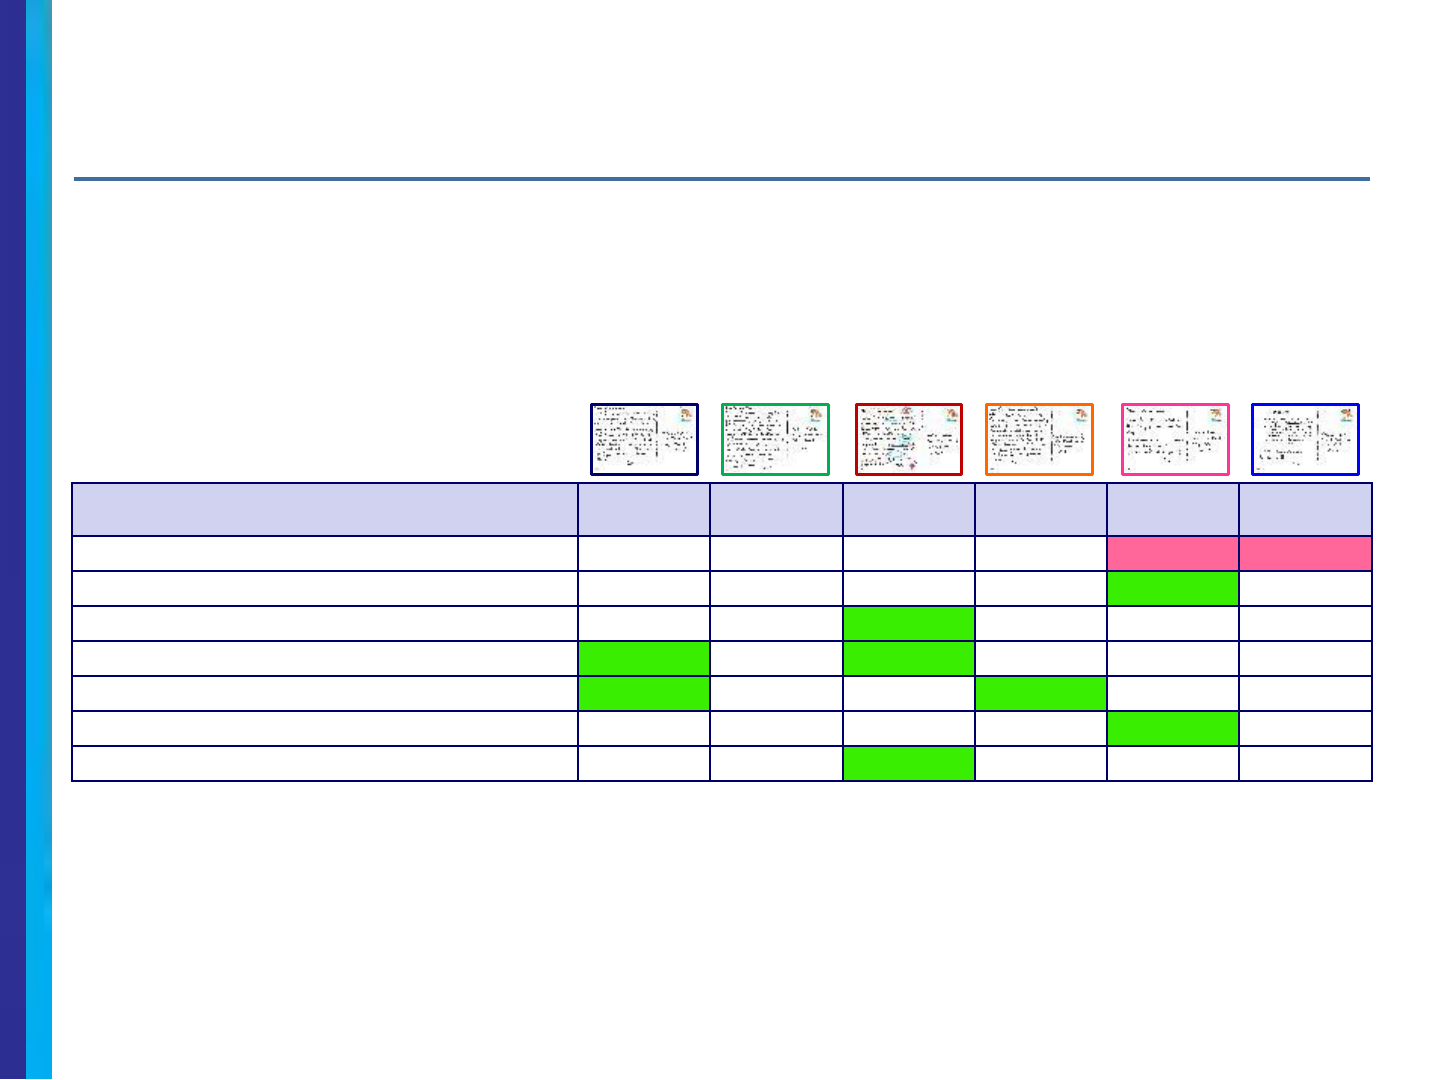
Summary of What Would Do with Postcard – Total
❖ Overall, about two thirds will read/skim before throwing the postcard away. About a
fifth will keep it and 13% will share it.
– SHORT is most likely to be thrown away after reading/skimming.
– VOLUNTEER and PREPRINTED are most likely to be shared.
18
GRAND
TOTAL
%
BASE
(A)
%
VOLUN-
TEER
(B)
%
DECOR-
ATED
(C)
%
WITH NAME
(D)
%
SHORT
(E)
%
PRE-
PRINTED
(F)
%
Would read/skim; then throw away 67 66 67 66 67 71
F
62
Would keep 20 23
D
16 20 23
D
18 22
Would share 13 11 17
D
14 10 11 15
D
A/F: Significantly higher than other group at the 90% confidence level.
Q7: Which of the following best describes what you would do with this postcard?
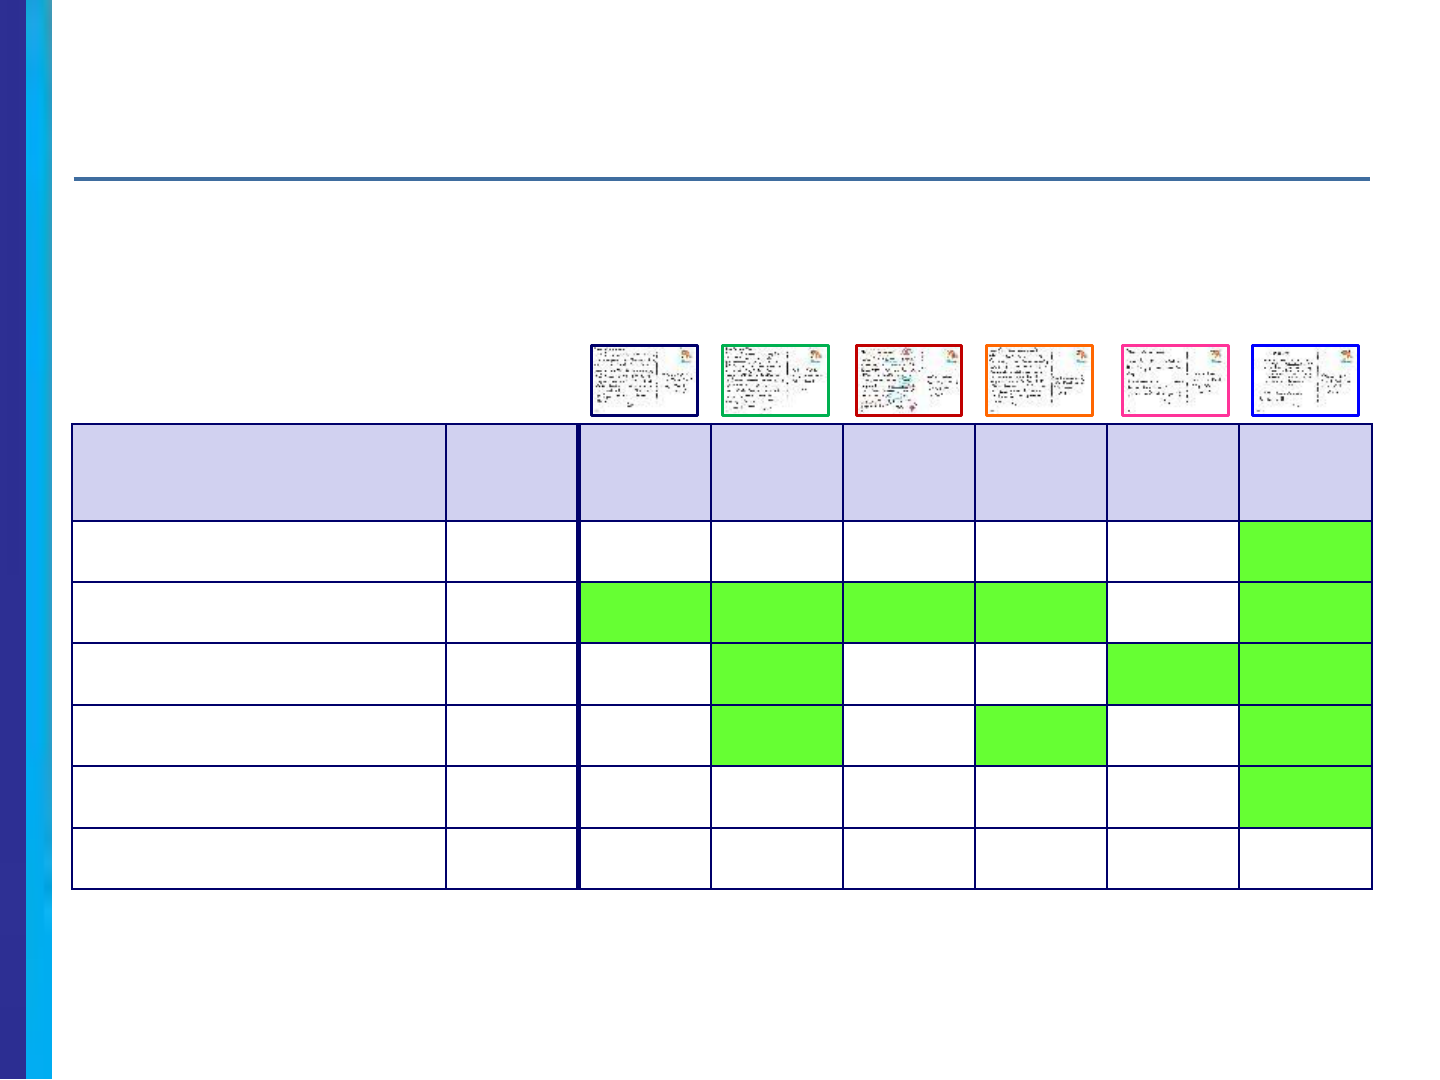
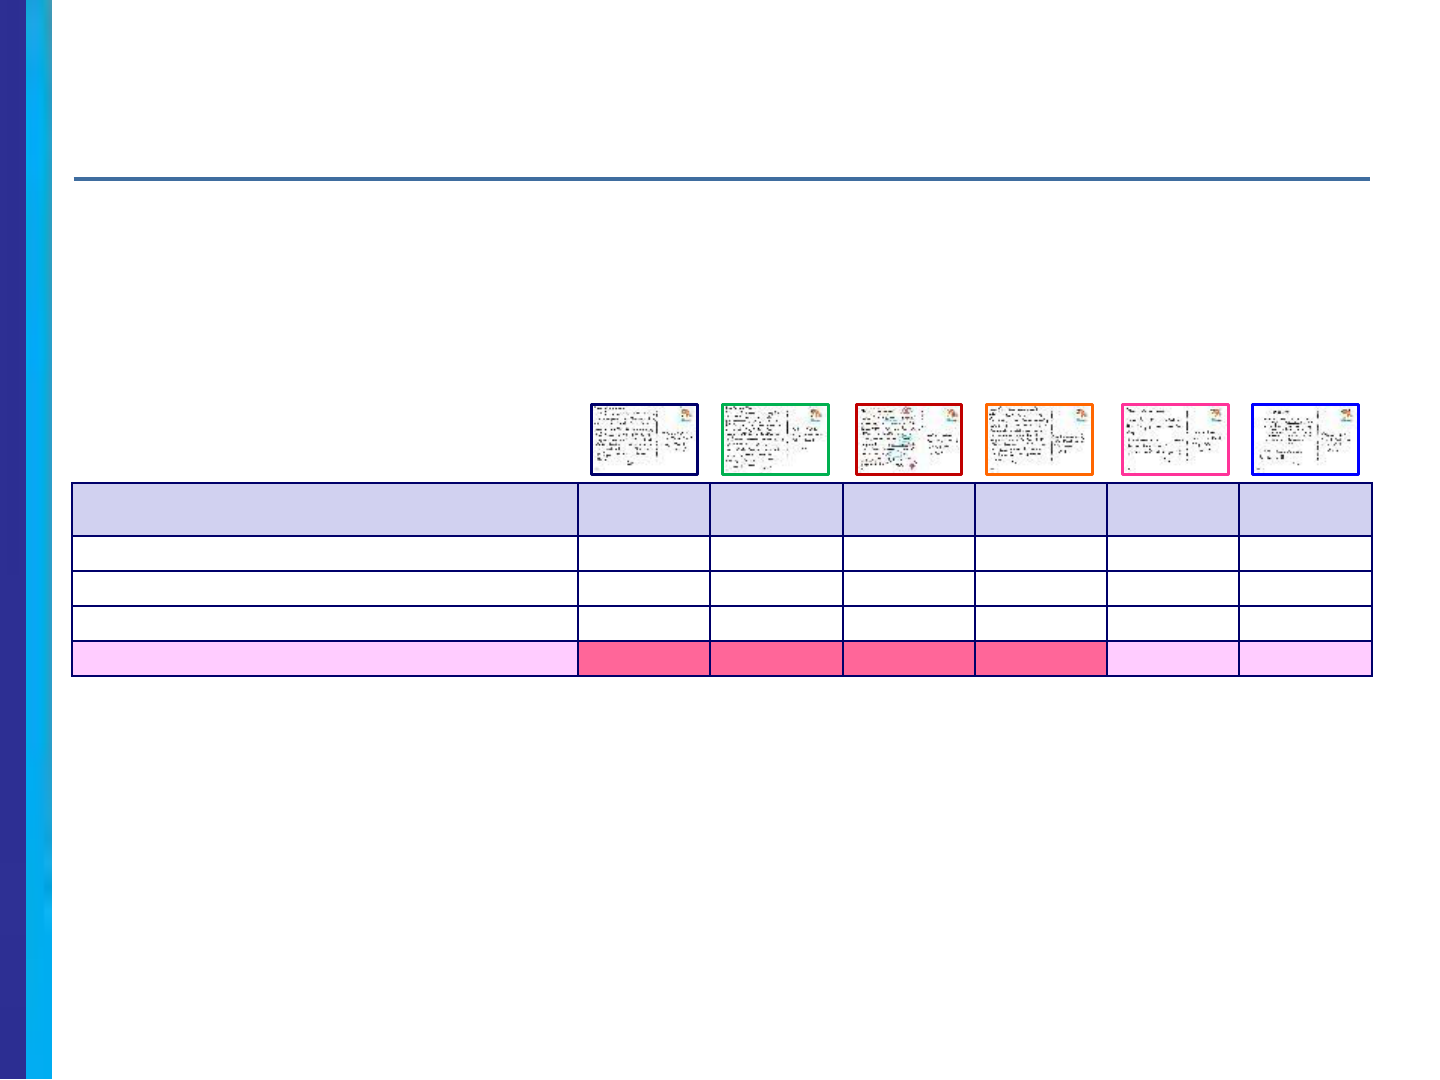
Summary of Impact on Likelihood to Take Actions – Total
❖ Overall two-thirds indicate the postcard would make them more likely to take some
action.
– VOLUNTEER and PREPRINTED are strongest on these measures.
– DECORATED and SHORT are weakest on these measures.
❖ PREPRINTED is the single strongest format for encouraging people to vote for this
candidate.
19
(Much more or somewhat more likely)
GRAND
TOTAL
%
BASE
(A)
%
VOLUN-
TEER
(B)
%
DECOR-
ATED
(C)
%
WITH NAME
(D)
%
SHORT
(E)
%
PRE-
PRINTED
(F)
%
More likely to take some action 66 65 73
CE
60 65 62 71
CE
More likely to pay attention to this
election
51 47 55
C
43 52
C
51 58
AC
More likely to vote 46 41 50
AC
40 48 48 46
More like to vote for this candidate 44 43
E
45
E
40 45
E
33 55
ABCDE
Make sure people are registered 40 38 43 38 39 40 42
A/F: Significantly higher than other group at the 90% confidence level.
Q8: What impact, if any, would receiving this postcard have on your likelihood to do the things listed below? Please select one answer for each item.
Summary of Impact on Selected Attitudes – Total
❖ Preprinted has a significant edge over other formats when it comes to key attitudes.
20
(Agree completely or agree)
GRAND
TOTAL
%
BASE
(A)
%
VOLUN-
TEER
(B)
%
DECOR-
ATED
(C)
%
WITH NAME
(D)
%
SHORT
(E)
%
PRE-
PRINTED
(F)
%
Reminds me about an upcoming
election
80 76 78 78 79 82 87
ABCD
Helps me know where candidate
stands on the issues
59 66
E
60
E
61
E
69
BCE
26 70
BCE
Makes me feel my vote would make
a difference
58 55 60
E
53 52 65
ACD
62
CD
Shows me that people like me are
getting involved
53 47 61
ACE
45 57
AC
50 56
AC
Indicates that this election is more
urgent than usual
48 47 46 43 49 45 56
ABCE
Makes me feel I don’t want to let the
postcard writer down
34 34 34 33 34 36 35
A/F: Significantly higher than other group at the 90% confidence level.
Q8: What impact, if any, would receiving this postcard have on your likelihood to do the things listed below? Please select one answer for each item.
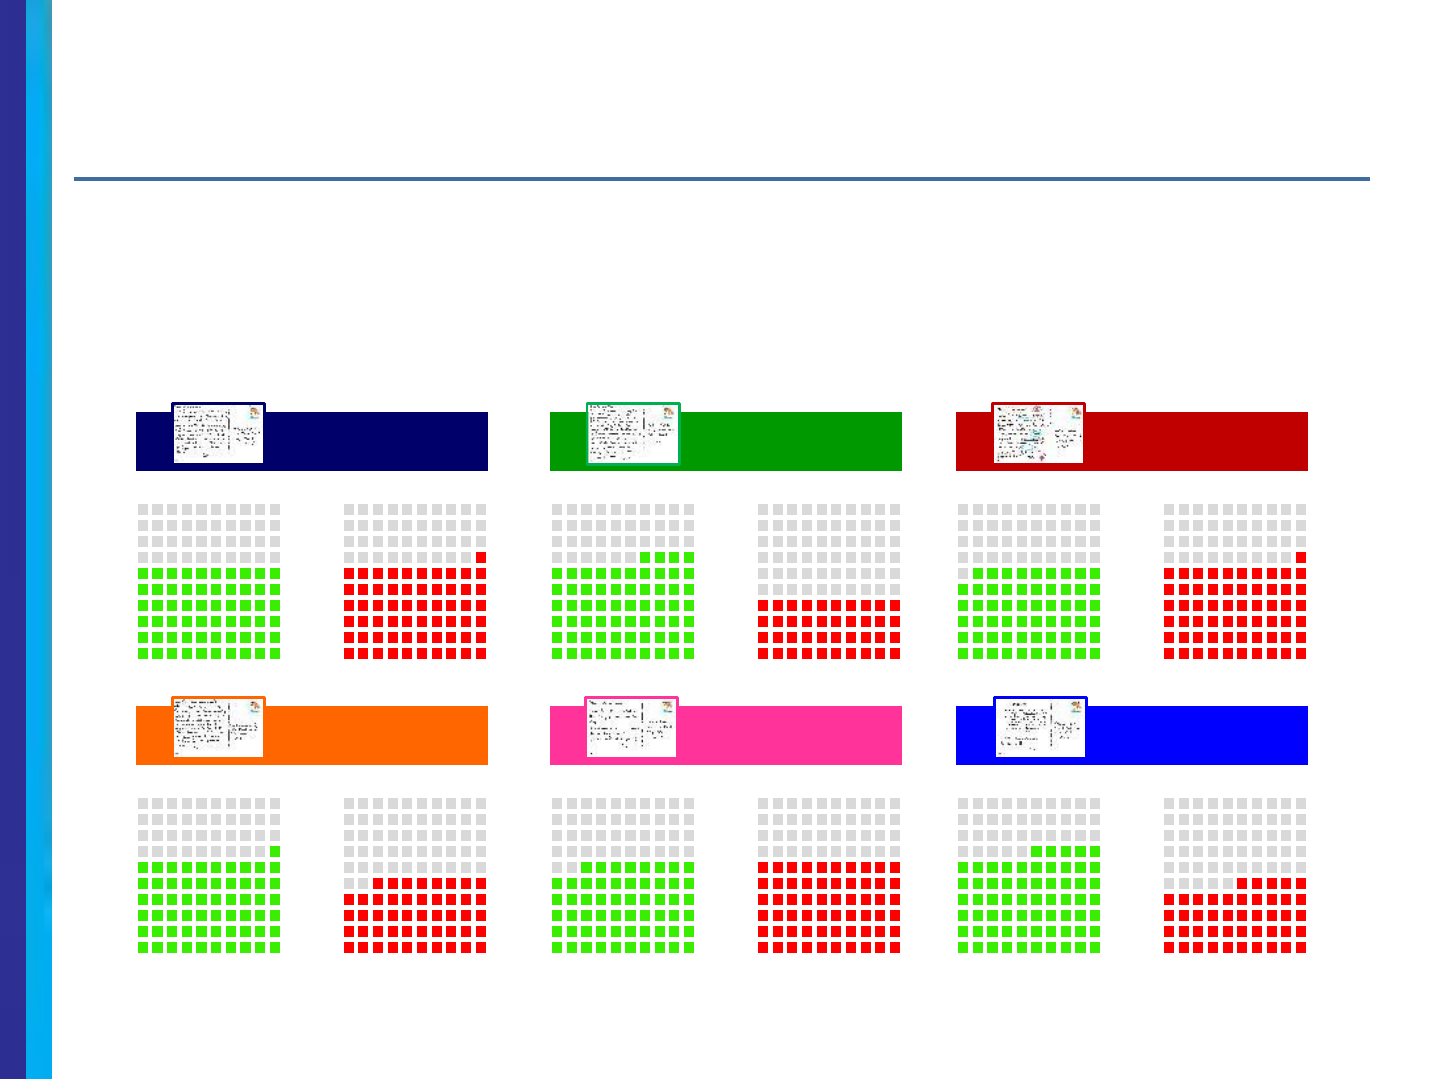
Volume of Positive Comments vs. Negative Comments
❖ VOLUNTEER and PREPRINTED show real strength with positive comments greatly
outweighing negative comments.
❖ WITH NAME also shows some strength.
❖ BASE, DECORATED, and SHORT receive equal proportions of positive vs. negative
comments.
21
PRE
-
PRINTED
SHORT
+20-2
Something NegativeSomething PositiveSomething NegativeSomething Positive
DECORATED
VOLUNTEER
-2+24
Something NegativeSomething PositiveSomething NegativeSomething Positive
WITH NAME
+13
Something NegativeSomething Positive
BASE
-1
Something NegativeSomething Positive
Q9a: What was it about the postcard that made you more likely to take action?
Q9b: What, if anything, was there about this postcard that you found unappealing or that could be improved?
Positive comments were similar across the six versions
❖ Respondents’ positive comments focused on the fact that the card:
– Was a reminder to vote
– Included the candidate’s views on some issues
– Was handwritten
– Was personal
❖ More differences surfaced when examining the negative comments. These are
covered next.
22
Q9a: What was it about the postcard that made you more likely to take action?
A majority named something about BASE, DECORATED, and
SHORT that was unappealing or could be improved
❖ Significantly fewer found something lacking with VOLUNTEER, WITH NAME, and
PREPRINTED.
23
BASE VOLUNTEER DECORATED
WITH NAME SHORT PREPRINTED
61%61%
60%
40%
48% 45%
Q9b: What, if anything, was there about this postcard that you found unappealing or that could be improved?
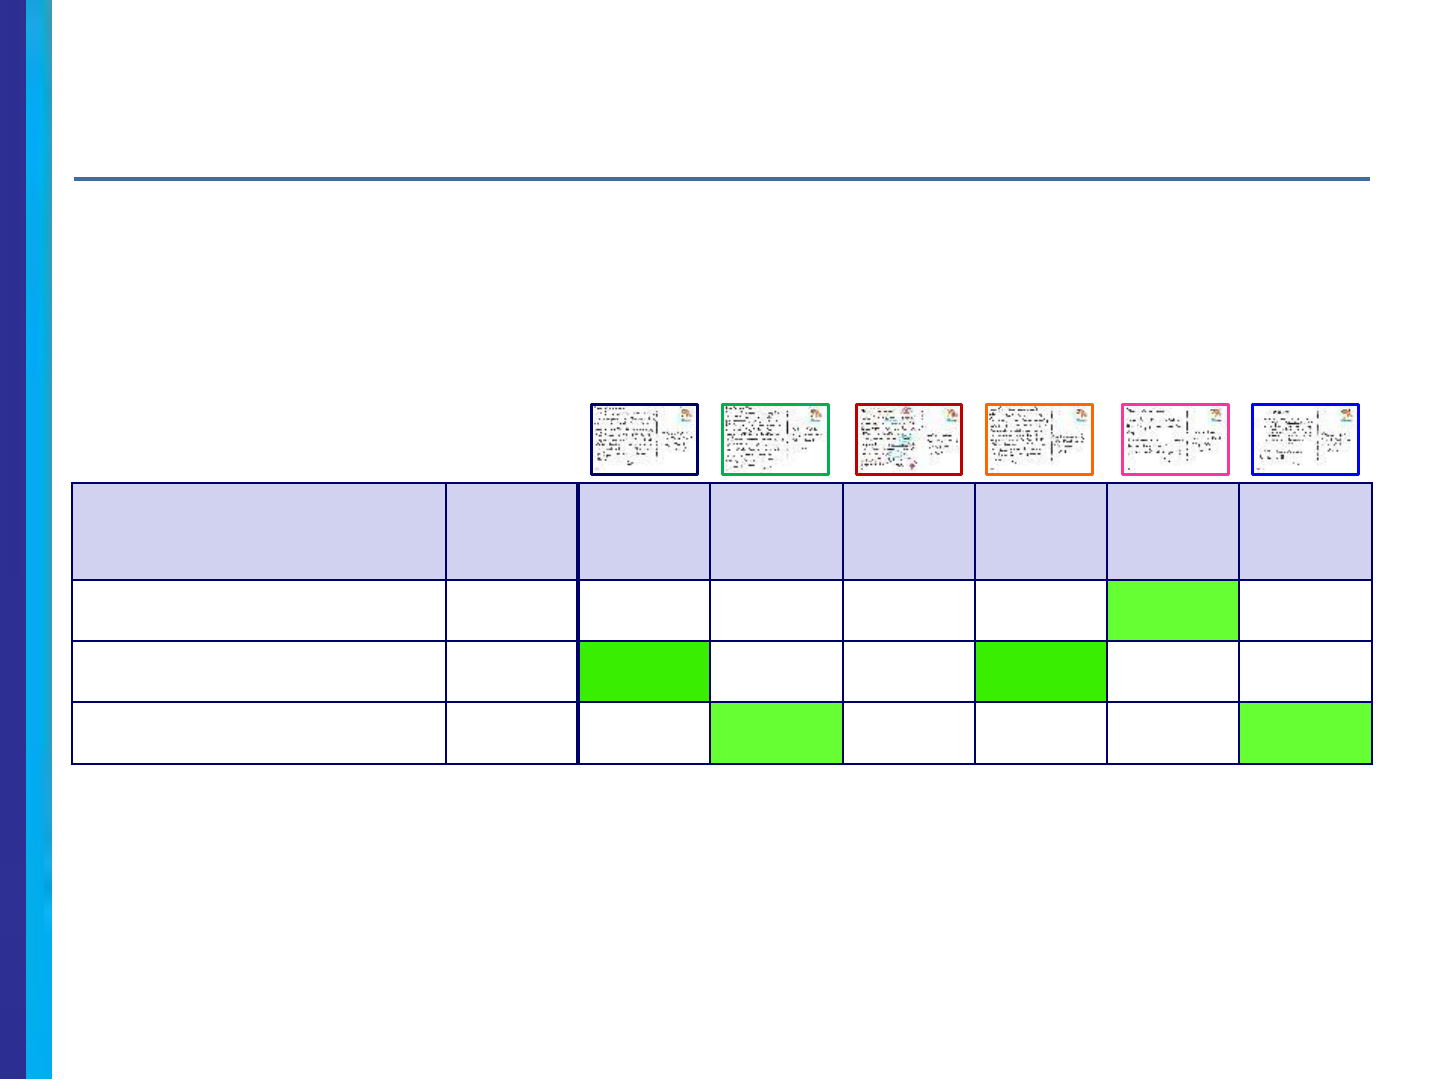
Negative mentions overall focused on the handwriting
24
# Negative Mentions
BASE
VOLUN-
TEER
DECOR-
ATED
WITH NAME SHORT
PRE-
PRINTED
Handwriting
45 41 37 39 21 17
More info specifics
26 10 11 18 55 27
Childish
15 2 45 8 6 7
Look
15 4 20 6 8 7
Inauthentic fake
14 8 1 12 4 6
Who is Jill?
5 2 3 5 11 5
Drawings
0 0 14 0 0 0
❖ Handwriting negatives were fewest for SHORT and PREPRINTED.
❖ The desire for more information/specifics was greatest for SHORT.
❖ DECORATED was criticized for being childish and having an overall unappealing look.
Q9b: What, if anything, was there about this postcard that you found unappealing or that could be improved?
Handwritten was a net negative for all six formats
❖ Not surprisingly, SHORT and PREPRINTED received the fewest net negatives for
handwriting.
25
BASE
VOLUN-
TEER
DECOR-
ATED
WITH NAME SHORT
PRE-
PRINTED
# Negative handwriting mentions
45 41 37 39 21 17
# Positive handwriting mentions
10 12 6 11 15 0
Net negative mentions
35 29 31 28 6 17
Q9b: What, if anything, was there about this postcard that you found unappealing or that could be improved?
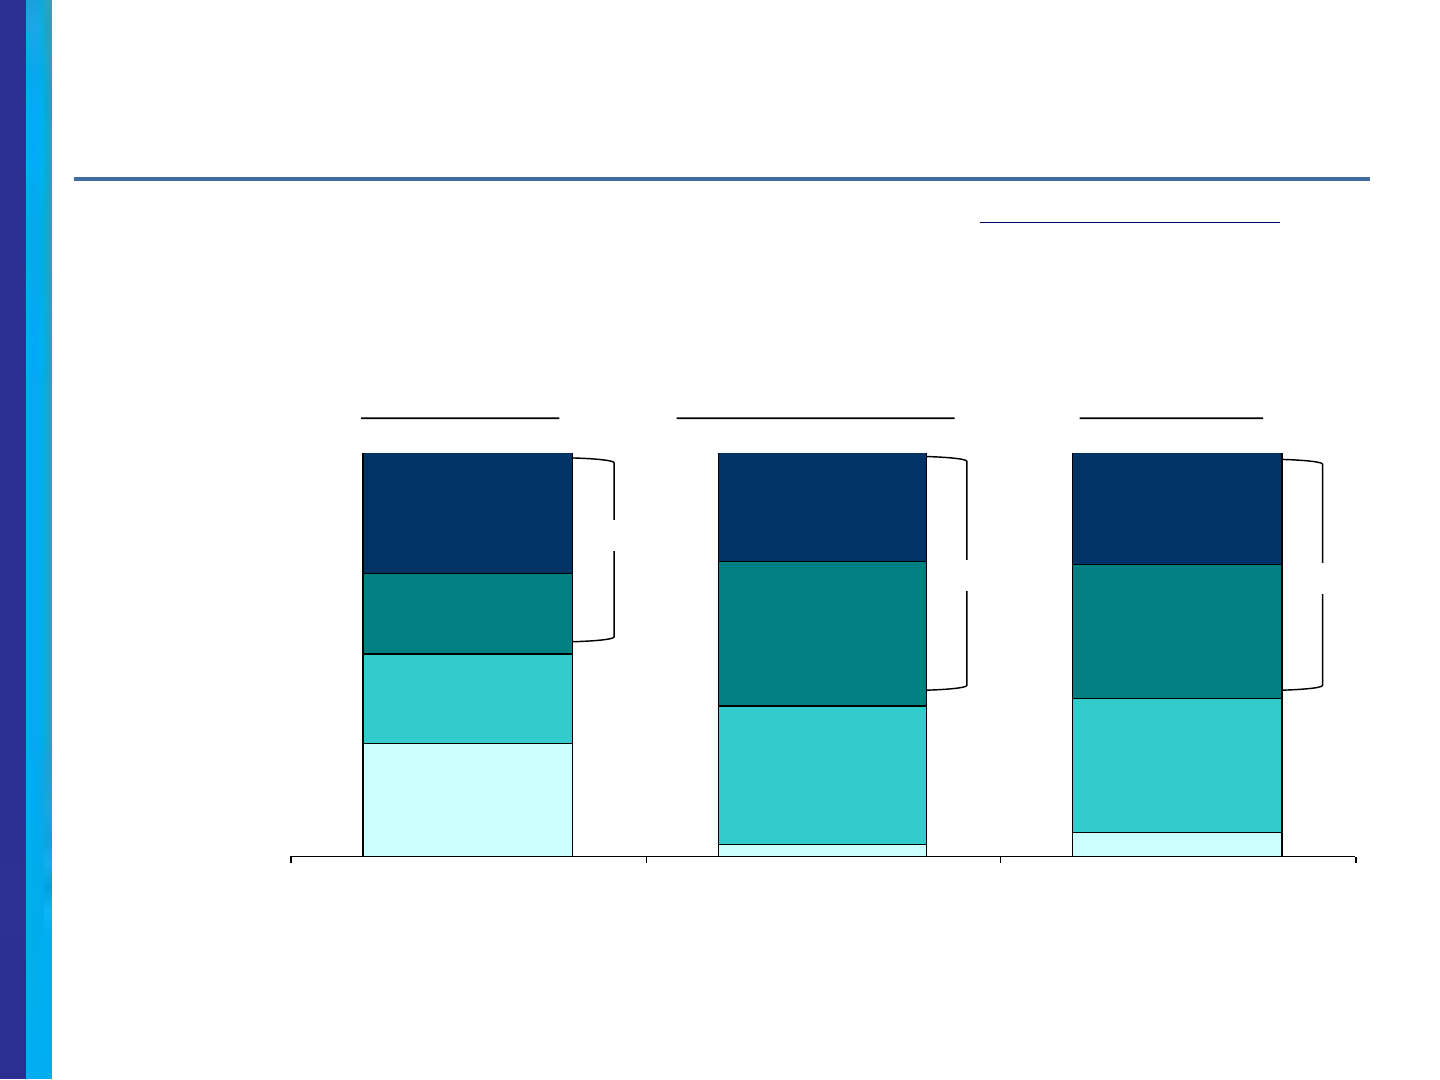
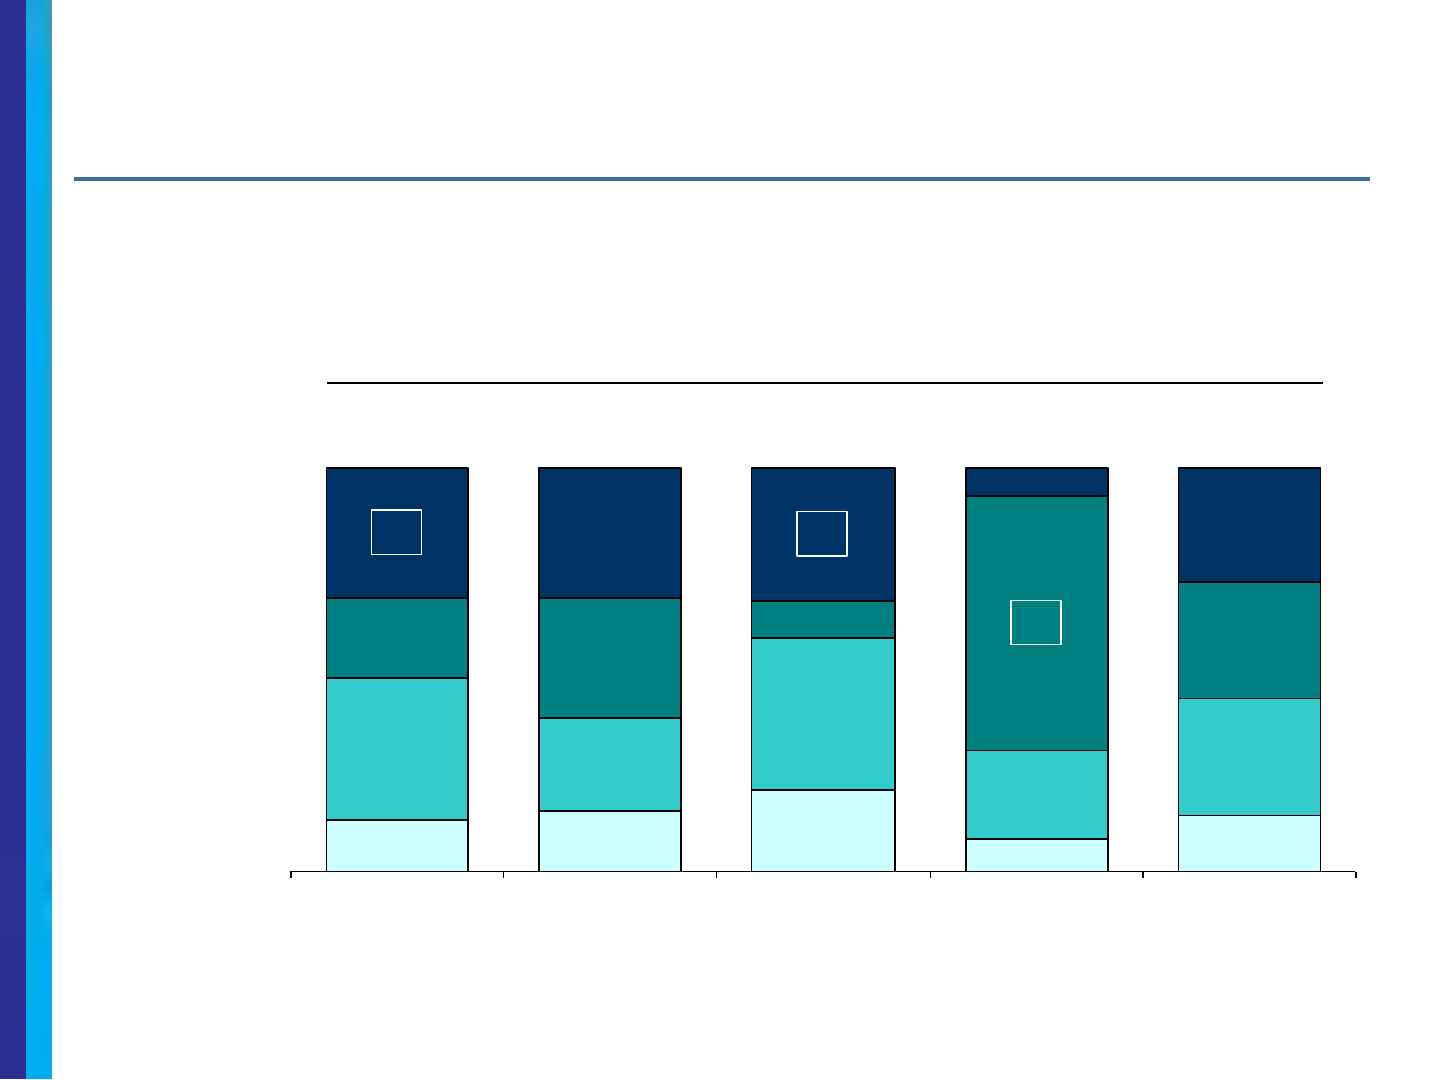
Impact of Decorations, Name, and Preprinting
26
34%
33%
3%
28%
6%
22%
36%
33%
20%
27%
28%
30%
No impact
Much more likely
Less likely
Somewhat more likely
Colorful Decorations
%
Addressed to You Personally
%
Partially Preprinted
%
63%
50%
61%
❖ Colorful decorations appear to be a net positive but they are somewhat polarizing with
almost 3-in-10 indicating less likelihood to take action.
❖ Personally addressing and partially preprinting are received favorably or neutrally with
little downside.
DECORATED WITH NAME PREPRINTED
Q13: Even though you may have already mentioned it, please indicate how, if at all, the colorful decorations affected your likelihood to read the
postcard.
Q14: Even though you may have already mentioned it, please indicate how, if at all, the fact that the postcard was addressed to you personally
affected your likelihood to read the postcard.
Q15: Even though you may have already mentioned it, please indicate how, if at all, the fact that some of the postcard was preprinted versus being all
hand-written affected your likelihood to read the postcard.
Preference varies across versions
27
❖ The most notable comparison is SHORT vs. BASE where BASE is preferred by a
factor of 9 to 1.
❖ Both VOLUNTEER and WITH NAME are significantly preferred over BASE.
8%
14%
23%
38%
29%
29%
7%
15%
13%
20%
22%
35%
63%
30%
9%
20%
32%
33%
32%
28%
Both would equally
Prefer Postcard
Neither would
Postcard Compared to Base
Prefer Base
(n=204) (n=203) (n=201) (n=205) (n=404)*
VOLUNTEER DECORATED WITH NAME SHORT PREPRINTED
= Significantly higher than other group at the 90% confidence level.
Q12: If you received these two postcards in the mail, which one would be more likely to get you to take some kind of action such as paying attention
to this election, voting, voting for this candidate, or making sure you were registered to vote?
*Note that the base for Preprinted is higher because it was paired against BASE twice—once when respondents evaluated PREPRINTED in detail
and again when respondents evaluated BASE in detail.

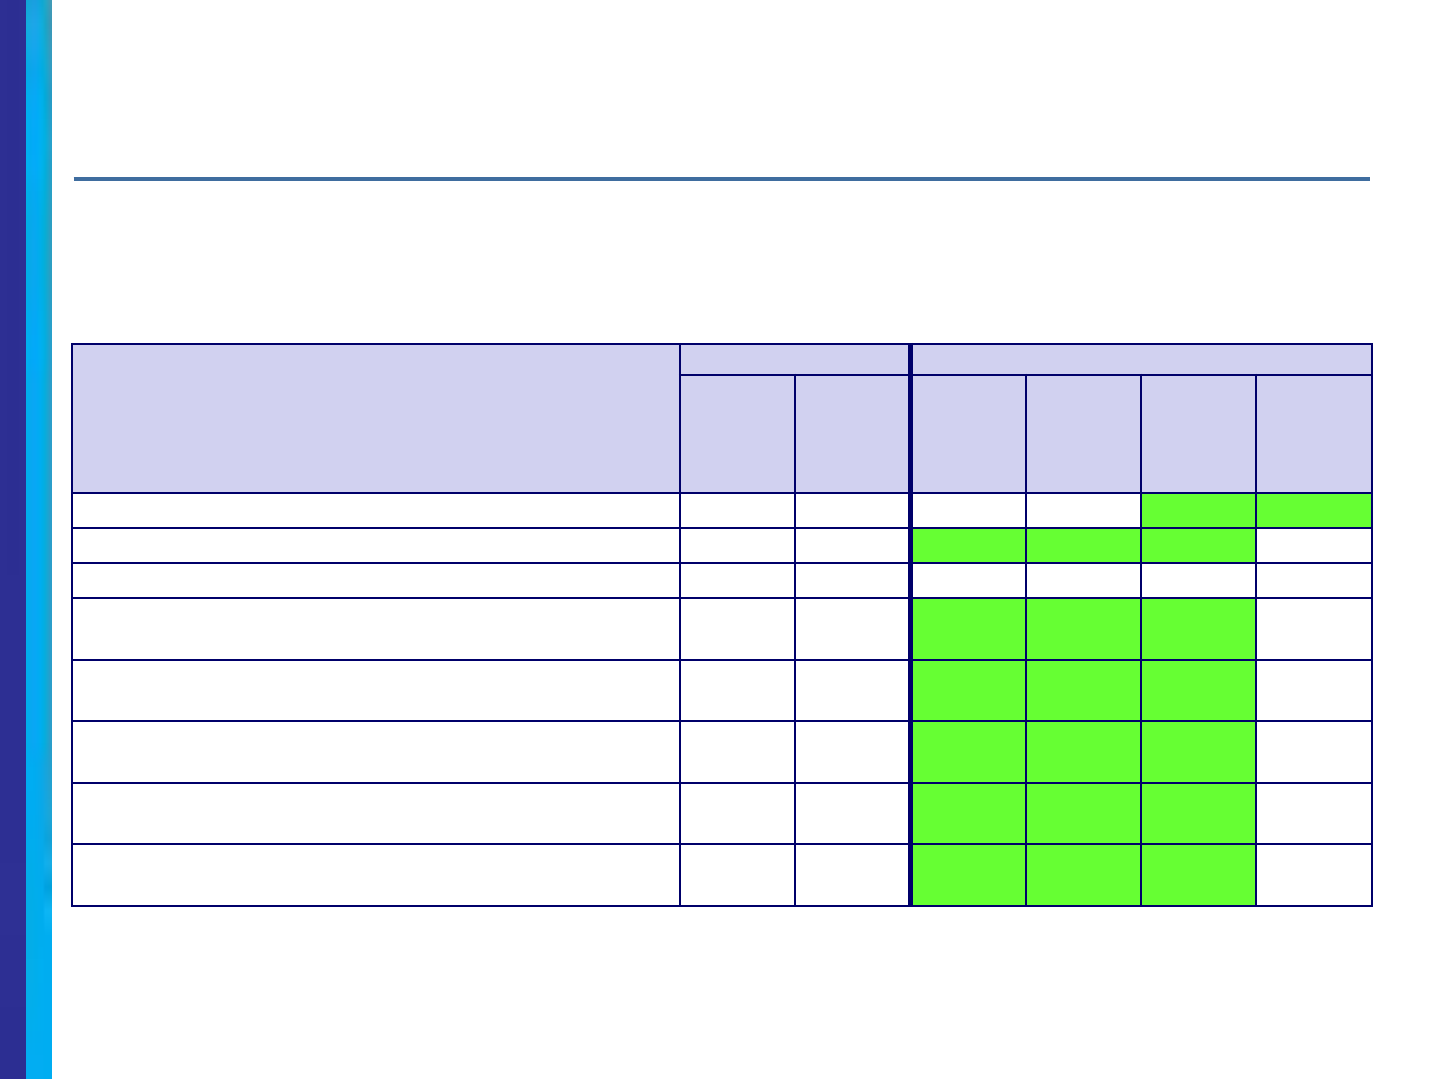
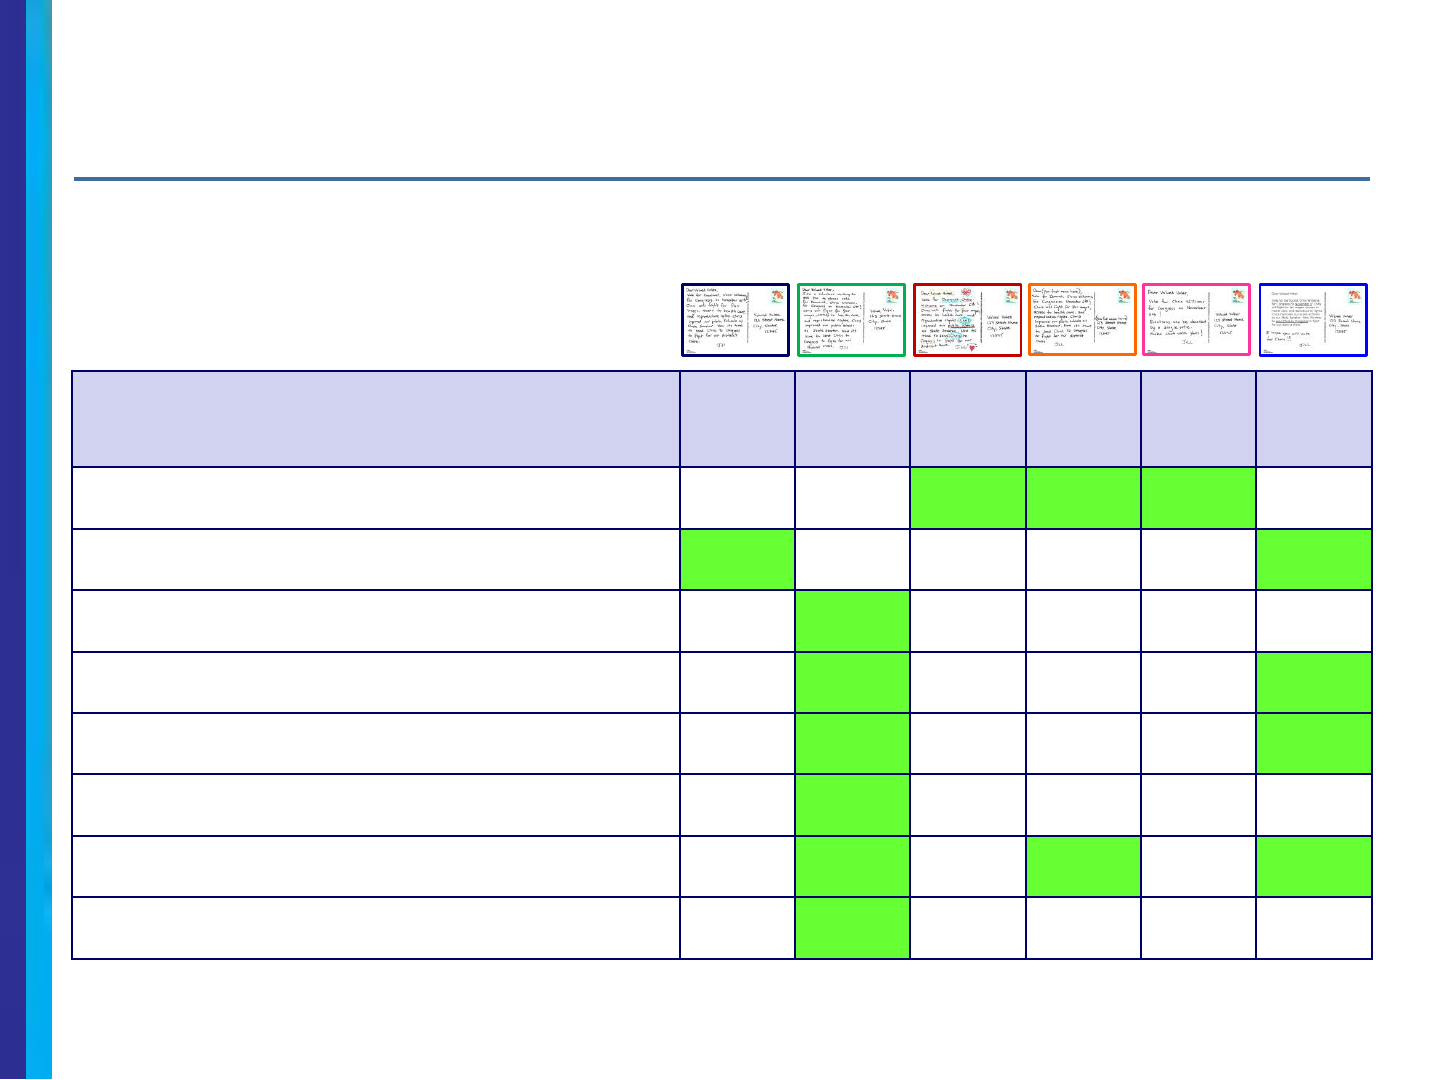
Summary of Key Measures for Selected Subgroups
28
Summary of Key Measures – Females
❖ Volunteer is the strongest format among Females followed by Preprinted.
29
BASE
(B)
%
VOLUN-
TEER
(C)
%
DECOR-
ATED
(D)
%
WITH
NAME
(E)
%
SHORT
(F)
%
PRE-
PRINTED
(G)
%
Would read/skim; then throw away 62 66 69 65 68 61
Would keep 25
C
15 19 26
C
19 22
Would share 13 20
E
13 9 13 17
E
More likely to take action
(Much more/somewhat more likely for 1+ items)
63 75
BDF
58 68 65 75
BDF
More likely to pay attention to this election
(Much more/somewhat more)
43 56
BD
39 55
BD
55
BD
60
BD
More likely to vote
(Much more/somewhat more)
40 55
BD
36 46 51
BD
48
More like to vote for this candidate
(Much more/somewhat more)
41 46
F
40 47
F
34 54
BDF
Make sure people are registered
(Much more/somewhat more)
34 46
B
37 39 40 39
B/G: Significantly higher than other group at the 90% confidence level.
Summary of Key Measures – Males
❖ Preprinted has a significant edge among Males on a key action—being more likely to
vote for this candidate.
30
BASE
(B)
%
VOLUN-
TEER
(C)
%
DECOR-
ATED
(D)
%
WITH
NAME
(E)
%
SHORT
(F)
%
PRE-
PRINTED
(G)
%
Would read/skim; then throw away 70 69 63 69 75
DG
63
Would keep 21 18 21 20 16 23
Would share 9 13 16 11 9 14
More likely to take action
(Much more/somewhat more likely for 1+ items)
67 70 61 62 60 72
More likely to pay attention to this election
(Much more/somewhat more)
53 54 48 50 47 56
More likely to vote
(Much more/somewhat more)
42 44 45 51 44 45
More like to vote for this candidate
(Much more/somewhat more)
46
F
44
F
40 43 32 56
DEF
Make sure people are registered
(Much more/somewhat more)
43 39 40 40 40 45
B/G: Significantly higher than other group at the 90% confidence level.
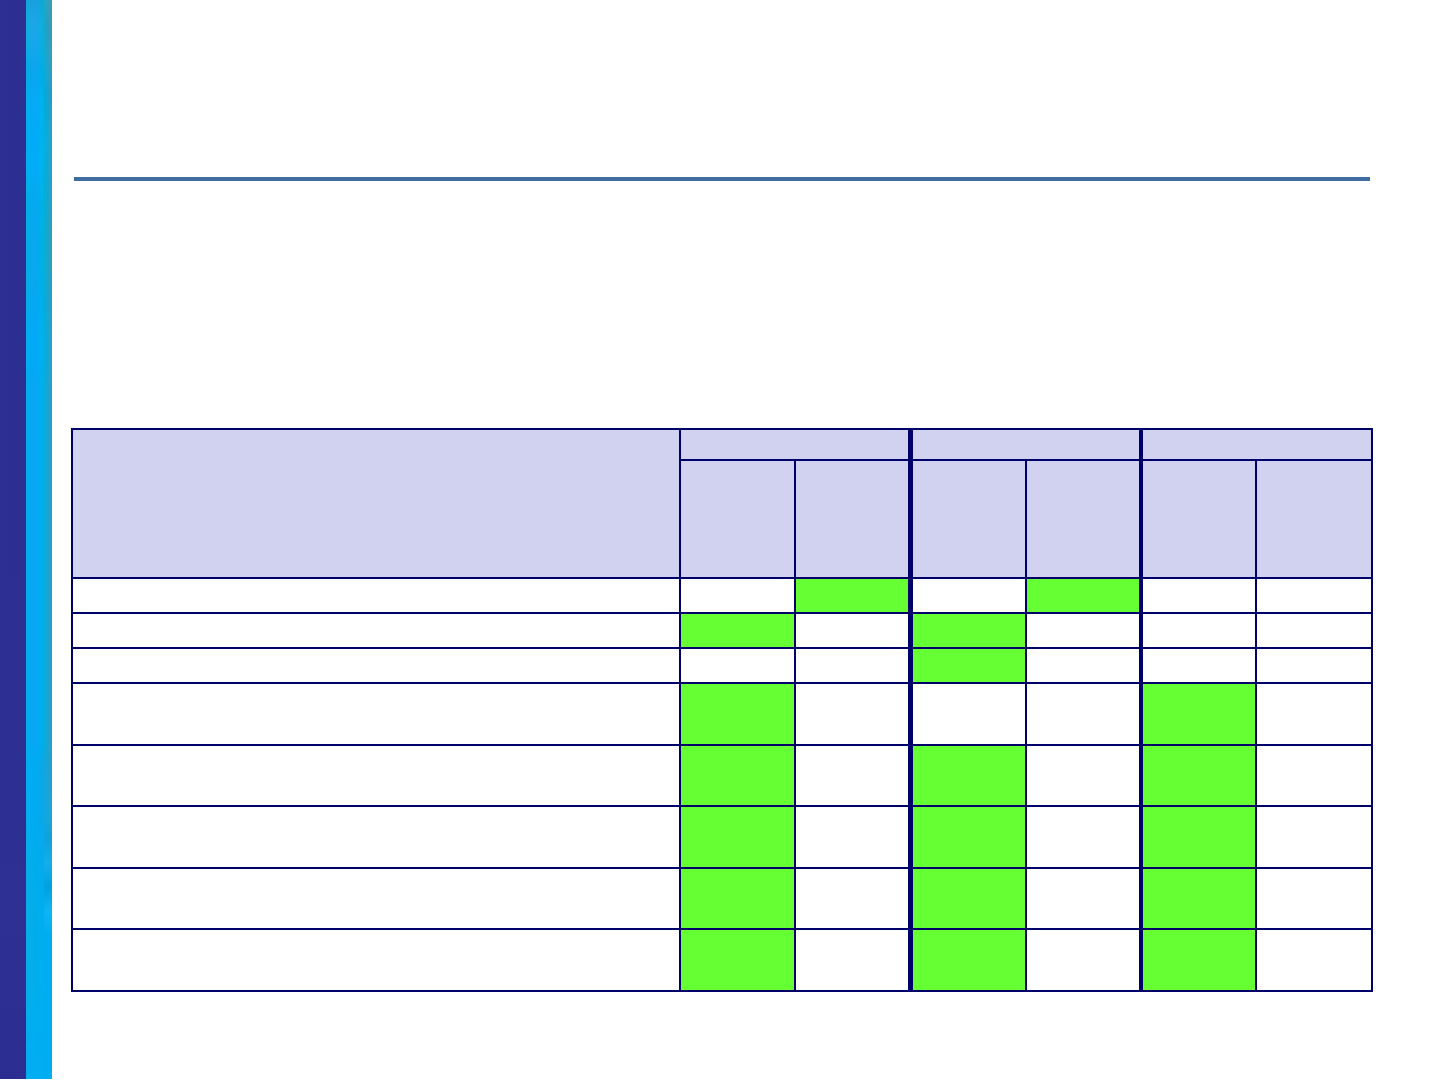
Summary of Key Measures – Under 45
❖ Younger registered Democrats significantly prefer the With Name version but are also
partial to Preprinted which gets the highest rating for “more likely to vote for this
candidate”.
31
BASE
(B)
%
VOLUN-
TEER
(C)
%
DECOR-
ATED
(D)
%
WITH
NAME
(E)
%
SHORT
(F)
%
PRE-
PRINTED
(G)
%
Would read/skim; then throw away 64 70
DE
55 58 64 62
Would keep 23 18 27
C
31
C
24 22
Would share 13 12 17 11 12 15
More likely to take action
(Much more/somewhat more likely for 1+ items)
72 75 67 75 71 77
More likely to pay attention to this election
(Much more/somewhat more)
50 57 54 64
B
60 58
More likely to vote
(Much more/somewhat more)
48 53 50 56 55 56
More like to vote for this candidate
(Much more/somewhat more)
51 45 48 52
F
39 63
BDF
Make sure people are registered
(Much more/somewhat more)
49 42 48 54
C
49 49
B/G: Significantly higher than other group at the 90% confidence level.
Summary of Key Measures – 45+
❖ Older registered Democrats strongly prefer the Volunteer format but give significantly
higher ratings for Preprinted on key actions as well.
32
BASE
(B)
%
VOLUN-
TEER
(C)
%
DECOR-
ATED
(D)
%
WITH
NAME
(E)
%
SHORT
(F)
%
PRE-
PRINTED
(G)
%
Would read/skim; then throw away 68 65 77
CG
75
G
78
BCG
62
Would keep 22
DF
15 12 17 11 22
DF
Would share 10 21
BDEF
12 9 10 16
More likely to take action
(Much more/somewhat more likely for 1+ items)
59 70
BDEF
52 56 55 65
D
More likely to pay attention to this election
(Much more/somewhat more)
45 54
DE
33 41 43 57
BDEF
More likely to vote
(Much more/somewhat more)
35 47
BD
31 41 42 37
More like to vote for this candidate
(Much more/somewhat more)
37 44
DF
32 39
F
27 47
DF
Make sure people are registered
(Much more/somewhat more)
29 43
BDEF
29 25 32 35
B/G: Significantly higher than other group at the 90% confidence level.
Summary of Key Measures – HHI <$75K
❖ Lower income registered Democrats (<$75K HHI) give significantly higher ratings to
Preprinted.
33
BASE
(B)
%
VOLUN-
TEER
(C)
%
DECOR-
ATED
(D)
%
WITH
NAME
(E)
%
SHORT
(F)
%
PRE-
PRINTED
(G)
%
Would read/skim; then throw away 64 64 54 61 71
DG
56
Would keep 21 15 28
C
32
CF
18 26
Would share 15 21
E
18
E
7 12 18
E
More likely to take action
(Much more/somewhat more likely for 1+ items)
64 75 72 69 69 80
B
More likely to pay attention to this election
(Much more/somewhat more)
47 58 55 56 55 68
B
More likely to vote
(Much more/somewhat more)
44 59 54 52 50 55
More like to vote for this candidate
(Much more/somewhat more)
46 46 49 46 37 63
BCEF
Make sure people are registered
(Much more/somewhat more)
43 52 46 43 45 50
B/G: Significantly higher than other group at the 90% confidence level.
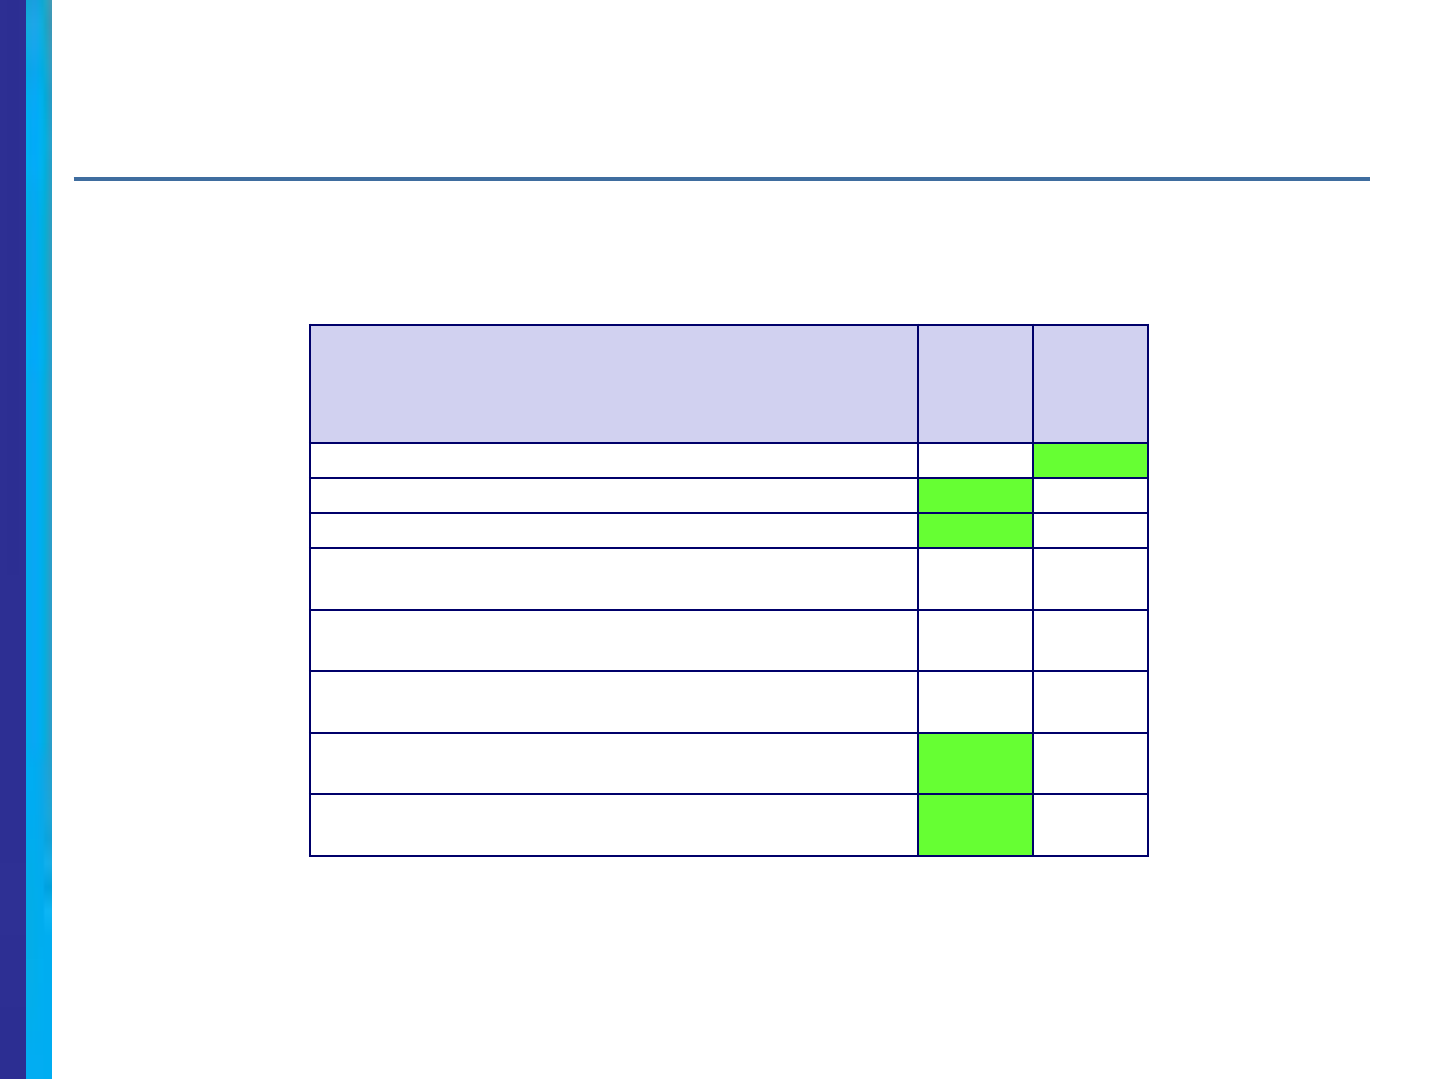
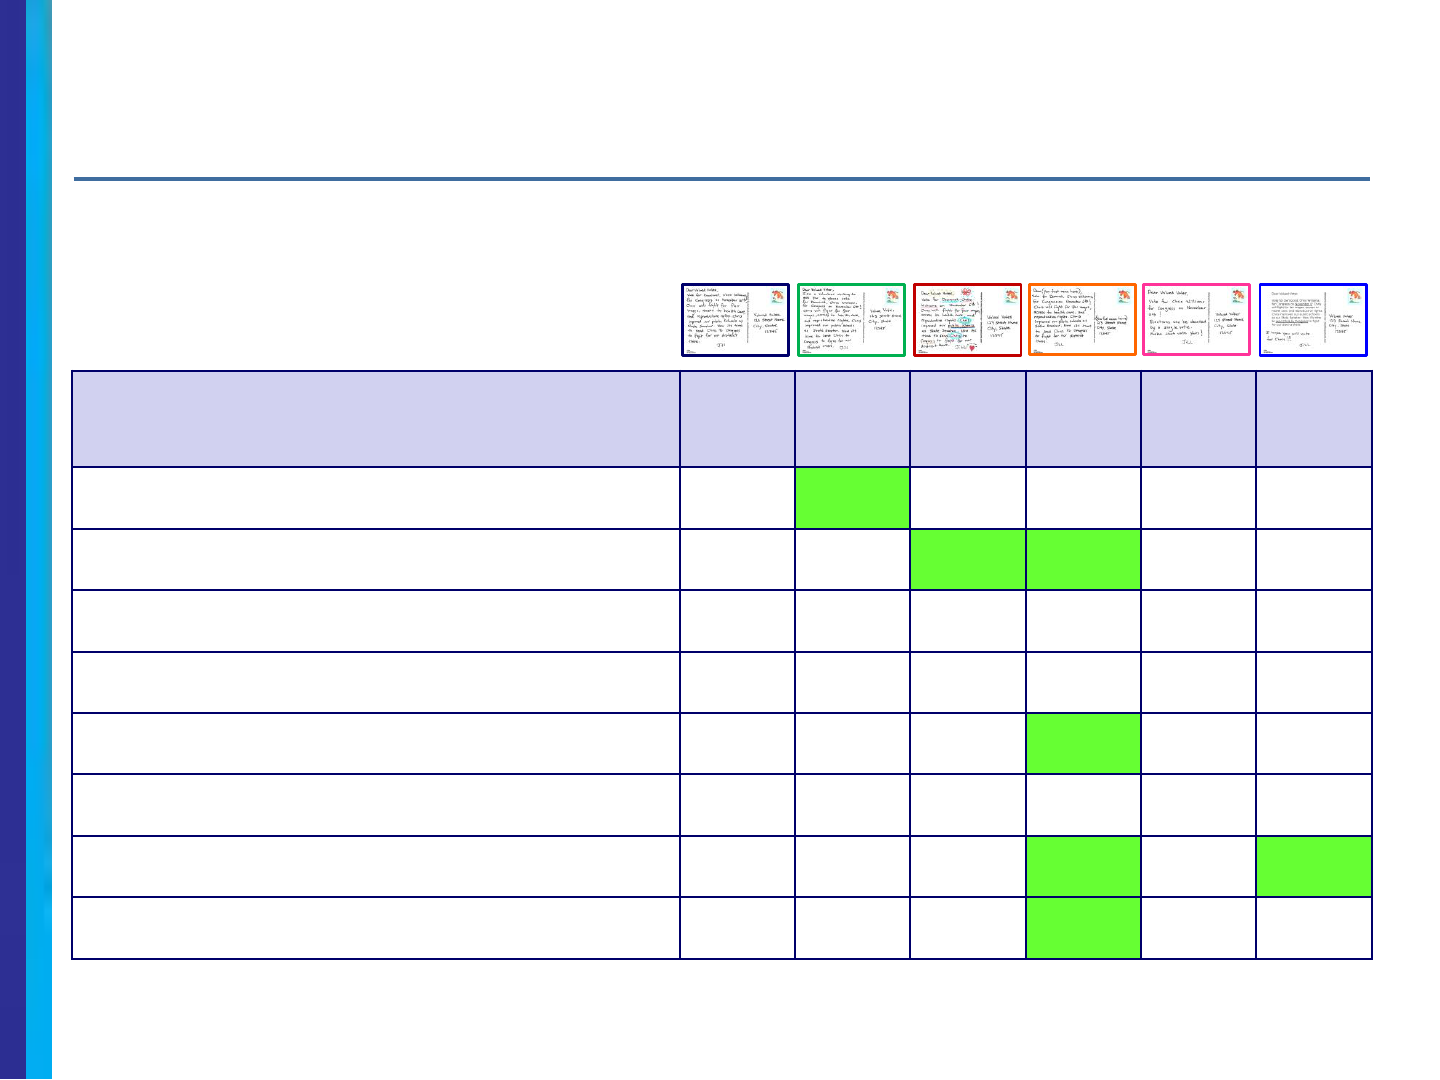
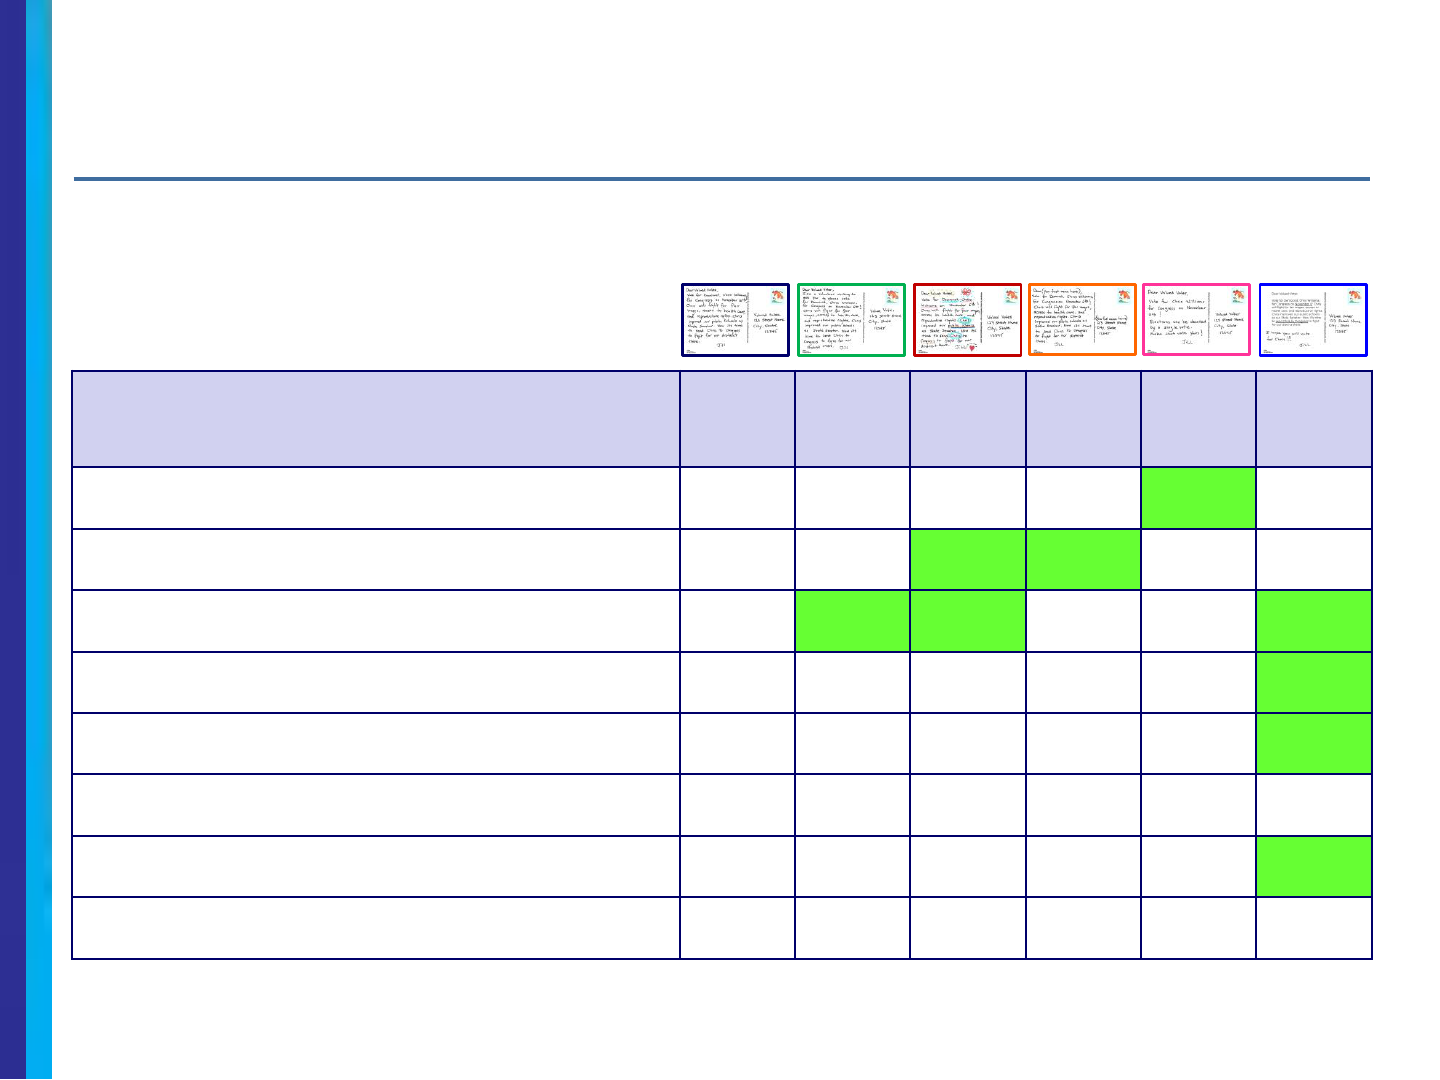
Summary of Key Measures – HHI $75K+
❖ Decorated is particularly weak among $75K+ HHI households. The Short format is also
weak but has an edge over Decorated for being more likely to vote.
34
BASE
(B)
%
VOLUN-
TEER
(C)
%
DECOR-
ATED
(D)
%
WITH
NAME
(E)
%
SHORT
(F)
%
PRE-
PRINTED
(G)
%
Would read/skim; then throw away 68 70 74 71 72 67
Would keep 23 17 14 17 18 19
Would share 9 14 12 12 11 15
More likely to take action
(Much more/somewhat more likely for 1+ items)
66
D
70
DF
51 62 56 64
D
More likely to pay attention to this election
(Much more/somewhat more)
48
D
53
D
35 50
D
47 51
D
More likely to vote
(Much more/somewhat more)
38 42 31 45
D
46
D
40
More like to vote for this candidate
(Much more/somewhat more)
43
F
44
F
34 44
F
28 51
DF
Make sure people are registered
(Much more/somewhat more)
35 36 33 37 35 36
B/G: Significantly higher than other group at the 90% confidence level.
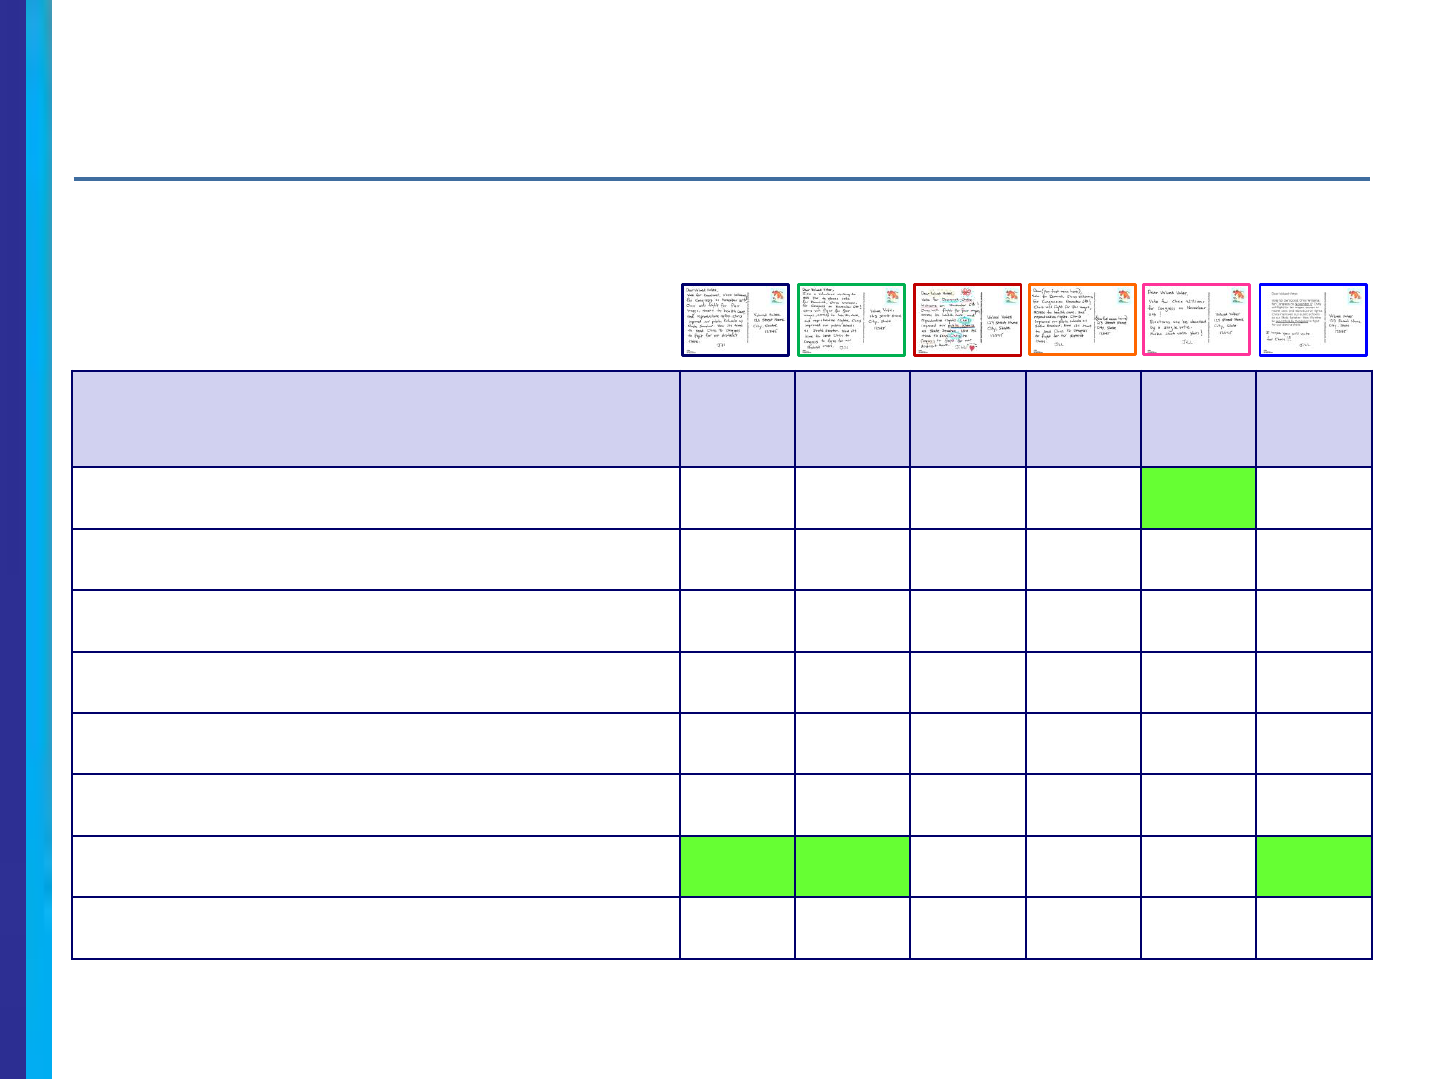
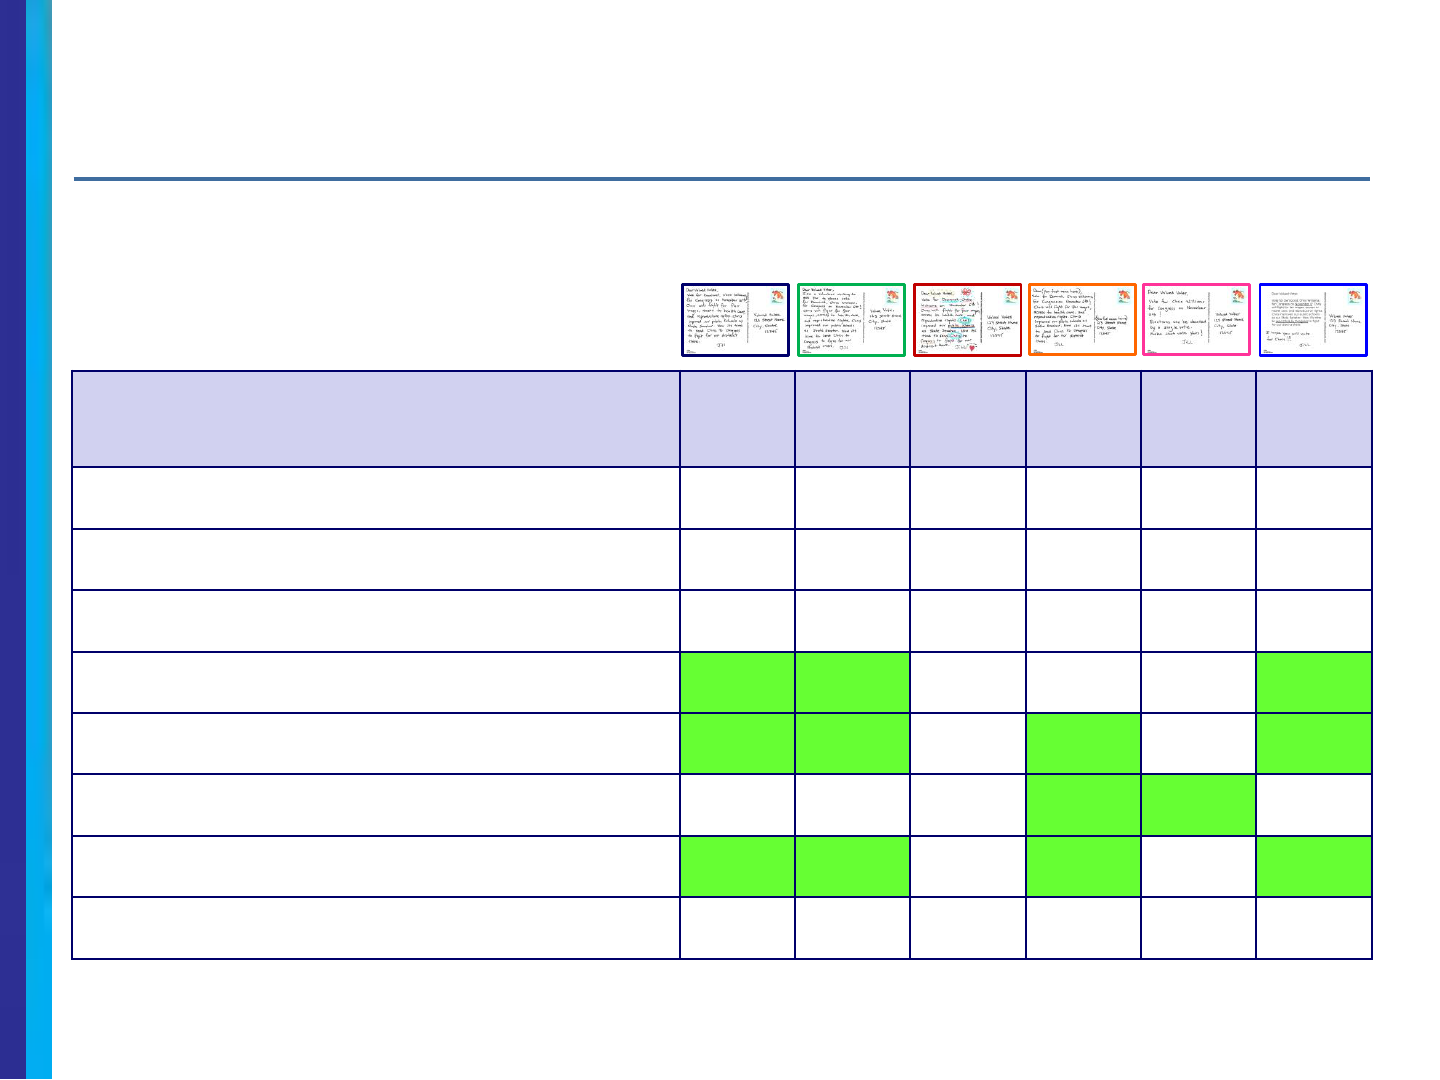
Summary of Key Measures – Red States
❖ Red State Democrats show preference for the Volunteer version and the Pre-printed
version. Like the other groups, they like the Short version the least.
35
BASE
(B)
%
VOLUN-
TEER
(C)
%
DECOR-
ATED
(D)
%
WITH
NAME
(E)
%
SHORT
(F)
%
PRE-
PRINTED
(G)
%
Would read/skim; then throw away 69 58 57 60 70 63
Would keep 21 22 21 24 15 22
Would share 11 20 22 16 15 12
More likely to take action
(Much more/somewhat more likely for 1+ items)
63 78
B
67 66 66 73
More likely to pay attention to this election
(Much more/somewhat more)
43 61
B
49 55 55 63
B
More likely to vote
(Much more/somewhat more)
43 57 49 54 48 45
More like to vote for this candidate
(Much more/somewhat more)
48
F
52
F
51
F
49
F
30 63
F
Make sure people are registered
(Much more/somewhat more)
40 51 49 41 44 45
B/G: Significantly higher than other group at the 90% confidence level.
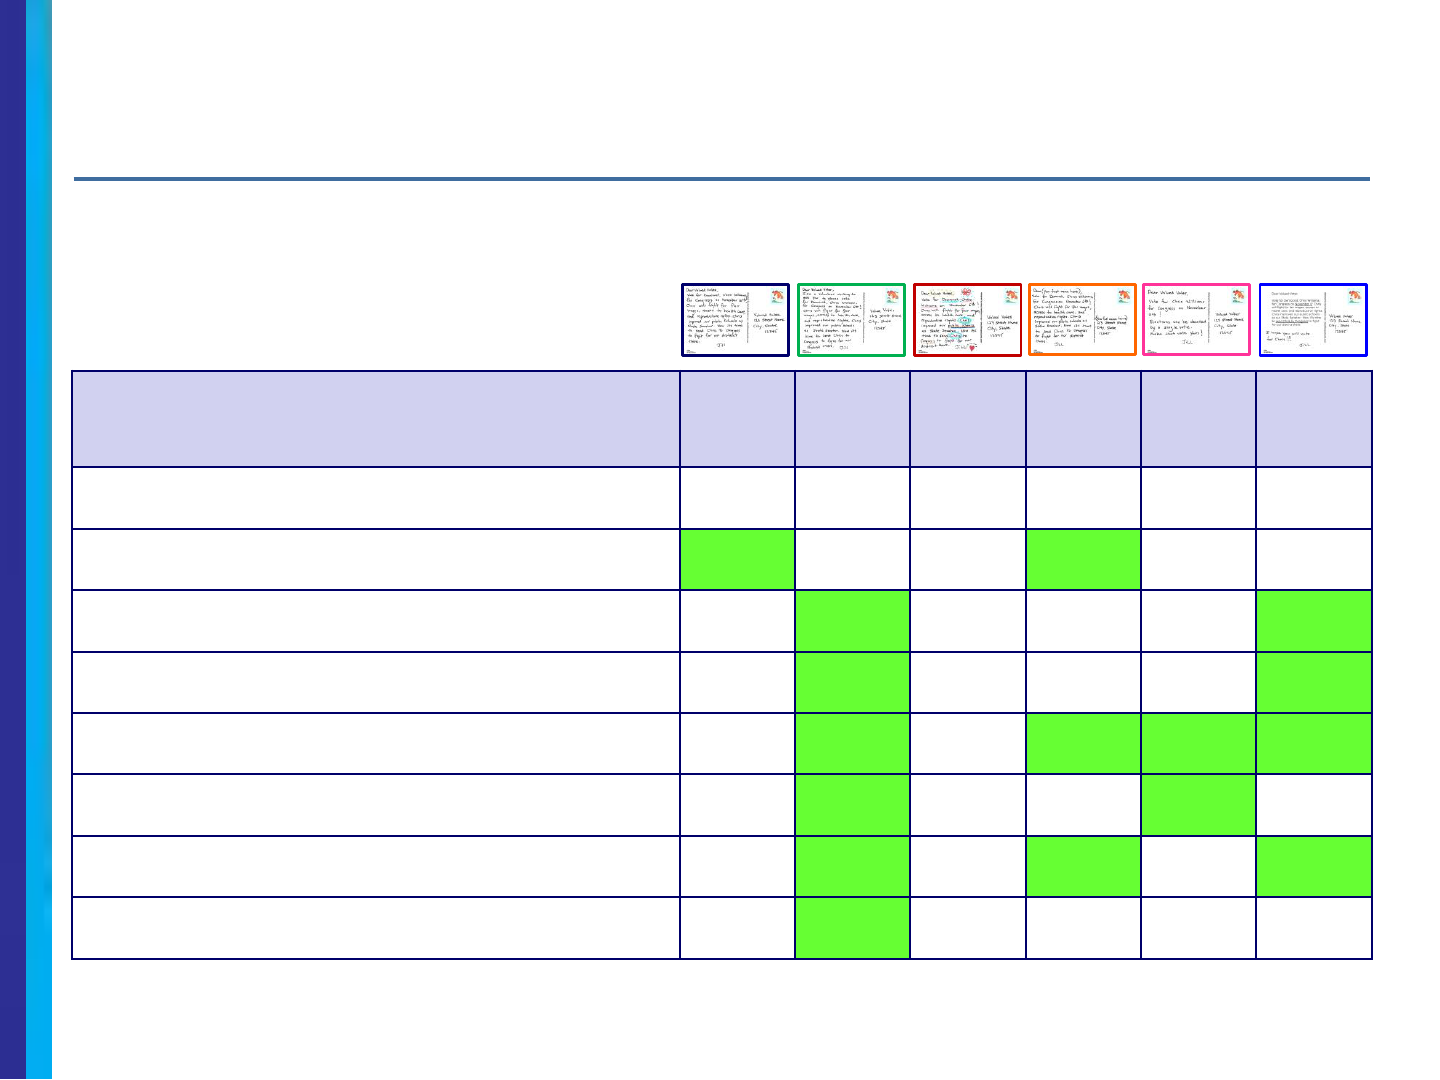
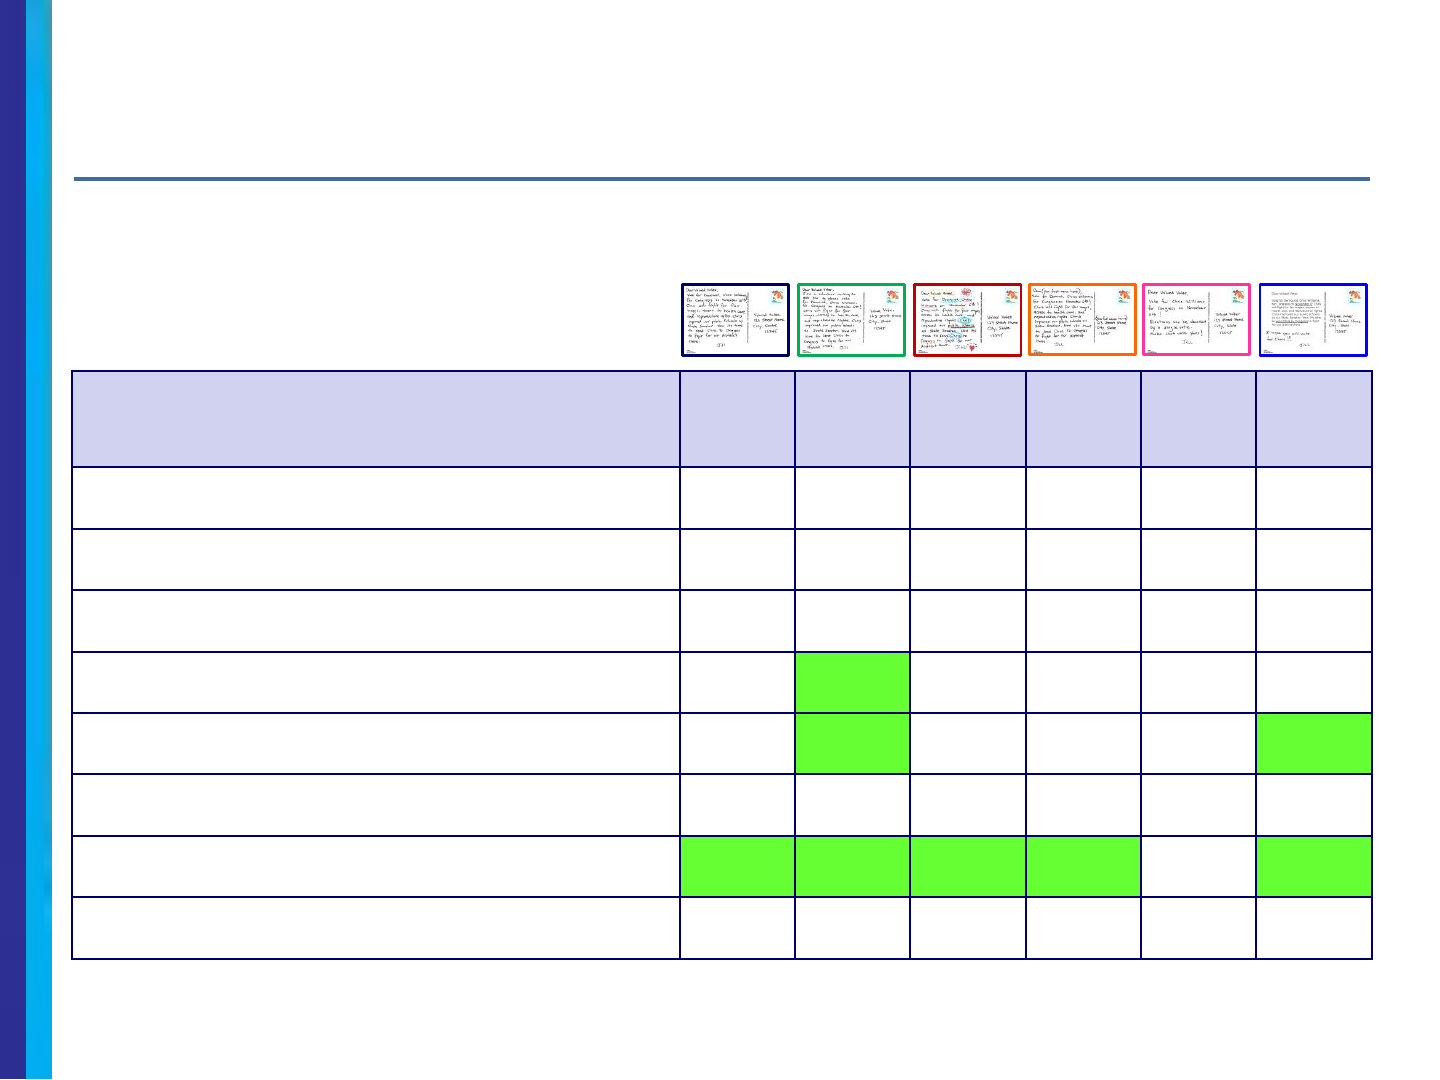
Summary of Key Measures – Blue States
❖ Blue State Democrats also show preference for the Volunteer version and the Pre-
printed version. While the Short version performs weakly on most dimensions, it
appears to be a good reminder to vote
for Blue State Democrats.
36
BASE
(B)
%
VOLUN-
TEER
(C)
%
DECOR-
ATED
(D)
%
WITH
NAME
(E)
%
SHORT
(F)
%
PRE-
PRINTED
(G)
%
Would read/skim; then throw away 65 72 71 71 72 62
Would keep 24
C
13 19 23
C
19 22
Would share 12 15
E
10 6 9 16
E
More likely to take action
(Much more/somewhat more likely for 1+ items)
66 70
D
56 65 61 69
D
More likely to pay attention to this election
(Much more/somewhat more)
50 53
D
41 50 49 55
D
More likely to vote
(Much more/somewhat more)
40 46 36 45 48
D
47
More like to vote for this candidate
(Much more/somewhat more)
41 41 34 43 35 51
DF
Make sure people are registered
(Much more/somewhat more)
38 39 33 39 38 40
B/G: Significantly higher than other group at the 90% confidence level.

Reasons for Preference
Following individual postcard evaluations, respondents were exposed to a
second version and asked their preference vs. the BASE version and why.
While it is unlikely in the real world that the same person would receive two
different versions of the postcard, this exercise served to crystallize
respondents’ reactions and preferences.
[See page 27 for quantitative results.]
37
Reasons for 28% Preferring PREPRINTED
38
Sample Verbatims
• The message on the bottom is much neater and easier to read. This card gives a better impression of the candidate.
• It looks more professional.
• It is type written which does make a difference to me. Neater. Easier to read. Still had a personal touch at the end with
the handwritten ending.
• Not as juvenile.
• I prefer the higher level of formality in type-written.
• More professional and easy to read.
• More professional looking, yet with a personal handwritten touch.
• The little handwritten note from Jill made it a little more personalized.
• It is easier to read for sure.
Reasons for 32% Preferring VOLUNTEER
39
Sample Verbatims
• The use of the word “please”.
• It’s a little more personal coming from a volunteer.
• It included the introduction rather than just saying to vote.
• Because a volunteer asked you to vote.
• States that the person is a volunteer which means they’re not getting paid which means they strongly believe in what
they’re doing and who they support.
• I like that Jill introduces herself.
• Statement abut volunteer writing about the candidate. It was done politely, not telling me but asking me to please.
Reasons for 33% Preferring WITH NAME
40
Sample Verbatims
• They bothered to put my name in it, not just a generic greeting.
• Includes my name so more personalized.
• It’s the use of the first name over valued voter. The latter is usually comically offensive.
• It’s personal. With my name is speaks directly to me. Valued Voter is a cliché.
Reasons for 29% Preferring BASE
41
Sample Verbatims
• The handwritten version is more personable than the typewritten version. (vs. PREPRINTED)
• Looks more personal and someone took the time to handwrite it. (vs. PREPRINTED)
• It seemed more formal. (vs. VOLUNTEER)
• It was more direct. (vs. VOLUNTEER)
• More serious look. (vs. DECORATED)
• It doesn’t look like it was written by a kid. (vs. DECORATED)
• Didn’t have to put my full name on the postcard!!! (vs. WITH NAME)
• It would be a little creepy for my name to be in the message and it would be a little too familiar. (vs. WITH NAME)
• It included information on the candidate. (vs. SHORT)
• It had more details. (vs. SHORT)
Reasons for 32% Preferring DECORATED
42
Sample Verbatims
• Seemed more friendly.
• More eye-catching.
• Because it was signed with a heart which made it feel more personal.
• It looks cuter and more like a child made it.
• It’s more expressive than the second one and just straight more fun!
Reasons for 7% Preferring SHORT
43
Sample Verbatims
• Straight to the point.
• Not as busy.
• It was short and simple.
• Shorter and more concise.
