Name: ____________________________________________
1) Which statement best describes the stratosphere? [Refer to
the Earth Science Reference Tables.]
A) It is located 75 kilometers above sea level.
B) It absorbs large amounts of water vapor from the
troposphere.
C) It has greater pressure at the top than at the bottom.
D) It is warmer at the top than at the bottom.
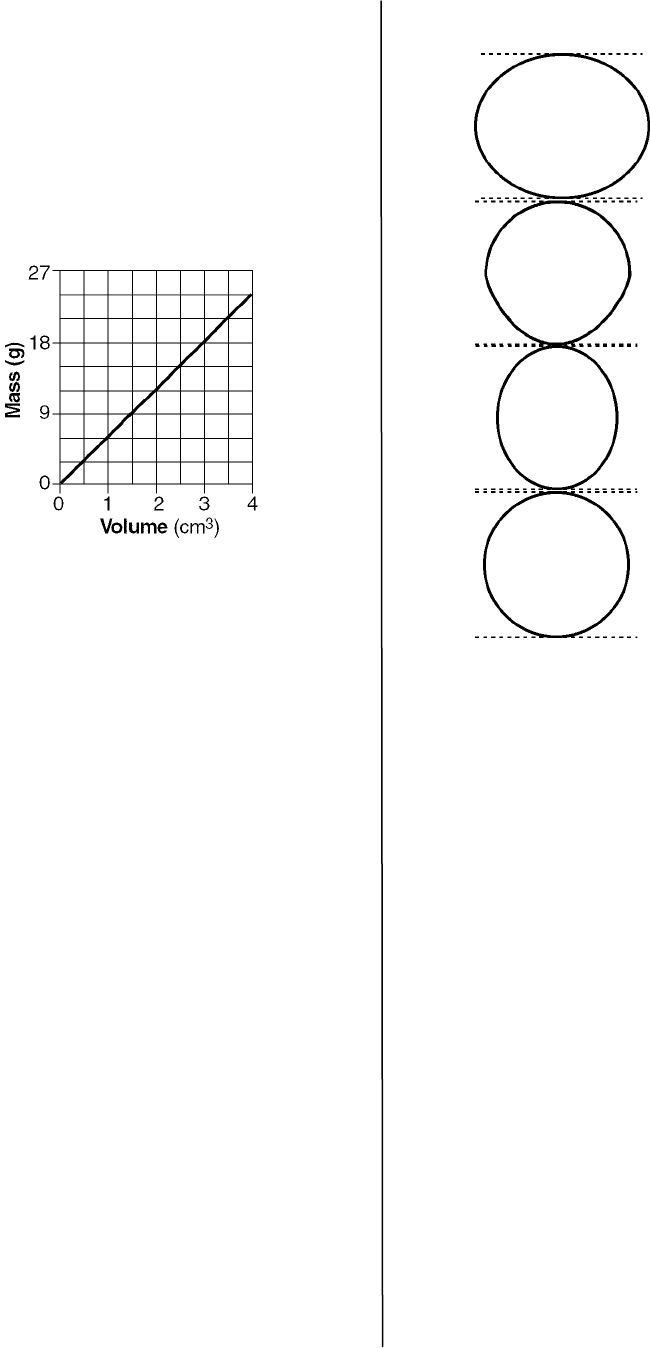
2) The graph below shows the relationship between the mass
and volume of a mineral. What is the dens ity of this mineral?
A) 30 g/cm
3
B) 9.0 g/cm
3
C) 6.0 g/cm
3
D) 4.5 g/cm
3
3) Under the same conditions of temperature and pressure,
three different samples of the same uniform substance will
have the same
A) volume
B) s hape
C) dens ity
D) mas s
4) Measurements taken from space show the Earth to be
A) pear shaped
B) greatest in diameter at the Equator
C) a perfect sphere
D) greatest in diameter at the poles
5) Which diagram most accurately shows the cross-sectional
shape of the Earth?
A)
B)
C)
D)
6) If wastewater from a nuclear power plant raises the
temperature of a nearby body of water, the concentration of
biologic pollutants in the water will most likely
A) increase
B) rema in th e s a me
C) decrease
7) From which set of polar and equatorial diameters can the
actual shape of the Earth be inferred?
A) polar diameter = 12,756 km,
equatorial diameter = 12,714 km
B) polar diameter = 12,756 km,
equatorial diameter = 12,756 km
C) polar diameter = 12,714 km,
equatorial diameter = 12,756 km
D) polar diameter = 12,714 km,
equatorial diameter = 12,714 km
8) What is the mass of a rock that has a density of 2.5 grams
per cubic centimeter and a volume of 4.0 cubic centimeters?
A) 4.0 g
B) 10.0 g
C) 6.2 g
D) 1.6 g
9) Which list shows atmospheric layers in the correct order
upward from the Earth's surface?
A) troposphere, stratosphere, mesosphere, thermosphere
B) stratosphere, mesosphere, troposphere, thermosphere
C) thermosphere, mesosphere, stratosphere, troposphere
D) thermosphere, troposphere, mesosphere, stratosphere
8035 - 1 - Page 1
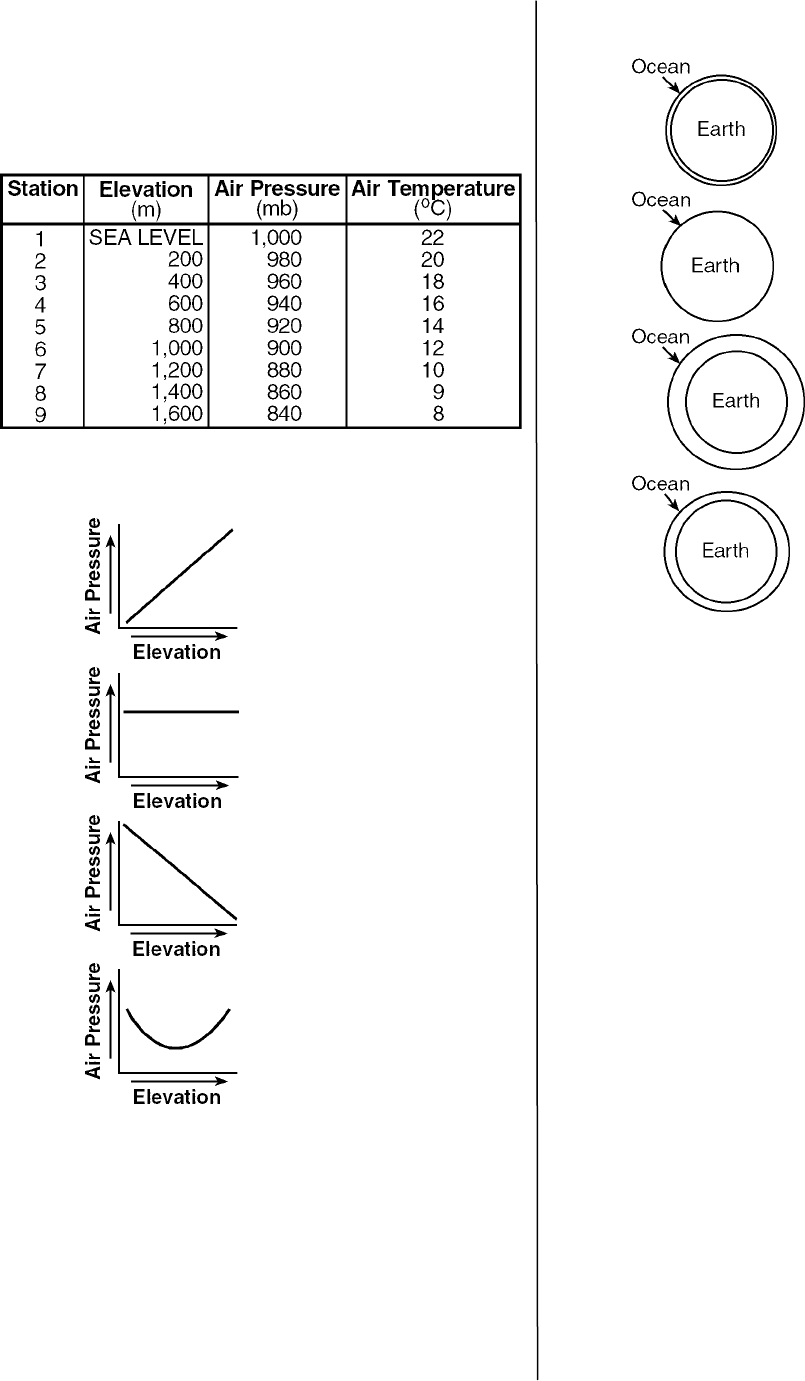
Questions 10 and 11 refer to the following:
The data table below shows the air pressures and air temperatures
collected by nine observers at different elevations on the same
side of a high mountain. The data was collected at 12:00 noon on a
clear, calm day.
10) Based on the data collected, which graph best represents
the relationship between elevation above sea level and air
pressure?
A)
B)
C)
D)
11) From sea level to an elevation of 1,200 meters , air press ure
decreased at the rate of
A) 10.0 mb/m
B) 1.0 mb/m
C) 100.0 mb/m
D) 0.1 mb/m
12) Which diagram best represents the Earth with the ocean
depth drawn to scale?
A)
B)
C)
D)
13) A student classifies several objects. The classification
system should be based on
A) interpretations
B) inferences
C) obs ervations
D) hypotheses
14) The actual polar diameter of the Earth is 12,714 kilometers .
The equatorial diameter of the Earth is approximately
A) 12,757 km
B) 12,714 km
C) 12,700 km
D) 12,671 km
15) According to the Earth Science Reference Tables, if
atmospheric pressure measurements were taken at regular
intervals from sea level to the stratopause, the
measurements would most likely show that the pressure
A) decreases, only
B) increases, only
C) decreases, then increases
D) remains the same
16) In which atmospheric layer is most water vapor found?
A) thermosphere
B) mesosphere
C) troposphere
D) stratosphere
17) The solid rock material that directly underlies the sediments
on the ocean floor is part of the Earth's
A) troposphere
B) lithos phere
C) hydrosphere
D) outer core
18) According to the Earth Science Reference Tables, what is
the temperature of the atmosphere at the stratopause?
A) -55DC
B) 0
D
C
C) 15DC
D) -90
D
C
8035 - 1 - Page 2
19) What are the best frames of reference for describing
change?
A) volume and mass
B) time and distance
C) speed and density
D) weight and temperature
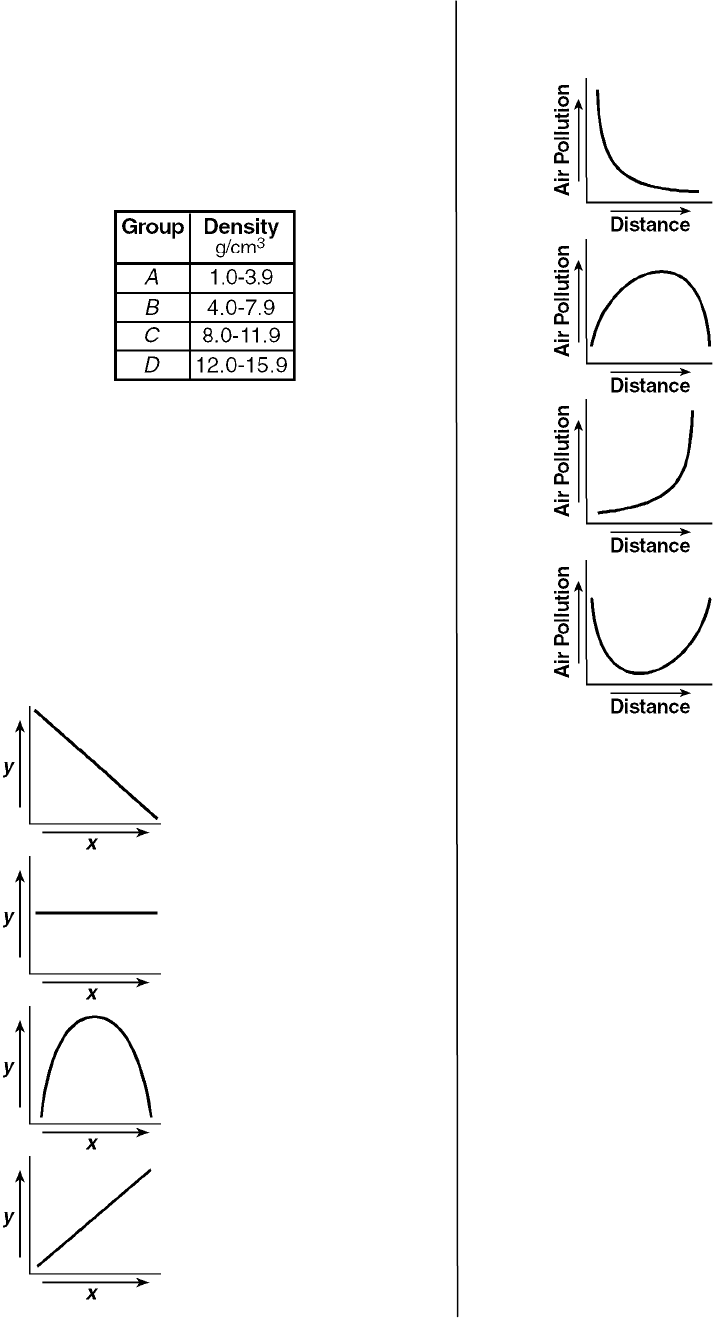
20) The table below identifies four density groups.
According to this classification system, a sample of quartz
with a mass of 27 grams and a volume of 10 cubic
centimeters should be placed in group
A) A B) B C) C D) D
21) According to the Earth Science Reference Tables, the most
abundant gas in the troposphere is
A) oxygen
B) carbon dioxide
C) nitrogen
D) water vapor
22) Which graph best shows the general relationship between
the population density of an area (x-axis) and the amount of
pollution in the area (y-axis)?
A)
B)
C)
D)
23) Which graph best represents the most common relationship
between the amount of air pollution and the distance from
an industrial city?
A)
B)
C)
D)
24) The total amount of water vapor per cubic meter in the
atmosphere at sea level is approximately
A) 1 g/m
3
B) 8 g/m
3
C) 15 g/m
3
D) 30 g/m
3
25) Students calculated the circumference of a globe to be
60. centimeters. The actual circumference of the globe is
63 centimeters. The percent deviation of the students'
calculation was
A) 0.48%
B) 4.8%
C) 21%
D) 5.0%
26) The best example of a noncyclic event is
A) a phase change of the Moon
B) a volcanic eruption
C) an apparent star movement
D) a change of seasons
8035 - 1 - Page 3
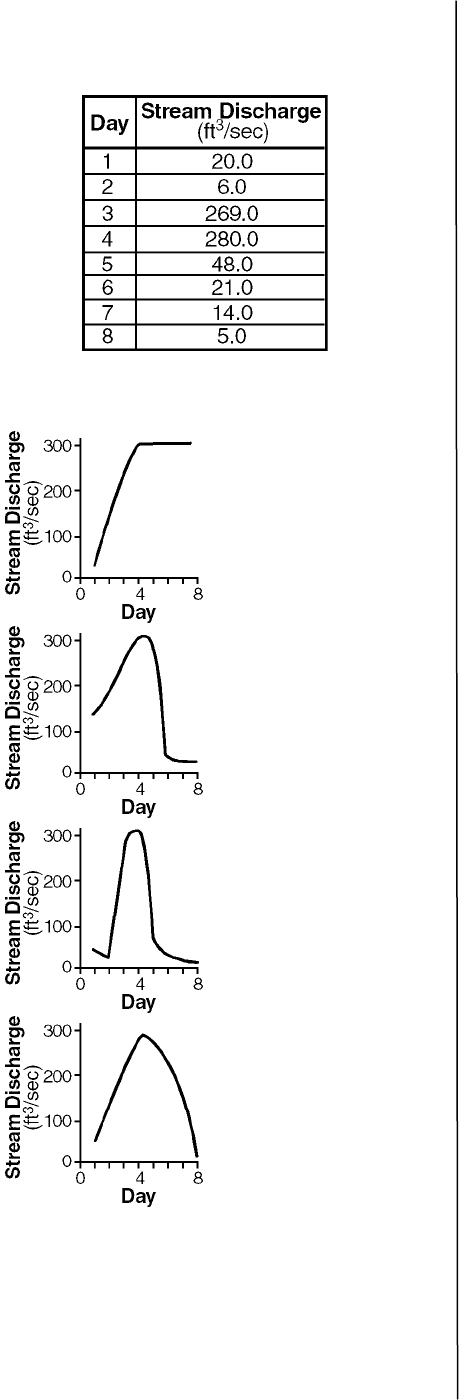
27) The data table below shows the stream discharge in April
for a creek in the southern United States for a period of
8 days .
Which graph most accurately shows stream discharge for
the 8-day period?
A)
B)
C)
D)
28) Oxygen is the most abundant element by volume in the
Earth's
A) hydrosphere
B) inner core
C) crus t
D) troposphere
29) Which statement about a rock sample is most likely an
inference?
A) The rock is made of small, dark-colored crystals.
B) The rock has thin, distinct layers.
C) The rock has flat sides and sharp corners.
D) The rock has changed color due to weathering.
30) According to the Earth Science Reference Tables, as
altitude increases from the tropopause to the mesopause,
the atmospheric temperature will
A) increase, then decrease
B) decrease, only
C) decrease, then increase
D) increase, only
31) The primary purpose of a classification system is to enable
people to
A) extend their powers of observation
B) eliminate inaccurate inferences
C) organize observations in a meaningful way
D) make measurements that are very accurate
32) While walking on a glacier, an observer makes several
statements. Which statement is an inference?
A) "Some parts of this glacier will start melting this
spring."
B) "There are many cracks in this glacier."
C) "The rocks on this glacier are of different sizes."
D) "Some of the snow on this glacier is powdery."
33) According to the Earth Science Reference Tables, the
temperature in the stratosphere ranges from approximately
A) 10
D
F to 35
D
F
B) -55DF to 0DF
C) 10
D
C to 50
D
C
D) -55DC to 0DC
34) A student determines the density of a mineral to be
3.5 grams per cubic centimeter. If the accepted value is
4.8 grams per cubic centimeter, what is the student's
approximate percent error?
A) 73%
B) 37%
C) 13%
D) 27%
35) According to the Earth Science Reference Tables, what is
the approximate thickness of the troposphere?
A) 27 km
B) 50 km
C) 7 km
D) 12 km
36) An interface is best described as a
A) region where no changes are occurring
B) region that lies just below the surface of the Earth
C) boundary across which energy may be exchanged
D) change in the state of the environment
37) The use of a triple-beam balance to determine the mass of a
rock is an example of measuring by using
A) all of the five senses
B) a direct comparison with a standard
C) inferences and interpretations
D) a combination of dimensional quantities
8035 - 1 - Page 4
38) Water has the greatest density at
A) 100
D
C in the gaseous phase
B) 4DC in the s olid phas e
C) 0
D
C in the s o lid phas e
D) 4DC in the liquid phas e
39) The best evidence that the Earth has a spherical shape
would be provided by
A) the prevailing wind direction at many locations on the
Earth's surface
B) photographs of the Earth taken from space
C) the time the Earth takes to rotate on its axis at different
times of the year
D) the change in the time of sunrise and sunset at a single
location during 1 year
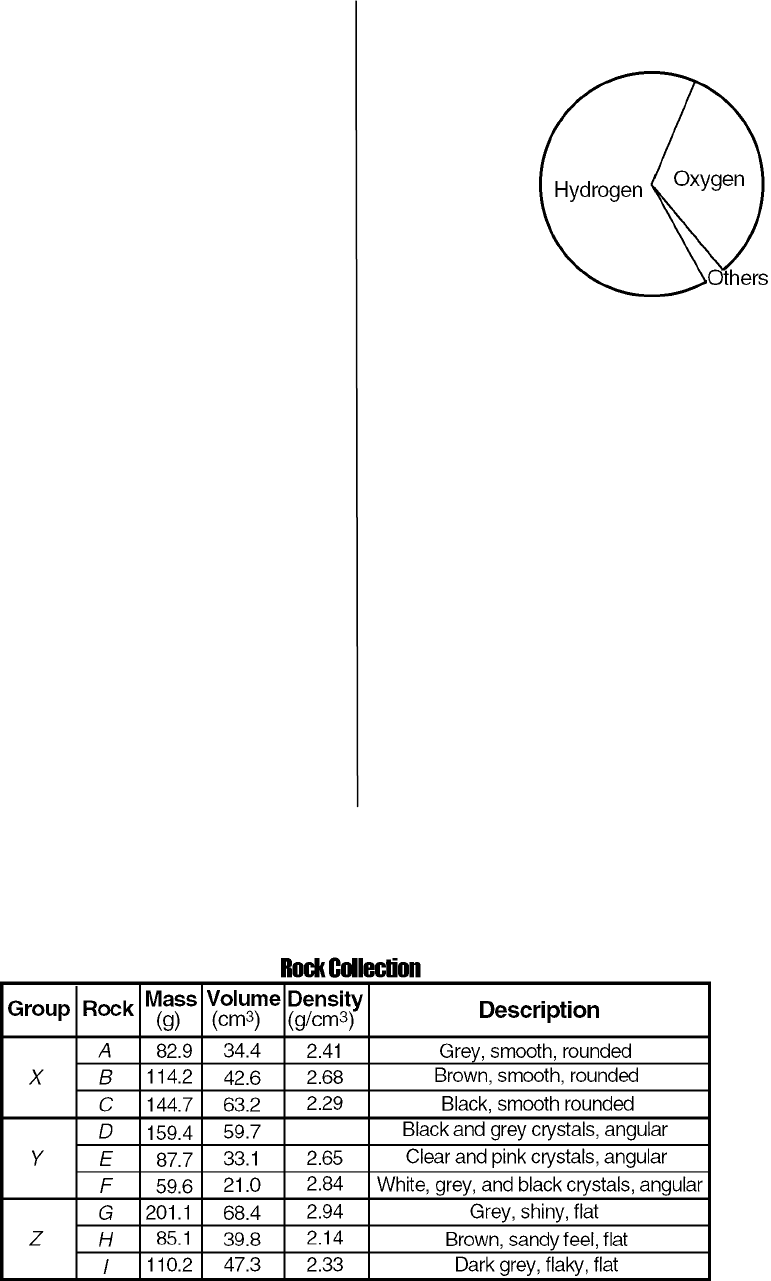
40) The graph below represents percentage of elements by
volume.
According to the Earth Science Reference Tables, this
graph best represents the elements of the Earth's
A) hydrosphere
B) stratosphere
C) lithos phere
D) troposphere
41) Which layer of the atmosphere has the greatest density?
A) stratosphere
B) thermos phere
C) troposphere
D) mesosphere
42) A student determines the density of a rock to be 2.2 grams
per cubic centimeter. If the accepted density of the rock is
2.5 grams per cubic centimeter, what is the percent deviation
(percentage of error) from the accepted value?
A) 13.6%
B) 12.0%
C) 30.0%
D) 8.8%
43) A pebble has a mass of 35 grams and a volume of 14 cubic
centimeters . What is its dens ity?
A) 2.5 g/cm
3
B) 490 g/cm
3
C) 4.0 g/cm
3
D) 0.4 g/cm
3
Questions 44 through 46 refer to the following:
The table below shows data for a student's collection of rock samples A through I, which are classified into groups X, Y, and Z. For
each rock sample, the student recorded mass, volume, density, and a brief description. The density for rock D has been left blank.
8035 - 1 - Page 5
44) Which statement is an inference rather than an observation?
A) Rock E has a volume of 33.1 cm
3
.
B) Rock G is the same color as rock I.
C) Rock B has been rounded by stream action.
D) Rock H is flat.
45) The approximate density of rock sample D is
A) 3.75 g/cm
3
B) 3.32 g/cm
3
C) 2.75 g/cm
3
D) 2.67 g/cm
3
46) The student broke rock G into two pieces. Compared to the
density of the original rock, the density of one piece would
mos t likely be
A) greater
B) les s
C) the s ame
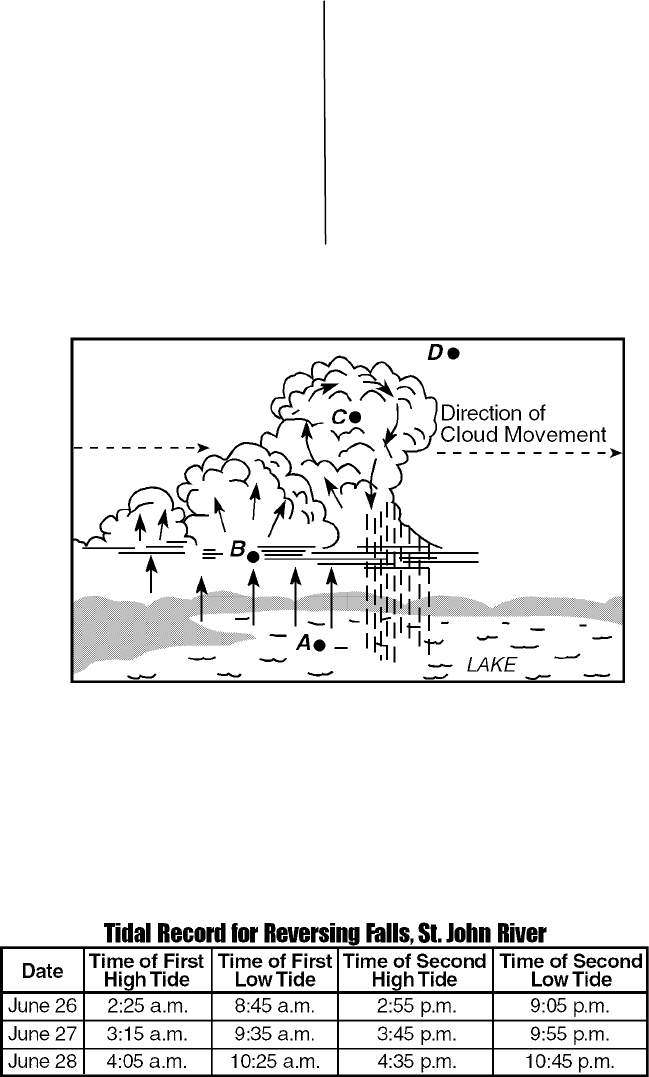
47) The diagram below shows air movements associated with cumulus cloud formation over a lake during a summer day. A, B, C, and
D are reference points.
Point D is 10 kilometers above the Earth's surface. In which layer of the atmosphere is point D located?
A) upper stratosphere B) lower s tratos phere C) lower mesosphere D) upper troposphere
Questions 48 through 50 refer to the following:
The Bay of Fundy, located on the east coast of Canada, has the highest ocean tides in the world. The St. John River enters the Bay of
Fundy at the city of St. John, where the river actually reverses direction twice a day at high tides. Data for the famous Reversing Falls
of the St. John River are given below for high and low tides on June 26 through 28, 1994.
48) Compared to the first high tide on June 26, how much later
in the day did the first high tide occur on June 27?
A) 10 min
B) 5 h 40 min
C) 50 min
D) 1 h 10 min
8035 - 1 - Page 6
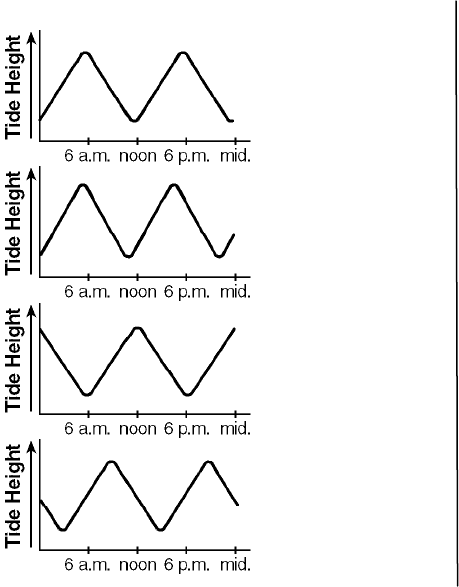
49) Which graph best represents the tides recorded on June 28?
A)
B)
C)
D)
50) Tides in the Bay of Fundy are best described as
A) predictable and cyclic
B) unpredictable and noncyclic
C) unpredictable and cyclic
D) predictable and noncyclic
8035 - 1 - Page 7
